|
|
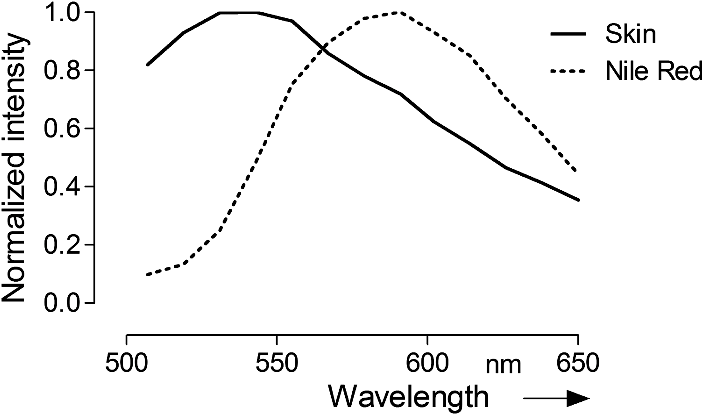
1.IntroductionThe visualization of intrinsic and extrinsic substances in biological tissue is a very common task in the area of biomedical imaging. Fluorescence microscopy is a widely used technique to assess the local distribution of either intrinsic autofluorescent structures or incorporated fluorescent molecules. In the field of investigating drug delivery into biological tissue, especially skin tissue, fluorescent dyes are utilized in many cases as model agents. Amongst other techniques confocal,1 multiphoton2–5 and widefield6 microscopy is used to evaluate pharmaceutical transdermal and dermal delivery systems.7–9 Amongst others, highly potent approaches for delivery and therapy are micro-emulsion10–12 and nanoparticle13 formulations. Transdermal delivery systems are used for systemic drug distribution. Therefore the amount that permeated through the skin is of interest. In vivo studies commonly analyze the drug concentration in blood while in vitro studies, for example, have to analyze the concentration in equivalent receptor fluids. The drug concentration is normally determined by enzyme-linked immunosorbent assay (ELISA) or high-performance liquid chromatography (HPLC). The focus of dermal delivery systems is the penetration of drugs into the skin layers. An important parameter that can be assessed microscopically using vertical slices of the tissue is the penetration depth. The origin of tissues can be from excised skin addressing in vitro studies or in case of in vivo studies from skin biopsies. However, elaborated approaches using tape-stripping and HPLC analysis are often used for evaluation. HPLC analysis allows quantification of the drug in the whole sample without showing the distribution. Microscopy on the other hand shows the pathways of the transport but lacks the possibility to quantify without further calibration efforts.1 Microscopic tissue imaging is very promising in terms of identifying pathways and providing further inside in penetration processes. However, a major problem is that tissue often shows strong autofluorescence. Especially skin is very complex and consists of various endogenous fluorophores, such as melanin, elastin, riboflavin and NAD(P)H2 and possesses a broad autofluorescence spectrum that may interfere with incorporated external dyes. Due to the overlapping spectra, the origin of the fluorescence in microscopic images cannot be easily distinguished by signal intensity alone. Recording spectral information along with intensity images would help in the identification. Some approaches for recording spectral information by means of hyperspectral setups can be found in the literature. Previous studies describe the penetration of fluorophores into skin, skin tumor and irradiation investigations and the assessment of bruised and traumatic skin injuries.14–19 Numerous further reports on spectral imaging that do not cover skin research are available.20–24 In this work we present a new confocal imaging approach with microscopic spatial resolution to visualize spectral information in tissue. The appropriate image processing steps based on normalized cross-correlation and the derivation of a new quantitative measure is described. The method is tested in the context of pharmaceutical development of drug delivery systems. In this study it is used to localize and evaluate fluorescent dyes in vertical slices of excised porcine skin to quantify uptake efficiency of a submicron emulsion for dermal transport. Although the method is discussed in the field of pharmaceutics, the method can be useful in more general applications in life-science imaging. Therefore, in addition to the presented in vitro considerations, potential in vivo applications are discussed. 2.Material and Methods2.1.Fluorescent Probe and Skin AutofluorescenceNile Red (Sigma-Aldrich, Germany) was used as a lipophilic fluorescent dye in the prepared submicron emulsion. The fluorescence spectrum of Nile Red remains stable over a wide pH range while influenced by the polarity of its solvents.25 Figure 1 shows the emissions spectra of the dye, solved in 70% ethanol, in comparison to natural porcine skin measured by the confocal laser-scanning microscope. Nile Red has an emission peak at 580 nm excited with the 476 nm line of an argon laser. The broad autofluorescence spectrum of skin exists due to the numerous intrinsic fluorophores. 2.2.Drug Delivery System PreparationSubmicron emulsions were chosen as a delivery system because they have shown to enhance the penetration of substances into skin due to their particle size and surfactants.26 Submicron emulsions are oil-in-water emulsions with a droplet size below one micrometer. It is a kinetic stable emulsion in which the droplet size is achieved by an incorporation of emulsifiers.27 The oil phase consisted of oleth-3, -10, ethyloleat (Croda, Germany), coco-caprylat/caprat, cetearyl isononanoat (Cognis, Germany) and 0.002% Nile Red, while the aqueous phase consisted of sodium chloride, citric acid, potassium sorbate (Fagron, Germany), magnesium sulfate and glycerol (Caelo, Germany). The surfactant concentration was adjusted to achieve a hydrophilic-lipophilic balance value of 11. All ingredients obtained were of pharmaceutical grade. The physico-chemical properties were recorded to characterize the delivery system. The dynamic light scattering analyzing method (Zetasizer Nano ZS 90, Malvern Instruments, UK) showed a z-average size of with a polydispersity index of . The viscosity of was determined by RheoStress 300 Rheometer (ThermoHaake, Germany). Due to the preservation with potassium sorbate, the pH value was adjusted to . 2.3.Porcine Skin SamplesPorcine ear skin is quite similar to human skin and was therefore used in this study.28 Fresh ears of domestic pigs were obtained from a local abattoir and kept on ice during transport to the laboratory. After slaughtering, porcine ears were cleaned with water and shaved to remove the bristles. The full thickness skin was displaced with a scalpel and stored at for less than three months. Two preparation methods were used to obtain reference skin samples for validation measurements and penetration skin samples. The latter were used for the penetration study that evaluates delivery system performance. 2.4.Reference Skin SamplesThe frozen skin specimens were cut into 10-μm thick slices using a cryo-microtom (Leica Microsystems, Germany) and then transferred into 70% ethanol with different Nile Red concentrations for 10 min. The dye was soaked up and excessive dye was removed from the skin under flowing water. The dye concentrations (0.2, 1, and ) were chosen to cover a common recovery range of agents in the specimens of drug penetration studies. These reference skin samples were used to derive the sensitivity of the imaging scheme. 2.5.Penetration Skin SamplesThe penetration of Nile Red into skin was performed on a Franz diffusion cell setup. On the day of experiment the frozen skin was thawed and fixed between the donor and receptor chamber of the Franz diffusion cell (Gauer Glas, Puettlingen, Germany). The penetration area had a diameter of and was in contact to 12 mL phosphate buffered saline (PBS) temperatured to 32.5 °C on the dermis side. The submicron emulsion was applied as infinite-dose (300 µL) for 3 h, 6 h, 8 h and 24 h to three porcine skin samples each to get a total of 12 experiment samples. After each time period, the skin was removed from the diffusion cell, wiped and washed with 50 mL aqua dest. The specimen was mounted into a freezing medium (Leica, Germany), shock frozen by fluid nitrogen and cut into various 10 μm thick vertical slices in order to prepare penetration samples for microscopy. 2.6.Spectral ImagingSpectral imaging was performed using a TCS SP5 confocal laser-scanning microscope (Leica Microsystems, Mannheim, Germany) equipped with a detection unit that allows spectral discrimination to selectively detect narrow wavelength bands. The recorded fluorescence emission region (excitation at 476 nm) starting at 495 nm up to 650 nm (divided into 10 single detection bands that are 20 nm wide) was chosen to cover the spectra of porcine skin and Nile Red. A 0.7 NA water immersion objective () was used and the image resolution was set to with a pixel size of , resulting in a field of view of . The generated image stacks were of the dimensions . The reference spectrum of Nile Red was recorded in the same way. Figures 2 and 3 give an overview of a 24 h penetration sample in comparison to natural (untreated) skin. The series of -stack pictures and an exemplary spectrum of the selected regions of interest (ROI) are shown to illustrate the different spectra. These spectral differences are used for the image processing scheme. 2.7.Image Processing SchemeThe image processing starts with the application of a threshold to exclude pixels with low intensities. The background or noisy image regions are excluded from the calculations. In the next step, the intensity data are normalized along the -axis to calculate intensity independent spectra for each image pixel. The normalized cross correlation () metric is used to quantify the similarity between the normalized sample spectra and the reference spectra of Nile Red. where is the normalized intensity at position of the reference spectrum, is the normalized intensity at position of the sample spectrum, is the mean intensity value of the normalized reference spectrum and is the mean intensity value of the normalized sample spectrum.The resulting correlation coefficient map of the image is built on the spectral information in the sample and is therefore based on dye distribution. Hereby, the highest value of one represents complete accordance between sample and reference spectrum. Decreasing values indicate decreasing correlation of the spectra. To enable a comparison of the different images, the uptake indicator is introduced. It represents the quantity of coefficients higher than a threshold normalized to the total number of pixels representing tissue. These tissue pixels are derived by calculating the standard deviation of the normalized spectral data for every pixel. A uniformly distributed intensity profile along the -axis indicates background pixels that are not included in the calculations.Because depends on an arbitrary threshold, two evaluation experiments were carried out. In the first experiment untreated skin samples were used to calculate the fraction that is false positively classified as Nile Red pixels with increasing threshold values (see Table 1). Table 1Measurements of untreated skin samples (n=5) for the evaluation of the 0 parameter.
Table 2Presentation of the skin penetration results in mean UI0.8 and standard deviation for the four time periods.
Table 1 indicates the fraction of pixels of an untreated skin sample that are false positively calculated to be similar to the dye reference spectrum. In the second experiment the reference skin samples were used to evaluate the highest threshold that allows a clear discrimination between the used concentrations. Figure 4 shows the results of the reference samples indicating that is not suitable to allow discrimination of the two lowest concentrations, whereas it is possible when using . Considering the very low false positive classification of. 02%, was used as the evaluation parameter for further experiments. 2.8.Validation MeasurementsTo confirm that the scheme is not depending on absolute intensity values, the samples were imaged with different intensification by varying photomultiplier (PMT) voltages in a range from 500 V to 1200 V in eight steps. was calculated for every image and was expected to be constant for different image intensity levels. For the second experiment the focal depth was changed during imaging of two skin samples and was calculated to assess the influence of focusing. 3.Results3.1.Scheme ValidationThe results of the validation experiment for varying signal intensities are shown in Fig. 5(a). Regarding the variation of the PMT voltage to modify the image intensity, is nearly constant over a 200 to 300 V region for the 24 h and 8 h samples. The increase at 500 to 600 V can be explained with the very low overall intensity of the spectral images at 500 V. Thus, the spectra cannot be properly measured. The decrease starting at 900 to 1000 V can be observed due to a strong signal saturation effect in single spectral bands for the 8 h and 24 h samples. Therefore, the spectral information is lost because of detector saturation. The 6 h sample has a value that is constant over the range of 600 to 1200 V. Fig. 5The graphs show the results of the varying PMT (a) and focus (b) settings. The image sequences illustrate the changes in the data when varying the PMT voltage and the focus depth, respectively. 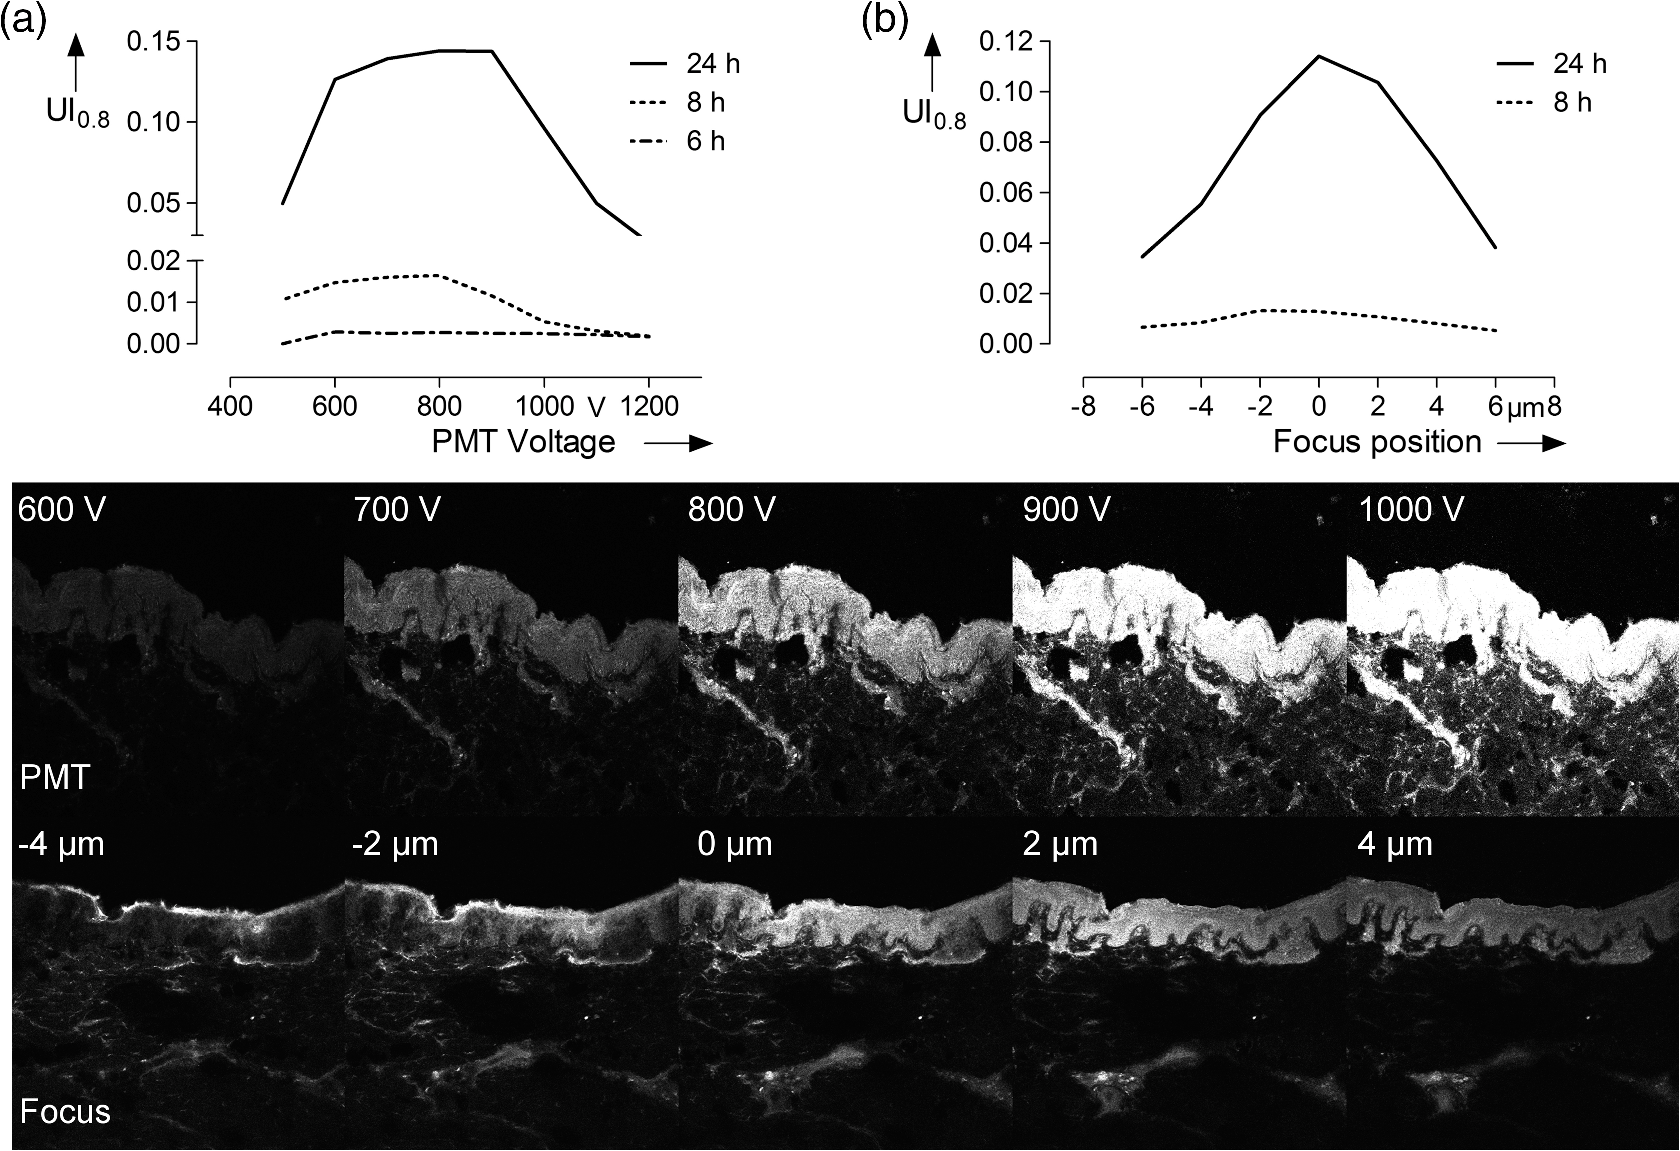 These measurements indicate that the values do not change significantly over a broad intensity interval when using reasonable imaging parameters. Focus position, in contrast, is a very sensitive parameter. The graph in Fig. 5(b) shows a Gaussian-like distribution of with varying focus depths for the 10 µm thick sample. The measurements indicate that it is important to focus carefully for getting reliable results. Considering the moderate change around the to 1 µm relative focus position, a roughly 3-μm tolerance margin for focusing can be supposed. 3.2.Skin Penetration StudyThe results of the penetration study show a strong time dependence of dye uptake in skin (see Fig. 6 and Table 2). The assessment of this uptake using the parameter allows the quantitative comparison of the four time periods. It shows that the 24 h samples have a more than four times higher mean value compared to the 8 h samples. Fig. 6Skin penetration study results ( per penetration period). Data are presented in mean . * and *** evaluated by paired Student’s -test. The 24 h samples show a significantly higher uptake of Nile Red. 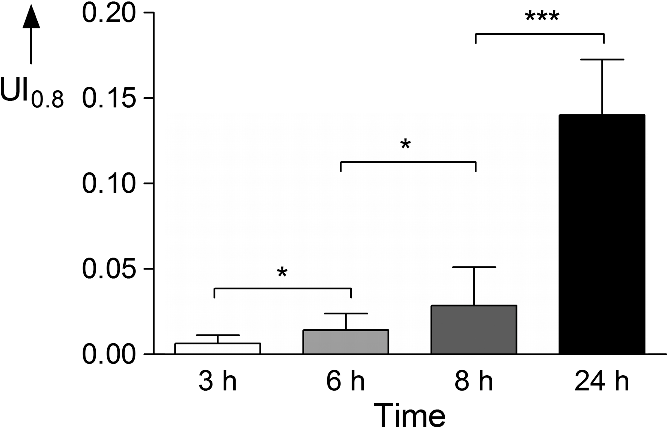 The overlay intensity-based images and the spectrally resolved dye distribution are shown in Fig. 7. The intensity-based images were recorded with optimized parameters to achieve high image quality. The dye distribution was visualized using the correlation coefficient map and the parameter as a threshold. The epidermal skin layer can be distinguished from the lower dermal layer due to its bright gray appearance. The darker dermal layer, however, shows brighter structures throughout the whole area. Dye distribution, shown in red, indicates that for the 3 h, 6 h and 8 h samples, the uptake does not cover the whole epidermis in the way that the criteria is fulfilled. The 24 h sample shows complete uptake in the epidermis and additional uptake in the dermis layer. 4.DiscussionIt was shown that a spectrally resolved imaging and processing method can be used to assess and compare spectral information in tissue. The processing scheme calculates the introduced uptake indicator that derives from spectral correlation analysis. It can be used for mapping spectral information in microscopic images of tissue. The method is developed and validated in the context of a very frequently performed penetration experiment according to the OECD Guidelines for Testing of Chemicals in pharmaceutical research. However, the scope of the method is not limited to drug delivery studies but can be transferred to further applications that need spectral discrimination at a microscopic scale. 4.1.Pharmaceutical In Vitro ExperimentsHigh dermal transport is important to address skin diseases occurring in the upper layers. Tape-stripping methods are commonly used to stepwise ablate small parts of the outer skin for quantitatively analyze depth profiles.29 However, it is limited to the stratum corneum and does not give any information of the homogeneity and the distribution of drugs in the skin layer itself. In contrast, microscopic evaluation of vertical slices has the capability to show profiles directly throughout the whole skin, but lacks the possibility to quantify the amount of penetrated substances. Schmidts30 presented a skin penetration study that correlated an ELISA based quantification with an intensity-based microscopy evaluation method. The results were of good qualitative accordance indicating the suitability of the microscopy approach for evaluating dermal delivery systems. The developed uptake indicator of this paper was a consequent advancement of Schmidts’ microscopy analysis. It allows indirect quantitative measurements and is a step towards the quantitative evaluation of dermal delivery systems and processes. The results of the presented penetration study support this statement as they show a clear discrimination of the four time periods. Our proposed method may also be beneficial to studies involving applications of spectral and hyperspectral imaging of penetration studies. Roberts; et al.; performed delivery studies using a FLIM multiphoton system4 that is capable of spectrally detecting fluorescence signal to compare liposome systems. They concluded that the deformability of the liposomes increases penetration based on visual evaluation. In this case, the uptake indicator could be used to obtain comparable results and further increase insight into underlying penetration processes. Hernandez-Palacios14 introduced a hyperspectral camera system with 20 µm spatial resolution to evaluate penetration studies. The hyperspectral camera detected the emission peak of Alexa 488 (518 to 524 nm) and therefore avoided the use of fluorescence filters. However, the evaluation is based on the fluorescence intensity that is composed of Alexa dye and skin autofluorescence background. Skin structures like melanin and keratin, with an emission peak at 520 nm,2,4 contribute to this intensity. Subtraction of a constant offset value compensates the overlaying signal. Figure 7 illustrates that, when using microscopic resolution, structures of the skin are brightly visible that are not covered with dye. In this case, the overlapping and superimposing signal of the skin and dye vary depending on microscopic structures that are not equally distributed. Hence, a constant autofluorescent background offset cannot be defined and mapping of the dye based on intensity in the microscopic scale is not possible. 4.2.Advantages and Drawbacks for Delivery StudiesThe spectral imaging scheme has several benefits. Additional to the advantage of accurate dye mapping, spectral analysis is superior to intensity-based methods in terms of experiment procedures because it does not require standardized imaging. In general, the emission intensity in confocal microscopy depends on various parameters. Therefore, when using intensity-based methods, it is a comprehensive but very important task to use constant settings in order to assure the comparability of the results. This standardization process requires the assessment and control of imaging setup and sample conditions. While the setup may be kept constant for a whole experiment with certain effort, the sample conditions cannot be controlled easily due to their biological nature. It is known that the pH-value changes in different skin layers31 and may influence the intensity of dyes that have a strong pH-dependency. Apart from the pH value, fluorescence emission can also be affected by polarity. In the case of Nile Red, the fluorescence is unaffected by pH-values between 4.5 and 8.5 but the emission peak shifts depending on the polarity of the environment.25 A possible shift must be considered for choosing the appropriate reference spectrum for image processing calculations. Additionally, photobleaching is a serious problem that requires attention. Borgia6 reports a 4 to 16% bleaching rate after a one second illumination of Nile Red. It is concluded that the images have to be taken within 10 ms to avoid a strong signal variation. The spectral data do not depend on absolute intensity values but on relative intensity changes between single wavebands. Consequently they are less sensitive to condition variations and photobleaching resulting in a high robustness of the calculated results. Figure 5 shows that the calculated assessment parameter is constant for reasonable changes of the imaging parameters. This allows measuring every sample with individual settings without the need to use standardized imaging parameters for comparing the results. The advantage is a broad, analyzable concentration range of fluorescent dye in skin specimens. This is especially useful for comparing completely independent experiment setups. Another advantage of the spectral method is that it is still applicable whenever dyes with emission spectra that are clearly separated from the skin spectrum are not available. Although the spectra overlap, an explicit correlation to either dye or tissue can still be performed. As a result, a reliable assessment of the spatial distribution of dye in tissue is possible. The parameter that is chosen for the evaluation of the penetration study is an arbitrary measure. It is important to understand that it cannot be used to quantitatively assess the total amount of dye in skin. Due to the overlapping dye and skin spectra, it is difficult to determine the exact correlation coefficient that describes the transition between the two possible signal origins. The parameters are used to arbitrarily classify the calculation results into dye and tissue pixels according to a threshold value. For this reason the proposed spectral method is not applicable for tasks that need exact quantitative results. In these cases intensity-based methods can be used that need to be calibrated or intensity corrected. Monte Carlo simulations that determine and compensate for effects of signal attenuation due to scattering and absorption32 are often applied for these applications. Combining these techniques with the spectral evaluation for penetration studies would add valuable information to the localization and penetration depth of dye and agents. 4.3.Pharmaceutical In Vivo ExperimentsIt is arguable that in vitro results can be used to assess delivery systems designed for in vivo use. No clear data is available in the literature as there are many studies with good and poor correlation between in vitro and in vivo results.33 Therefore, in vitro results for drug delivery cannot be transferred directly to in vivo considerations without further investigation. For this reason, studies are performed with a parallel in vivo/in vitro setup34–36 using living mice for the application and penetration of delivery systems and substances. The mice either are sacrificed or biopsies are taken for analysis afterwards. An approach for in vivo imaging without sacrificing the animals is the use of animal window models.37,38 Here, the living animal can be microscopically examined directly through windows that are surgically inserted into the region of interest. Whenever living animals are observed motion artifacts have to be considered and either fixation or synchronizing the scanning system to the heartbeat needs to be performed. Amornphimoltham39 reviewed further in vivo applications for drug delivery research and showed the technical efforts that have to be made for data acquisition. 4.4.Feasibility for Clinical In Vivo ApplicationsGareau40 presented an approach of in vivo confocal reflectance microscopy for the detection of early-stage melanoma of murine skin without further surgical interventions. Lange-Asschenfeld41 and Caspers42 showed confocal laser-scanning microscopes for in vivo imaging of human skin morphology and wound healing. Both studies mention the potential use for pharmaceutical research on drug delivery. A combination of the proposed microscope setup and our spectrally resolved detection unit could be used for optical sectioning and evaluation of fluorescent dyes in living tissue. Additionally, the in vivo microscopy scheme presented by Gareau combined with our proposed spectral uptake indicator could be used in clinical applications like melanoma detection presented by Kuzmina15 for monitoring size and shape variations. Extending established microscopic in vivo imaging schemes with our proposed spectral evaluation method has the chance to provide additional information for pharmaceutical and clinical applications. However, further investigation is necessary to validate these potential approaches. AcknowledgmentsWe would like to thank the Hessen State Ministry of Higher Education, Research and the Arts for the financial support within the Hessen initiative for scientific and economic excellence (LOEWE-Program). ReferencesR. Alvarez-Románet al.,
“Visualization of skin penetration using confocal laser scanning microscopy,”
Eur. J. Pharm. Biopharm., 58
(2), 301
–316
(2004). http://dx.doi.org/10.1016/j.ejpb.2004.03.027 EJPBEL 0939-6411 Google Scholar
K. Schenke-Laylandet al.,
“Two-photon microscopes and in vivo multiphoton tomographs—powerful diagnostic tools for tissue engineering and drug delivery,”
Advanced Drug Delivery Reviews, 58
(7), 878
–896
(2006). http://dx.doi.org/10.1016/j.addr.2006.07.004 ADDREP 0169-409X Google Scholar
S.-J. LinS.-H. JeeC.-Y. Dong,
“Multiphoton microscopy: a new paradigm in dermatological imaging,”
Eur. J. Dermatol., 17
(5), 361
–366
(2007). http://dx.doi.org/10.1684/ejd.2007.0232 EJDEE4 1167-1122 Google Scholar
M. S. Robertset al.,
“Non-invasive imaging of skin physiology and percutaneous penetration using fluorescence spectral and lifetime imaging with multiphoton and confocal microscopy,”
Eur. J. Pharm. Biopharm., 77
(3), 469
–488
(2011). http://dx.doi.org/10.1016/j.ejpb.2010.12.023 EJPBEL 0939-6411 Google Scholar
H. I. Laboutaet al.,
“Combined multiphoton imaging-pixel analysis for semiquantitation of skin penetration of gold nanoparticles,”
Int. J. Pharm., 413
(1–2), 279
–282
(2011). http://dx.doi.org/10.1016/j.ijpharm.2011.03.067 IJPHDE 0378-5173 Google Scholar
S. L. Borgiaet al.,
“Lipid nanoparticles for skin penetration enhancement-correlation to drug localization within the particle matrix as determined by fluorescence and parelectric spectroscopy,”
J. Contr. Release, 110
(1), 151
–163
(2005). http://dx.doi.org/10.1016/j.jconrel.2005.09.045 JCREEC 0168-3659 Google Scholar
M. R. PrausnitzR. Langer,
“Transdermal drug delivery,”
Nat. Biotechnol., 26
(11), 1261
–1268
(2008). http://dx.doi.org/10.1038/nbt.1504 NABIF9 1087-0156 Google Scholar
P. L. Honeywell-NguyenJ. A. Bouwstra,
“Vesicles as a tool for transdermal and dermal delivery,”
Drug Discov. Today Tech., 2
(1), 67
–74
(2005). http://dx.doi.org/10.1016/j.ddtec.2005.05.003 1740-6749 Google Scholar
R. H. H. Neubert,
“Potentials of new nanocarriers for dermal and transdermal drug delivery,”
Eur. J. Pharm. Biopharm., 77
(1), 1
–2
(2011). http://dx.doi.org/10.1016/j.ejpb.2010.11.003 EJPBEL 0939-6411 Google Scholar
M. Kreilgaard,
“Influence of microemulsions on cutaneous drug delivery,”
Advanced Drug Delivery Reviews, 54
(Suppl. 1), S77
–S98
(2002). http://dx.doi.org/10.1016/S0169-409X(02)00116-3 ADDREP 0169-409X Google Scholar
M. KreilgaardE. J. PedersenJ. W. Jaroszewski,
“NMR characterisation and transdermal drug delivery potential of microemulsion systems,”
J. Contr. Release, 69
(3), 421
–433
(2000). http://dx.doi.org/10.1016/S0168-3659(00)00325-4 JCREEC 0168-3659 Google Scholar
M. J. LawrenceG. D. Rees,
“Microemulsion-based media as novel drug delivery systems,”
Advanced Drug Delivery Reviews, 45
(1), 89
–121
(2000). http://dx.doi.org/10.1016/S0169-409X(00)00103-4 ADDREP 0169-409X Google Scholar
T. W. Prowet al.,
“Nanoparticles and microparticles for skin drug delivery,”
Advanced Drug Delivery Reviews, 63
(6), 470
–491
(2011). http://dx.doi.org/10.1016/j.addr.2011.01.012 ADDREP 0169-409X Google Scholar
J. Hernandez-Palacioset al.,
“Hyperspectral characterization of fluorophore diffusion in human skin using a sCMOS based hyperspectral camera,”
Proc. SPIE, 8087 808717
(2011). http://dx.doi.org/10.1117/12.889816 PSISDG 0277-786X Google Scholar
I. Kuzminaet al.,
“Towards noncontact skin melanoma selection by multispectral imaging analysis,”
J. Biomed. Opt., 16
(6), 060502
(2011). http://dx.doi.org/10.1117/1.3584846 JBOPFO 1083-3668 Google Scholar
S.-G. Kong,
“Inspection of poultry skin tumor using hyperspectral fluorescence imaging,”
Proc. SPIE, 5132 455
–463
(2003). http://dx.doi.org/10.1117/12.515151 PSISDG 0277-786X Google Scholar
M. S. Chinet al.,
“Hyperspectral imaging for early detection of oxygenation and perfusion changes in irradiated skin,”
J. Biomed. Opt., 17
(2), 026010
(2012). http://dx.doi.org/10.1117/1.JBO.17.2.026010 JBOPFO 1083-3668 Google Scholar
L. L. Randeberg,
“Hyperspectral imaging of bruised skin,”
Proc. SPIE, 6078 60780O
(2006). http://dx.doi.org/10.1117/12.646557 PSISDG 0277-786X Google Scholar
L. L. Randeberget al.,
“In vivo hyperspectral imaging of traumatic skin injuries in a porcine model,”
Proc. SPIE, 6424 642408
(2012). http://dx.doi.org/10.1117/12.699380 PSISDG 0277-786X Google Scholar
J. M. Beach,
“Portable hyperspectral imager for assessment of skin disorders: preliminary measurements,”
Proc. SPIE, 5686 111
–118
(2005). http://dx.doi.org/10.1117/12.590938 PSISDG 0277-786X Google Scholar
B. Parket al.,
“AOTF hyperspectral microscopic imaging for foodborne pathogenic bacteria detection,”
Proc. SPIE, 8027 802707
(2011). http://dx.doi.org/10.1117/12.884012 PSISDG 0277-786X Google Scholar
R. AroraG. I. PetrovV. V. Yakovlev,
“Hyperspectral coherent anti-Stokes Raman scattering microscopy imaging through turbid medium,”
J. Biomed. Opt., 16
(2), 021116
(2011). http://dx.doi.org/10.1117/1.3541796 JBOPFO 1083-3668 Google Scholar
G. N. StamatasN. Kollias,
“In vivo documentation of cutaneous inflammation using spectral imaging,”
J. Biomed. Opt., 12
(5), 051603
(2007). http://dx.doi.org/10.1117/1.2798704 JBOPFO 1083-3668 Google Scholar
C. Zakianet al.,
“In vivo quantification of gingival inflammation using spectral imaging,”
J. Biomed. Opt., 13
(5), 054045
(2008). http://dx.doi.org/10.1117/1.2982536 JBOPFO 1083-3668 Google Scholar
D. L. SackettJ. Wolff,
“Nile red as a polarity-sensitive fluorescent probe of hydrophobic protein surfaces,”
Anal. Biochem., 167
(2), 228
–234
(1987). http://dx.doi.org/10.1016/0003-2697(87)90157-6 ANBCA2 0003-2697 Google Scholar
D. I. FriedmanJ. S. SchwarzM. Weisspapir,
“Submicron emulsion vehicle for enhanced transdermal delivery of steroidal and nonsteroidal antiinflammatory drugs,”
J. Pharm. Sci., 84
(3), 324
–329
(1995). http://dx.doi.org/10.1002/(ISSN)1520-6017 JPMSAE 0022-3549 Google Scholar
T. Schmidts,
“Protective effect of drug delivery systems against the enzymatic degradation of dermally applied DNAzyme,”
Inter. J. Pharm., 410
(1–2), 75
–82
(2011). http://dx.doi.org/10.1016/j.ijpharm.2011.03.023 IJPHDE 0378-5173 Google Scholar
C. Herkenneet al.,
“Pig ear skin ex vivo as a model for in vivo dermatopharmacokinetic studies in man,”
Pharm. Res., 23
(8), 1850
–1856
(2006). http://dx.doi.org/10.1007/s11095-006-9011-8 PHREEB 0724-8741 Google Scholar
J. Lademannet al.,
“The tape stripping procedure—evaluation of some critical parameters,”
Eur. J. Pharm. Biopharm., 72
(2), 317
–323
(2009). http://dx.doi.org/10.1016/j.ejpb.2008.08.008 EJPBEL 0939-6411 Google Scholar
T. Schmidtset al.,
“Development of drug delivery systems for the dermal application of therapeutic DNAzymes,”
Inter. J. Pharm., 431
(1–2), 61
–69
(2012). http://dx.doi.org/10.1016/j.ijpharm.2012.04.034 IJPHDE 0378-5173 Google Scholar
H. Wagneret al.,
“pH profiles in human skin: influence of two in vitro test systems for drug delivery testing,”
Eur. J. Pharm. Biopharm., 55
(1), 57
–65
(2003). http://dx.doi.org/10.1016/S0939-6411(02)00125-X EJPBEL 0939-6411 Google Scholar
U. Maeder,
“Feasibility of Monte Carlo simulations in quantitative tissue imaging,”
International Journal of Artifical Organs, 33
(4), 253
–259
(2010). 0391-3988 Google Scholar
B. GodinE. Touitou,
“Transdermal skin delivery: predictions for humans from in vivo, ex vivo and animal models,”
Advanced Drug Delivery Reviews, 59
(11), 1152
–1161
(2007). http://dx.doi.org/10.1016/j.addr.2007.07.004 ADDREP 0169-409X Google Scholar
Z.-R. Huanget al.,
“In vitro and in vivo evaluation of topical delivery and potential dermal use of soy isoflavones genistein and daidzein,”
Inter. J. Pharm., 364
(1), 36
–44
(2008). http://dx.doi.org/10.1016/j.ijpharm.2008.08.002 IJPHDE 0378-5173 Google Scholar
F. C. Rossetti,
“A delivery system to avoid self-aggregation and to improve in vitro and in vivo skin delivery of a phthalocyanine derivative used in the photodynamic therapy,”
J. Contr. Release, 155
(3), 400
–408
(2011). http://dx.doi.org/10.1016/j.jconrel.2011.06.034 JCREEC 0168-3659 Google Scholar
M. E. M. J van Kuijk-Meuwissenet al.,
“Application of vesicles to rat skin in vivo: a confocal laser scanning microscopy study,”
J. Contr. Release, 56
(1–3), 189
–196
(1998). http://dx.doi.org/10.1016/S0168-3659(98)00087-X JCREEC 0168-3659 Google Scholar
M.-A. Abdul-Karimet al.,
“Automated tracing and change analysis of angiogenic vasculature from in vivo multiphoton confocal image time series,”
Microvascular Research, 66
(2), 113
–125
(2003). http://dx.doi.org/10.1016/S0026-2862(03)00039-6 MIVRA6 0026-2862 Google Scholar
S. Schlosseret al.,
“Paracrine effects of mesenchymal stem cells enhance vascular regeneration in ischemic murine skin,”
Microvasc. Res., 83
(3), 267
–275
(2012). http://dx.doi.org/10.1016/j.mvr.2012.02.011 MIVRA6 0026-2862 Google Scholar
P. AmornphimolthamA. MasedunskasR. Weigert,
“Intravital microscopy as a tool to study drug delivery in preclinical studies,”
Advanced Drug Delivery Reviews, 63
(1–2), 119
–128
(2011). http://dx.doi.org/10.1016/j.addr.2010.09.009 ADDREP 0169-409X Google Scholar
D. S. Gareauet al.,
“Noninvasive imaging of melanoma with reflectance mode confocal scanning laser microscopy in a murine model,”
J. Investig. Dermatol., 127
(9), 2184
–2190
(2007). http://dx.doi.org/10.1038/sj.jid.5700829 0022-202X Google Scholar
S. Lange-Asschenfeldtet al.,
“Applicability of confocal laser scanning microscopy for evaluation and monitoring of cutaneous wound healing,”
J. Biomed. Opt., 17
(7), 076016
(2012). http://dx.doi.org/10.1117/1.JBO.17.7.076016 JBOPFO 1083-3668 Google Scholar
P. J. CaspersG. W. LucassenG. J. Puppels,
“Combined in vivo confocal Raman spectroscopy and confocal microscopy of human skin,”
Biophys J., 85
(1), 572
–580
(2003). http://dx.doi.org/10.1016/S0006-3495(03)74501-9 0006-3495 Google Scholar
|