|
|
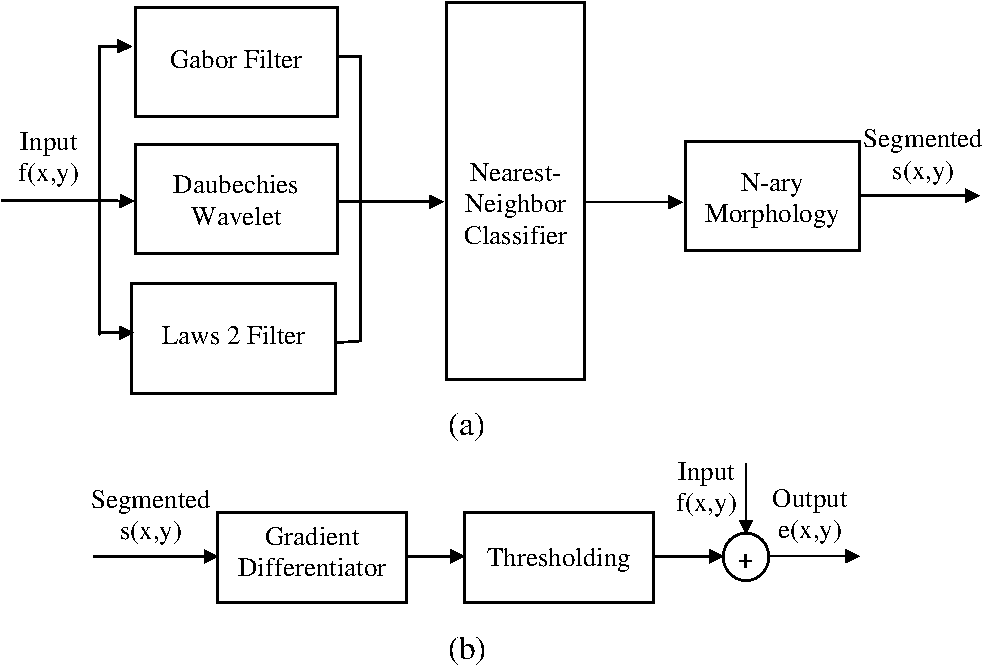
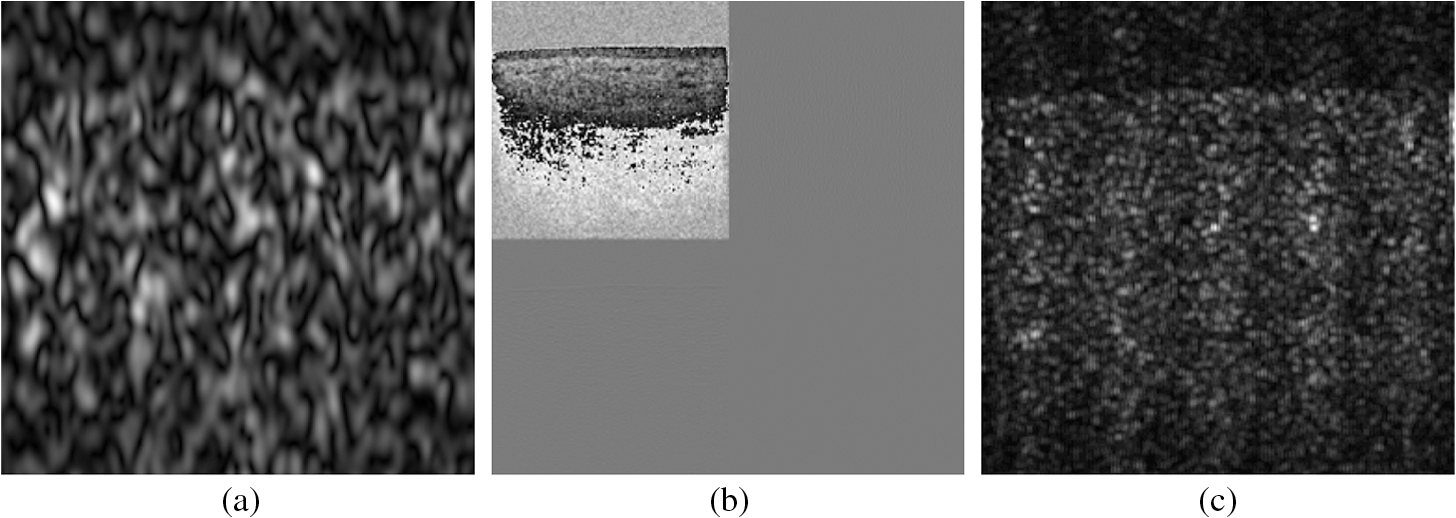
1.IntroductionRecent studies suggest that noninvasive monitoring of epithelial morphology and thickness measurement could be a reliable biomarker for predicting susceptibility to genital infections, diagnosing precancerous and cancerous changes, and assessing tissue damage after topical drug use.1–5 To attempt to fight the HIV epidemic, microbicides, vaginal products for prevention of acquisition of the infection, have been developed. However, some of these products have been toxic to the genital tract, and more specifically, the cervicovaginal tract, and have increased or failed to prevent transmission of HIV.6–9 Colposcopic examination and histology of tissue biopsy have been primarily used to assess the effects of microbicides on the integrity of the cervicovaginal epithelium. Unfortunately, colposcopy is insensitive to detect minute microbicide-induced changes in the epithelium, and biopsy is invasive;6,7 in preclinical and clinical safety studies, these methods failed to identify microbicides that cause toxicity to the cervicovaginal epithelium and consequently increase risk of infection. OCT is a high-resolution optical imaging technique10 recently used to perform noninvasive high-resolution cross-sectional in vivo imaging of the cervix and vaginal tissue in preclinical and clinical studies designed to assess microbicide toxicity.2,3,5 OCT imaging of the cervicovaginal epithelium provides depth-resolved information on morphological features and thickness of the epithelial layer. Until now, microbicide-induced changes in the morphology and thickness of vaginal epithelium as detected by OCT imaging have been delineated manually, a time-intensive process that often requires postprocessing of OCT images. An automatic segmentation algorithm is needed to more efficiently differentiate the epithelial layer from the underlying tissue structure for subsequent automatic quantitative measurement of the degree of epithelium injury. Various segmentation approaches have been used for cervicovaginal image analysis.11–14 Ji et al.11 applied a texture-based technique to characterize cervical lesions in colposcopic images, basing their method on statistical analysis. Luck et al.12 performed a segmentation method on confocal images of nuclei to assist in cervical precancer detection. Their algorithm applied three processing modules in series. First, they employed anisotropic diffusion for edge preservation. Then, using Gaussian Markov random field, they modeled the nuclei. Finally, a Bayesian classifier was used to reduce the number of nonnuclei. Greenspan et al.13 and Lotenberg et al.14 developed a multistage automated system for segmenting images obtained from the uterine cervix. Their approach was based on geometrical curvature characteristics of cervical images, incorporating prior shape information to improve the detection of the boundary of lesions. However, all of the image segmentation techniques that have been developed until now are designed to classify colposcopy or confocal images of cervicovaginal tissue. Applications of OCT imaging technique for visualization of morphological features of ocular tissue have been well established in the past two decades. More recently, various approaches have been used for automated segmentation of well-defined retinal layers visualized with the aid of OCT imaging.15–24 However, these techniques cannot be utilized for segmentation of OCT images of vaginal tissue because of variations in cervicovaginal epithelial thickness within images and lower contrast between the epithelial layer and stroma. Beyond the use of segmentation techniques for analyzing OCT images of retina, Chitchian et al.25 proposed the development of a more versatile segmentation approach to differentiate the cavernous nerves from the prostate gland for nerve-sparing prostate cancer surgery. Despite the success that has been reported for use of various segmentation methods for analysis of colposcopic images of vaginal tissue as well as OCT retinal images, automatic detection of in-depth minute morphological changes in vaginal epithelial layer and its thickness measurement require a different segmentation approach. In this study, we apply a feature-based segmentation algorithm using a nearest-neighbor classifier to monitor minute microbicide-induced changes in the cervicovaginal epithelium. 2.MethodsIn vivo OCT images of the vagina in a sheep model were obtained using a clinical endoscopic OCT system (Imalux, Cleveland, OH). Images were obtained after vaginal lavage at baseline (before treatment) and 24 h after treatment with 5 mL intravaginal 2% nonoxynol-9 (N9, Gynol II, Johnson & Johnson Professional Products) or hydroxyethylcellulose placebo (HEC, ReProtect, Baltimore, MD).3 N9 is an over-the-counter spermicide that has been shown to disrupt and thin the epithelium and increase suspectibility to HIV;2,5 therefore, we used this treatment, known to cause epithelial toxicity, to test the performance of our segmentation algorithm. Twenty representative OCT images from three N9-treated sheep and one placebo-treated sheep were selected for image processing. Vaginal biopsies were obtained at the site of OCT imaging to confirm findings. The biopsies were fixed in formalin and stained with hematoxylin and eosin. Student -test was used to compare epithelial thickness measurements, and alpha of 0.05 was used for significance. 2.1.Segmentation SystemA block diagram of the segmentation system is provided in Fig. 1(a). This is the system introduced by Chitchian and colleagues25,26 to differentiate the cavernous nerves from the prostate gland. The following is a brief overview of the system. The input image is first processed to form three feature images. The image is then segmented into epithelial layer, stroma, and background classes using a -nearest-neighbors (-NN) classifier and the three feature images. Finally, -ary morphology is used for postprocessing. Another postprocessing module is added to the segmentation system to differentiate the epithelial layer using segmentation results [Fig. 1(b)]. The brief descriptions of the feature images, classifier, and postprocessing modules are provided below. 2.1.1.Gabor filterThe first feature image is generated by a Gabor filter with impulse response ,27 whereThe Gabor function is essentially a bandpass filter centered about frequency with bandwidth determined by . The Gabor feature center frequency of (0.2,0.2) cycles/pixel is applied with standard deviations of 3 and 6 in the and directions, respectively, based on experimental observation of minimum segmentation error and geometrical shape of epithelial layer. The Gabor filter parameters are varied, so the Gabor filter efficacy can be directly observed in the filtered images. 2.1.2.Daubechies wavelet transformThe second feature is generated by the eight-tap Daubechies orthonormal wavelet transform to reduce the effect of noise. The discrete wavelet transform (DWT) converts an image to its wavelet representation.28 In a one-level DWT, the image is split into an approximation part and detail parts , , and for horizontal, vertical, and diagonal orientations, respectively. The approximation part is chosen as the second feature. 2.1.3.Laws filterThe third feature is generated by the Laws feature extraction method.29 Laws mask is convolved with the image to accentuate its microstructure. Then, standard deviation computation is performed after the Laws mask filtering to complete Laws feature extraction. The feature images, Gabor filter; Daubechies wavelet; and Laws filter, are shown in Fig. 2(a) through 2(c). 2.1.4.-nearest-neighbors classifier and -ary morphology-NN is a method for classifying objects based on the closest training samples in the feature space. The algorithm is implemented by training, parameter selection, and classification steps. A different image is used for training. For parameter selection, larger values of typically reduce the effect of noise on the classification, but make boundaries between classes less distinct. A parameter value of is empirically chosen ( varied from 4 to 12) for the present implementation of the -NN algorithm. Finally, the -ary morphological postprocessing method is followed for eliminating small misclassified regions.25 2.1.5.PostprocessingFigure 1(b) shows the postprocessing module. A form of spatial first-order differentiation is performed on the segmented image to separate the epithelial layer.30 Then, a border is drawn defining the epithelium using thresholding. By adding the result to the input image, the output is concluded. 3.ResultsFigure 3(a), 3(d), and 3(g) shows representative OCT images of normal vaginal mucosa with stratified squamous epithelium and underlying stroma consisting of dense connective tissue that supports cells and a network of vessels and nerves. The first step of the algorithm provides the segmented images, in Fig. 1(a), which are shown in Fig. 3(b), 3(e), and 3(h). Finally, applying the postprocessing algorithm of Fig. 1(b) resulted in the output images in Fig. 3(c), 3(f), and 3(i), with the epithelial layer clearly delineated by the automated algorithm. Note that in Fig. 3(f) and 3(i), there is a layer of fluid at the surface which the algorithm correctly excludes as being part of the epithelium. Fig. 3Representative OCT images of the sheep vagina. (a), (d), (g), Original. (b), (e), (h), Segmented. (c), (f), (i), Output images. 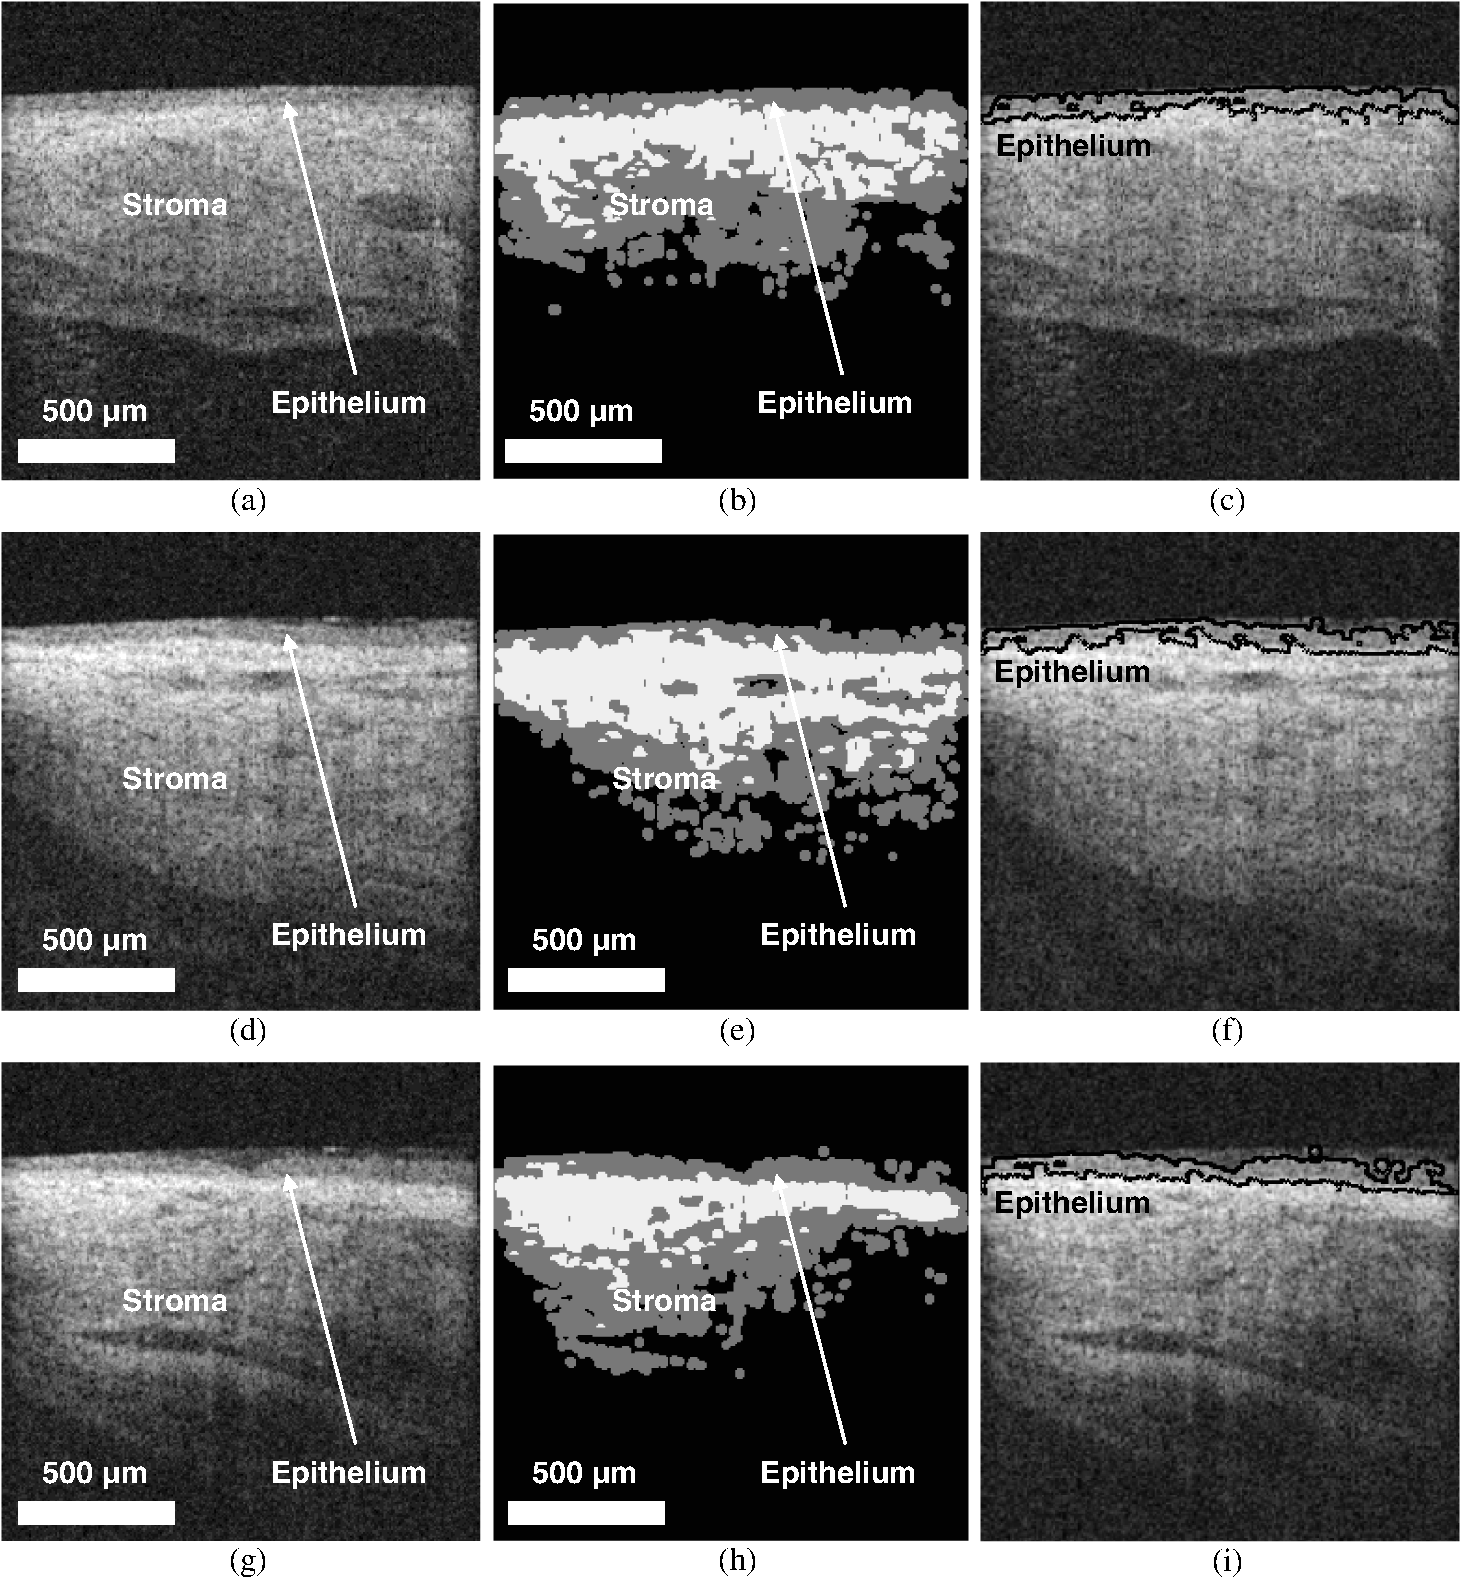 OCT images of damaged tissue at 24 h after a single dose treatment of 2% N9 are shown in Fig. 4(a), 4(d), and 4(g). Histology confirmed thinning and loss of the epithelium after treatment with N9, as seen in Fig. 5. Figure 4(b), 4(e), and 4(h) and 4(c), 4(f), and 4(i) show the segmented and the output results of Fig. 4(a), 4(d), and 4(g), respectively. Thinned epithelium is noted and outlined by the automated algorithm. Fig. 4Representative OCT images of the sheep vagina after treatment with 2% N9. (a), (d), (g), Original. (b), (e), (h), Segmented. (c), (f), (i), Output images. 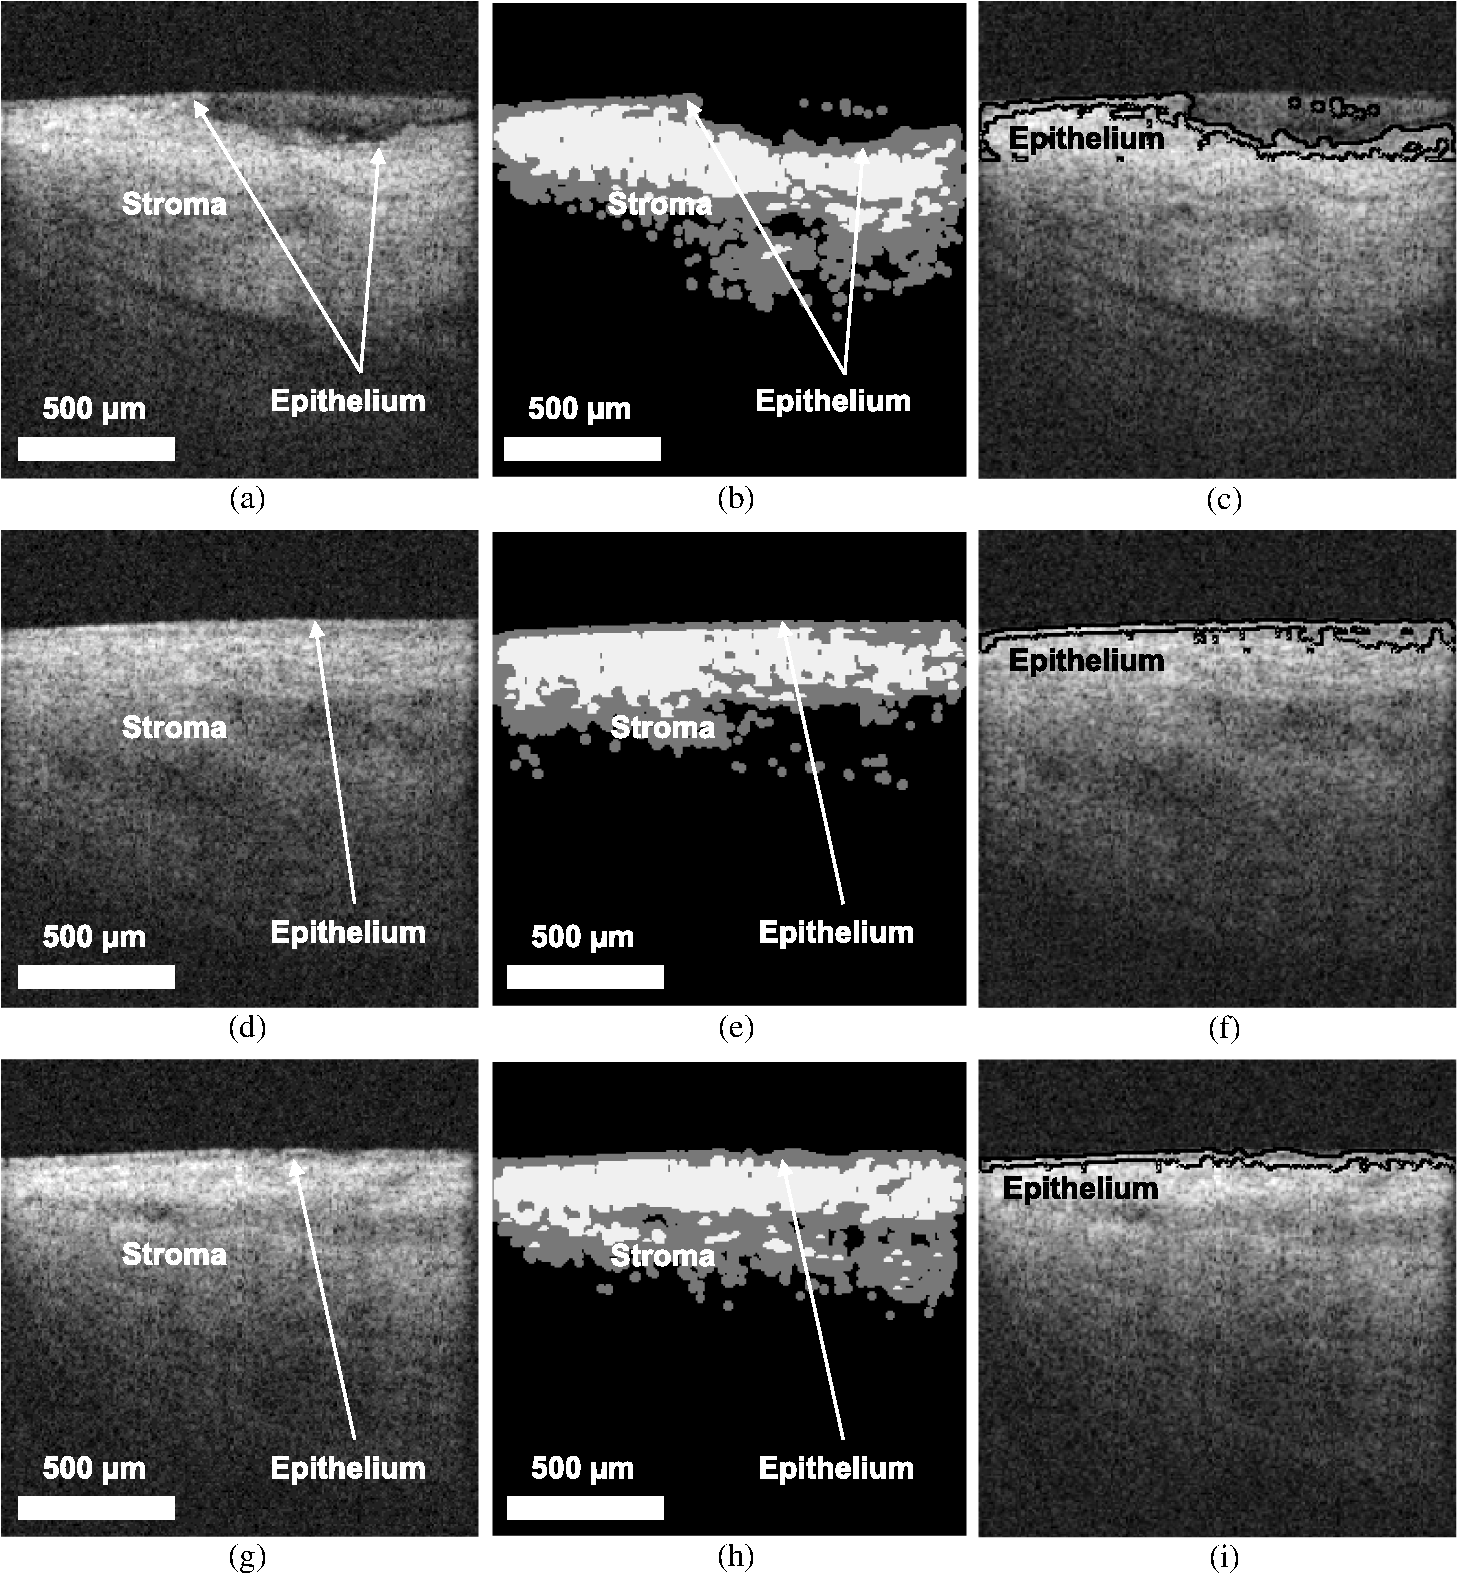 Fig. 5Representative histologic and OCT images of the sheep cervicovaginal epithelium after treatment with placebo (a) (b) or 2% N9 (c) (d).  Comparing Fig. 3, which includes images at baseline, and Fig. 4, which includes images obtained after treatment with 2% N9, reveals that after treatment with 2% N9, the epithelium was thinned and disrupted, as detected by the segmentation algorithm. This is in agreement with the previous results in which histology and manual measurements in OCT showed thinned epithelium.3 Figure 5(a) and 5(b) shows representative histology and OCT images obtained at the same site 24 h after treatment with placebo. The images show intact epithelium. Figure 5(c) and 5(d) shows representative histology and OCT images obtained at the same site 24 h after treatment with N9. Disrupted, thinned epithelium is noted in these images. Before treatment, the epithelial thickness of the OCT images was and in the placebo and N9 groups, respectively. After treatment, the epithelial thickness was unchanged in the placebo group, measuring (), and thinned in the N9 group, measuring (). Figure 4(c) shows round structures above the epithelium which the algorithm did not exclude, and we included them in measuring the error rate. The overall error rate for the segmentation was , showing that our technique is robust based on an industry standard of error . 4.DiscussionNoninvasive high-resolution imaging could provide direct assessment of epithelial structure for evaluation of the effect of candidate microbicides on the cervicovaginal mucosa. Our group has recently demonstrated the use of OCT for assessing the effects of BZK and N9 on the integrity of epithelial tissue of cervicovaginal tract of macaques, sheep, and humans.2,3,5 In all of these studies, we have demonstrated that monitoring and manual quantification of microbicide-induced changes in epithelial integrity could be used as a biomarker for the assessment of microbicide toxicity. In this study, an automatic segmentation algorithm was developed for the identification of the epithelium in OCT B-scans of the cervicovaginal tract. The benefit of such an algorithm is to facilitate the process of defining the epithelium in cases where manual delineation of the borders is time consuming and subjective. One application for such a tool includes identification of the epithelium following chemical perturbation by a topical microbicide. In this case, epithelial thinning and disruption following treatment with a chemical that damages epithelial tissue can be correlated to susceptibility to infection by a sexually transmitted infection (STI).4 The developed algorithm was successful in defining the epithelium as evidenced by the small error rate when comparing the algorithm with manual detection of epithelium. The algorithm was successful even in the presence of confounding factors such as fluid or mucous on the surface of epithelium as seen in Fig. 3(f) and 3(i). In these cases, the algorithm excluded these low-reflectivity areas that were not part of the true epithelium. In one case shown, segmentation resulted in small areas above the epithelium to be defined [Fig. 4(c)]. These, however, can be excluded as being part of the epithelium based on size and location. The presence of these areas with intensity similar to epithelium suggests that they are epithelial debris and tissue that has been disrupted and is present in the mucus and fluid layer covering the epithelial surface. The proposed algorithm is the first step toward developing an automated technique for the measurement of epithelial thickness. 5.ConclusionIn this work, we developed an algorithm to automatically delineate the vaginal epithelial layer. This algorithm for morphological segmentation of the epithelial layer may prove useful for automated monitoring and detection of minute changes in the cervicovaginal epithelium after treatment with vaginal products using high-resolution OCT imaging. AcknowledgmentsThis research was supported in part by the National Institutes of Health, National Institute of Allergy and Infectious Diseases, NIAID (R21AI07606202/R33AI076062) and National Cancer Institute, NCI (R01CA127429). ReferencesP. Escobaret al.,
“Optical coherence tomography as a diagnostic aid to visual inspection and colposcopy for preinvasive and invasive cancer of the uterine cervix,”
Int. J. Gynecol. Cancer, 16
(5), 1815
–1822
(2006). IJGCEN Google Scholar
K. Vincentet al.,
“Application of optical coherence tomography for monitoring changes in cervicovaginal epithelial morphology in macaques: potential for assessment of microbicide safety,”
Sex. Transm. Dis., 35
(3), 269
–275
(2008). http://dx.doi.org/10.1097/OLQ.0b013e31815abad8 STRDDM 0148-5717 Google Scholar
K. Vincentet al.,
“High resolution imaging of epithelial injury in the sheep cervicovaginal tract: a promising model for testing safety of candidate microbicides,”
Sex. Transm. Dis., 36
(5), 312
–318
(2009). http://dx.doi.org/10.1097/OLQ.0b013e31819496e4 STRDDM 0148-5717 Google Scholar
K. Vincentet al.,
“Benzalkonium chloride causes colposcopic changes and increased susceptibility to genital herpes infection in mice,”
Sex. Transm. Dis., 37
(9), 579
–584
(2010). http://dx.doi.org/10.1097/OLQ.0b013e3181dac410 STRDDM 0148-5717 Google Scholar
K. Vincentet al.,
“Optical coherence tomography compared with colposcopy for assessment of vaginal epithelial damage: a randomized controlled trial,”
Obstet. Gynecol., 118
(6), 1354
–1361
(2011). http://dx.doi.org/10.1097/AOG.0b013e318238f563 OBGNAS 0029-7844 Google Scholar
L. Van Dammeet al.,
“Safety of multiple daily applications of COL-1492, a nonoxynol-9 vaginal gel, among female sex workers,”
AIDS, 14
(1), 85
–88
(2000). http://dx.doi.org/10.1097/00002030-200001070-00010 AIDSET 0269-9370 Google Scholar
Technical Consultation on Nonoxynol-9,
(2001). Google Scholar
L. Van Dammeet al.,
“Lack of effectiveness of cellulose sulfate gel for the prevention of vaginal HIV transmission,”
N. Engl. J. Med., 359
(5), 463
–472
(2008). http://dx.doi.org/10.1056/NEJMoa0707957 NEJMAG 0028-4793 Google Scholar
P. Feldblumet al.,
“SAVVY vaginal gel (C31G) for prevention of HIV infection: a randomized controlled trial in Nigeria,”
PLoS One, 3
(1), e1474
(2008). http://dx.doi.org/10.1371/journal.pone.0001474 1932-6203 Google Scholar
D. Huanget al.,
“Optical coherence tomography,”
Science, 254
(5035), 1178
–1181
(1991). http://dx.doi.org/10.1126/science.1957169 SCIEAS 0036-8075 Google Scholar
Q. JiJ. EngelE. Craine,
“Texture analysis for classification of cervix lesions,”
IEEE Trans. Med. Imaging, 19
(11), 1144
–1149
(2000). http://dx.doi.org/10.1109/42.896790 ITMID4 0278-0062 Google Scholar
B. Lucket al.,
“An image model and segmentation algorithm for reflectance confocal images of in vivo cervical tissue,”
IEEE Trans. Image Process., 14
(9), 1265
–1276
(2005). http://dx.doi.org/10.1109/TIP.2005.852460 IIPRE4 1057-7149 Google Scholar
H. Greenspanet al.,
“Automatic detection of anatomical landmarks in uterine cervix images,”
IEEE Trans. Med. Imaging, 28
(3), 454
–468
(2009). http://dx.doi.org/10.1109/TMI.2008.2007823 ITMID4 0278-0062 Google Scholar
S. LotenbergS. GordonH. Greenspan,
“Shape priors for segmentation of the cervix region within uterine cervix images,”
J. Digit. Imaging, 22
(3), 286
–296
(2009). http://dx.doi.org/10.1007/s10278-008-9134-z JDIMEW Google Scholar
D. FernandezH. SalinasC. Puliafito,
“Automated detection of retinal layer structures on optical coherence tomography images,”
Opt. Express, 13
(25), 10200
–10216
(2005). http://dx.doi.org/10.1364/OPEX.13.010200 OPEXFF 1094-4087 Google Scholar
M. Szkulmowskiet al.,
“Analysis of posterior retinal layers in spectral optical coherence tomography images of the normal retina and retinal pathologies,”
J. Biomed. Opt., 12
(4), 041207
(2007). http://dx.doi.org/10.1117/1.2771569 JBOPFO 1083-3668 Google Scholar
M. Haekeret al.,
“Automated segmentation of intraretinal layers from macular optical coherence tomography images,”
Proc. SPIE, 6512 6512141
(2007). http://dx.doi.org/10.1117/12.710231 PSISDG 0277-786X Google Scholar
C. Ahlerset al.,
“Automatic segmentation in three-dimensional analysis of fibrovascular pigmentepithelial detachment using high-definition optical coherence tomography,”
Br. J. Ophthalmol., 92
(2), 197
–203
(2008). http://dx.doi.org/10.1136/bjo.2007.120956 BJOPAL 0007-1161 Google Scholar
M. Garvinet al.,
“Intraretinal layer segmentation of macular optical coherence tomography images using optimal 3-D graph search,”
IEEE Trans. Med. Imaging, 27
(10), 1495
–1505
(2008). http://dx.doi.org/10.1109/TMI.2008.923966 ITMID4 0278-0062 Google Scholar
T. Fabritiuset al.,
“Automated segmentation of the macula by optical coherence tomography,”
Opt. Express, 17
(18), 15659
–15669
(2009). http://dx.doi.org/10.1364/OE.17.015659 OPEXFF 1094-4087 Google Scholar
A. Mishraet al.,
“Intra-retinal layer segmentation in optical coherence tomography images,”
Opt. Express, 17
(26), 23719
–23728
(2009). http://dx.doi.org/10.1364/OE.17.023719 OPEXFF 1094-4087 Google Scholar
G. Quellecet al.,
“Three-dimensional analysis of retinal layer texture: identification of fluid-filled regions in SD-OCT of the macula,”
IEEE Trans. Med. Imaging, 29
(6), 1321
–1330
(2010). http://dx.doi.org/10.1109/TMI.2010.2047023 ITMID4 0278-0062 Google Scholar
S. Chiuet al.,
“Automatic segmentation of seven retinal layers in SDOCT images congruent with expert manual segmentation,”
Opt. Express, 18
(18), 19413
–19428
(2010). http://dx.doi.org/10.1364/OE.18.019413 OPEXFF 1094-4087 Google Scholar
M. Mayeret al.,
“Retinal nerve fiber layer segmentation on FD-OCT scans of normal subjects and glaucoma patients,”
Biomed. Opt. Express, 1
(5), 1358
–1383
(2010). http://dx.doi.org/10.1364/BOE.1.001358 BOEICL 2156-7085 Google Scholar
S. ChitchianT. WeldonN. Fried,
“Segmentation of optical coherence tomography images for differentiation of the cavernous nerves from the prostate gland,”
J. Biomed. Opt., 14
(4), 0440331
(2009). http://dx.doi.org/10.1117/1.3210767 JBOPFO 1083-3668 Google Scholar
S. Chitchian,
“Optical coherence tomography of the prostate nerves,”
UNC Charlotte,
(2010). Google Scholar
T. WeldonW. HigginsD. Dunn,
“Efficient Gabor filter design for texture segmentation,”
Pattern Recogn., 29
(12), 2005
–2015
(1996). http://dx.doi.org/10.1016/S0031-3203(96)00047-7 PTNRA8 0031-3203 Google Scholar
S. ChitchianM. FiddyN. Fried,
“Denoising during optical coherence tomography of the prostate nerves via wavelet shrinkage using dual-tree complex wavelet transform,”
J. Biomed. Opt., 14
(1), 0140311
(2009). http://dx.doi.org/10.1117/1.3081543 JBOPFO 1083-3668 Google Scholar
W. Pratt, Digital Image Processing, Wiley, Hoboken, NJ
(2007). Google Scholar
S. Chitchianet al.,
“Combined image-processing algorithms for improved optical coherence tomography of prostate nerves,”
J. Biomed. Opt., 15
(4), 0460141
(2010). http://dx.doi.org/10.1117/1.3481144 JBOPFO 1083-3668 Google Scholar
|