
|
|
1.IntroductionThe skin is the largest organ of the human body. Its key roles are to cover the internal organs, serve as a barrier to external pathogens and elements, and control homeostasis through thermoregulation and prevention of water loss. Because it is in constant contact with physical, chemical, and biological factors, the skin is susceptible to the development of various benign and malignant tumors. Nonmelanoma skin cancer (NMSC), which includes basal cell carcinoma and squamous cell carcinoma, comprise the most prevalent human cancers, with numbers exceeding that of all other cancers combined.1 Also referred to as keratinocyte carcinomas, they derive from keratinocytes in the epidermal layer of the skin. This superficial nature facilitates their detection, treatment, and observation in response to treatment.2 Recent reports estimate that the number of skin cancers in the United States has reached epidemic proportions, with an annual incidence as high as 3,000,000, and this figure is increasing worldwide.3 Even though many cutaneous diagnoses can be assessed by physical examination by a dermatologist, skin biopsy remains the gold standard for confirmation of clinical findings. However, biopsy of the skin is time-consuming, costly, and has inherent risks such as bleeding, infection, and scarring. Hence, the demand for noninvasive imaging with cellular resolution is increasing for diagnosis of diseases, monitoring of skin changes over time, and observing responses to various therapeutic interventions. To date, several noninvasive techniques using both optical and nonoptical sources have been reported but have yet proved to replace the diagnostic role of standard histologic methods. Among nonoptical approaches, high-frequency ultrasound and microscopic magnetic resonance imaging offer limited resolution but satisfactory imaging depth.4,5 The optical properties of skin such as scattering and absorption are nonhomogeneous as a result of different refractive indices and absorption coefficients of skin layers and microstructures. These heterogeneous optical properties can be used to create contrast in imaging of the skin. Among the noninvasive and optical imaging methods, dermoscopy is the only modality used routinely in the clinical setting given its ease of use and cost-effectiveness at differentiating skin tumors with spectral reflectivity. However, dermoscopy has low resolution and does not support depth resolution. Reflectance confocal scanning microscopy (RCSM) and label-free two-photon fluorescence microscopy (TPFM) have provided cellular-level resolution and depth sectioning. They have been used widely in clinical investigations to identify NMSC, however, to an imaging depth that is most often 200 to 300 μm. Depth-sectioning capability using a confocal detection mechanism degrades quickly as a result of scattering of light as it passes through skin, resulting in out-of-focus photons that are transmitted through the pinhole onto the detector. This rapidly decreasing contrast as a function of depth limits the usable depth and, hence, utility of imaging. In addition, axial resolution is intrinsically limited in confocal microscopy and thus requires an extremely high numerical aperture (NA) that is sensitive to optical aberrations as the light is focused deeper into tissue. On the other hand, the high NA significantly limits the depth of focus. For example, Rajadhyaksha et al. reported the optimum range of parameters such as wavelength, power, magnification and NA of the objective lens, pinhole diameter, and immersion medium in RCSM to achieve the maximum depth, field of view, and resolution. As a result, the system achieved in vivo confocal images of human skin cells up to a 350-μm depth with a maximum field of view of 800 μm. However, imaging deeper than 350 μm was fundamentally limited by multiple scattering from planes away from the region of focus. In addition, the high NA optics of 0.7 were needed to achieve 5-μm axial resolution experimentally measured at 1064 nm while the NA was enough to obtain 1-μm lateral resolution.6 In label-free TPFM, the imaging depth is limited by intrinsically weak autofluorescence signals whose intensity is further reduced by absorption as a function of depth. Masters et al. detected the autofluorescence of human skin with depths down to 200 μm using a two-photon femtosecond laser-scanning microscope.7 Optical coherence tomography (OCT) is a technology applicable to noninvasive medical imaging that allows high-resolution visualization of microstructural morphology of tissues.8 Many investigations using OCT have been performed to image subsurface layers and structures of skin including the epidermis, dermal-epidermal junction, dermis, hair follicles, blood vessels, and sweat ducts.9–14 A number of clinical studies have suggested that OCT might be useful for noninvasive diagnosis of skin disorders such as inflammatory and bullous skin diseases and to assess wound healing.15,16 Several reports to date have examined the use of OCT imaging of NMSC. Previous studies demonstrate OCT images of BCC, SCC, and actinic keratoses (AK) and have correlated these findings with standard histology.17–25 The ability of OCT to differentiate NMSC lesions from normal skin has also been assessed in the clinical setting using observer-blinded evaluation by dermatologists and pathologists.26 To date, however, most of the clinical investigations in skin disease using OCT have used two-dimensional (2-D) images or relatively low resolution. Initial reports using OCT for skin imaging revealed significantly improved resolution over high-frequency ultrasound imaging, as well as better imaging depth and field of view than with RCSM or TPFM. Nonetheless, conventional OCT does not provide histology level resolution compared with RCSM and TPFM. To overcome this weakness, OCT can use a high NA objective similar to confocal microscopy to achieve cellular lateral resolution. Combined with phase modulation in time domain in vivo, en face cellular imaging is possible at specific depths, which is called optical coherence microscopy (OCM).27 However, this accomplishment does not enable in vivo volumetric imaging ranging from the surface of the skin through the dermis given the limited depth of focus and acquisition speed.28 Fourier-domain OCM, which is much faster than time-domain OCM, does not enable cellular volumetric imaging in sufficient depth of skin without fast refocusing and fusing. Full-field OCT is an approach to achieve cellular-level lateral resolution in vivo volumetric imaging. However, full-field OCT has lower sensitivity compared with conventional FD-OCT. As such, full-field OCT is limited in its application to weakly scattering media such as the Xenopus tadpole or the cornea, or ex vivo imaging.29 To achieve additional contrast of specific cutaneous structures, several functional extensions to conventional OCT has been applied: phase-resolved Doppler OCT to measure blood flow.30,31 polarization-sensitive OCT to visualize birefringence properties of skin,32 particularly connective tissue, and elastographic OCT to image the local variations of stiffness.33 The combination of multiple imaging modalities can also be considered to achieve complimentary contrast, which may be helpful to improve the sensitivity and specificity of skin tumor diagnosis. The combination of OCT and TPFM is capable of providing biochemical specificity in addition to morphologic structure of skin.34 Photoacoustic tomography (PAT) detects acoustic signals generated by optical absorption of nanosecond laser pulses within tissue with a spatial resolution in the order of tens of micrometers and a penetration depth of several millimeters. PAT is efficient at visualizing vasculature with hemoglobin, which is an optical absorber in skin. Recently OCT combined with PAT shows high-resolution structure together with cutaneous vasculature of in-vivo human skin.35 Regardless of the type of extension or multimodality, the improvement in capability of OCT itself will enhance the overall performance of the combined system. In OCT, axial and lateral resolution required for volumetric reconstruction are determined by the source coherence length and the NA of the objective lens, respectively. Axial resolution can be improved by use of a broadband light source such as that of an ultrashort pulse laser or a supercontinuum source. On the other hand, the improvement in lateral resolution is not straightforward given that there is a trade-off between lateral resolution and depth of focus. Various methods have been investigated to achieve more depth of focus than the confocal parameter of the focusing Gaussian beam by the objective optics. Among current methods, Gabor domain optical coherence microscopy (GD-OCM) has been reported as a solution to achieve histology grade volumetric images for in vivo clinical applications.36 GD-OCM utilizes combined coherence and confocal gating to achieve high-contrast imaging and axial resolution (i.e., 2 μm) with relatively low-NA (i.e., 0.2) and weak confocal sectioning while still maintaining sufficient lateral resolution (i.e., 2 μm) to image cells within the depth of focus of the lens around the focus point of the optics. The dynamic focusing allows us to acquire multiple sections in depth at invariant lateral resolution. The microscope objective incorporated in the system has large field of view (i.e., 2 mm) maintaining 2-μm lateral resolution. GD-OCM also has the superior ability to reject out-of-focus light with a tight coherence gate and can as a consequence go well beyond 500 μm in human skin tissue.37,38 In this paper, we apply volumetric GD-OCM at cellular resolution to the morphologic investigation of ex vivo NMSC. We also show cellular resolution 3-D images of different anatomic locations of in vivo normal skin such as a nailfold, forearm, and fingertip. To our knowledge, this report is the first to obtain cellular OCM images of 3-D features in normal and abnormal skin (i.e., BCC and SCC). 2.Methods2.1.Skin SamplesFor this study, one biopsy-proven BCC from the nose and two biopsy-proven SCCs from the ear and cheek were obtained as discarded debulking specimens from Mohs micrographic surgical excisions. Three normal skin samples from equivalent locations (i.e., nose, ear, and cheek) were used as comparisons for the three NMSCs. Patient information was unknown with the exception of gender and age. The excised samples were immediately placed on ice and transported to the imaging laboratory at the University of Rochester within 3 h of excision. All imaging was conducted by applying the objective lens to the skin after application of ultrasound gel for index matching. For in vivo imaging, healthy skin located in the nailfold, fingertip, and forearm of two volunteers were imaged. Use of discarded skin samples was approved by the University of Rochester Research Subjects Review Board. 2.2.Imaging ParametersThe imaging system with micron-class resolution of 2 μm axially and laterally in skin tissue consists of a Titanium:Sapphire femtosecond laser centered at 800 nm with 120 nm full width half maximum (FWHM) (Integral, Femtolasers, Inc.), a custom liquid-lens-based 3-D scanning microscope,38 a broadband custom-made fiber coupler (NSF-DARPA/PTAP), a custom dispersion compensator,39 and a custom spectrometer with a high-speed CMOS line camera (spl8192-70 km, Basler Inc).40 To achieve the axial resolution of 2 μm using a 1050 or 1300 nm source, a bandwidth of 207 nm FWHM or 316 nm FWHM would be required, respectively. The extended bandwidth would limit the selection of an appropriate source, spectrometer, and optics. In addition, it would be more difficult to compensate the overall dispersion to secure the resolution in a fiber-based system. To achieve 2-μm lateral resolution, a relatively lower NA of the objective is needed with a wavelength of 800 nm compared with the wavelengths 1050 and 1300 nm. At constant lateral resolution, the depth of focus decreases as the inverse of the wavelength. Therefore, using a longer wavelength also gives the challenge of needing more zones in depth, which will limit the overall imaging speed. Although OCT at 1050 or 1300 nm gets deeper imaging compared with OCT at 800 nm, the latter can obtain relatively high speed imaging at 2-μm resolution over 500 μm deep, which is sufficient to image the epidermis ( for facial skin) where skin cancer generally develops. Spectra were acquired with an exposure time of 48 μs and a readout speed of . We acquired six volumes from the same portion of a skin tissue with a sampling interval of 1 μm for 10 min, which corresponds to a total of Ascans spectra. The six volumes were taken relative to a shifted focal plane with 100 μm separation. Using the 100 μm separation between focal planes, over a depth of 60 μm there is 2-μm lateral resolution, and the remaining imaging depth (i.e., 40 μm) supports 3-μm lateral resolution measured as a minimum of 20% contrast criterion.41 The lateral scale of images was determined with the scanned length by the two galvanometer based mirrors. The optical depths () of the structure were first measured with optical path differences between the reference arm and the structures in the sample and the optical depths were then rescaled to the physical depths of the images by dividing them with the average refractive index 1.4 of epidermis and dermis at 800 nm.42 The six volume images were reconstructed in post-processing into one volume using the Gabor-based fusion technique.37 All acquisition and post-processing including interpolation, fast Fourier transform, and fusion were done using Labview software that was run on a PC equipped with a 64-bit processor and Windows 7 operating system to secure sufficient computer memory. 3.Results3.1.In Vivo 3-D High-Resolution Images of Normal SkinThree orthogonal views in a 3-D volume of in vivo normal nailfold skin acquired using GD-OCM are shown in Fig. 1(a). The imaged area of the in vivo nailfold corresponds with a red-line box in the schematic located in the right-bottom corner of Fig. 1(a). The cross-sectional GD-OCM images of the plane and the plane [i.e., left-up and right-up images in Fig. 1(a)] clearly delineate the features of papillary capillary loops as well as the cornified layer, germinal layer of the epidermis, and subpapillary venules. The en face image of plane [i.e., left-bottom image in Fig. 1(a)] shows dead keratinocytes in the cornified layer at the corresponding depth indicated in the cross-sectional image in Fig. 1(a). The en face image Fig. 1(b) at the depth of viable epidermis shows viable keratinocyte aggregates. Capillary loops extending vertically in the dermis are observed as small black spots in Fig. 1(c). The black streaks in Fig. 1(d) represent the subpapillary venules in the dermis. A volume rendered movie of in-vivo 3-D normal nailfold skin with a volume of () is shown in Fig. 1(e). Fig. 1(a) Three orthogonal views in a 3-D volume of in-vivo normal nail-fold skin (left-up: cross-section in an plane of , right-up: cross-section in a plane of 1 mm by 0.6 mm, left-bottom: en face image in an plane of , and right-bottom: schematic of nail-fold with a red-line box that indicates the imaged area); (b), (c), and (d) are the en face images at the corresponding depth indicated with the red arrows in the left-up image of Fig. 1(a), respectively; (e) a volume rendered 3-D movie of the nail-fold imaged (Video 1, MOV, 803KB) [URL: http://dx.doi.org/10.1117/1.JBO.17.12.XXXXXX.1].  Figure 2(a) shows three orthogonal views in a 3-D volume of in vivo normal fingertip skin. In the cross-sectional GD-OCM images of plane and plane [i.e., left-up and right-up images in Fig. 2(a)], the stratum corneum of the fingertip is clearly visible with the border between the viable epidermis and stratum corneum. The en face image [i.e., left-bottom image in Fig. 2(a)] shows dead keratinocytes together with some bright spots of sweat ducts in the stratum corneum on the ridge of the fingerprint at the corresponding depth indicated in the cross-sectional image in Fig. 2(a). The en face image Fig. 2(b) at the depth of viable epidermis shows viable keratinocyte aggregates on the ridge of the fringe depicted as brighter areas. The fringe comes from the undulations formed by dermal papilla. In Fig. 2(c), two white streaks correspond to the viable epidermis where keratinocytes are seen. The blood vessels appear as signal-free round features. A volume rendered movie of in-vivo 3-D normal fingertip skin with a volume of () is shown in Fig. 2(d). Figure 2(e) shows a snap shot of a 3-D volume rendered with a max intensity renderer. The spiral sweat ducts were clearly visualized by their strong scattering. Fig. 2(a) Three orthogonal views in a 3-D volume of in vivo normal fingertip skin (left-up: cross-section in an plane of 2 mm by 0.6 mm, right-up: cross-section in a plane of , left-bottom: en face image in an plane of , and right-bottom: (b) and (c) are the en face images at the corresponding depth indicated with the red arrows in the left-up image of Fig. 2(a), respectively; (d) a volume-rendered 3-D movie of the fingertip imaged (Video 2, MOV, 818KB) [URL: http://dx.doi.org/10.1117/1.JBO.17.12.XXXXXX.2]; (e) a snapshot of 3-D volume rendered with max intensity renderer. 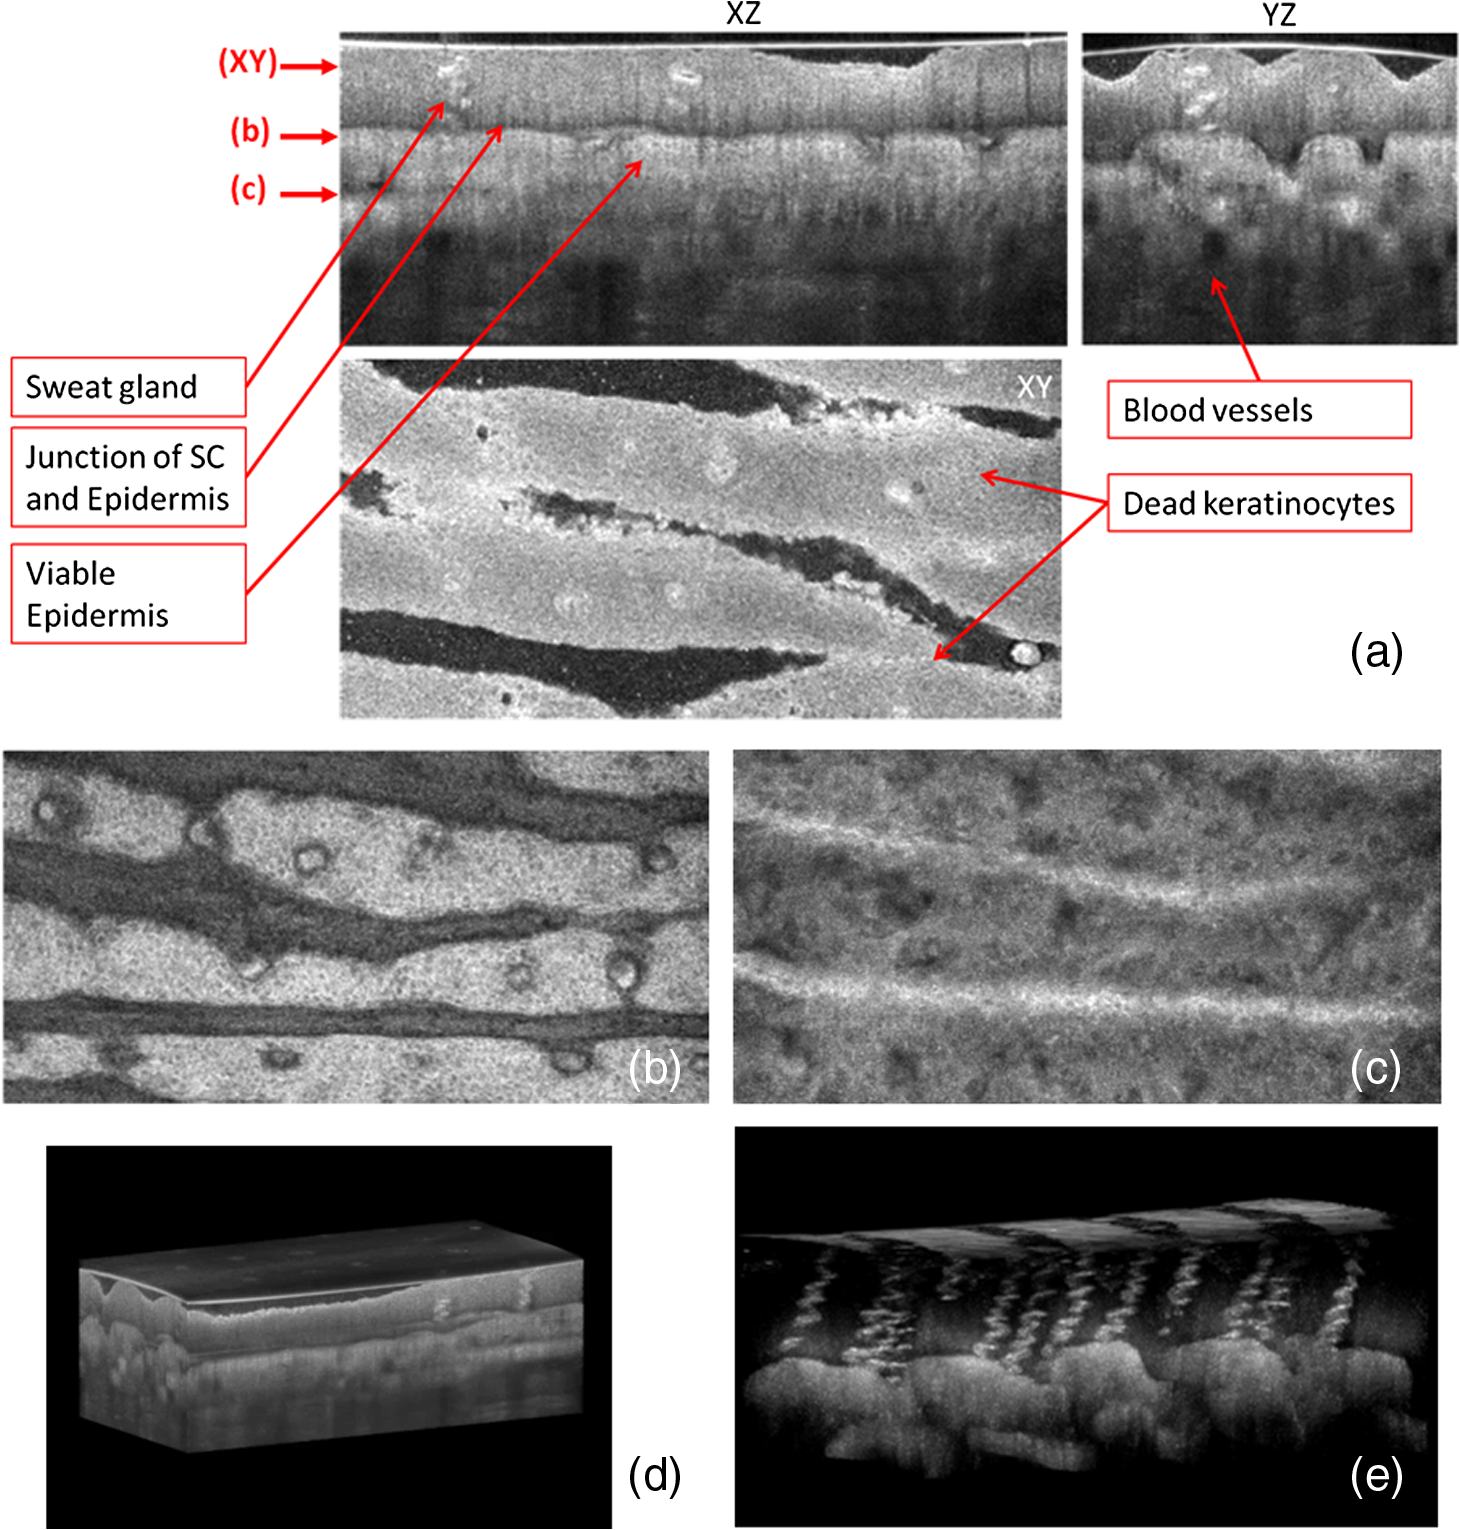 Three orthogonal views of in vivo normal forearm skin were shown in Fig. 3(a). The cross-sectional images of plane and plane [i.e., left-up and right-up images in Fig. 3(a)] clearly delineate some signal-free cavities and longish structures corresponding with blood vessels in the dermis. A lattice pattern of fingerprint lines and keratinocytes are seen in the en face image [i.e., left-bottom image in Fig. 3(a)] at the corresponding depth indicated in the cross-sectional image in Fig. 3(a). The en face image Fig. 3(b) at the depth of dermal-epidermal junction shows small black spots corresponding with blood vessels. Figure 3(c) and (d) at the corresponding depths indicated in Fig. 3(a) in the dermis show the extracellular matrix, predominantly composed of collagen, elastic fibers, and blood vessels. A volume rendered movie of in vivo 3-D normal forearm skin is shown in Fig. 3(e). Fig. 3(a) Three orthogonal views in a 3-D volume of in vivo normal forearm skin (left-up: cross-section in an plane of , right-up: cross-section in a plane of , left-bottom: en face image in an plane of , and right-bottom; (b), (c), and (d) are the en face images at the corresponding depth indicated with the red arrows in the left-up image of Fig. 3(a), respectively; (e) a volume-rendered 3-D movie of the forearm imaged (Video 3, MOV, 1001KB) [URL: http://dx.doi.org/10.1117/1.JBO.17.12.XXXXXX.3].  3.2.Ex Vivo 3-D High-Resolution Images of Normal Skin and NMSCThe cross-sectional GD-OCM image shown in Fig. 4(a) of normal nose skin clearly distinguishes the epidermis from the dermis, while the BCC image in Fig. 4(e) does not have the characteristic, organized layering. In addition, dark lobules consistent with nests of tumor cells were found in the BCC image, which is indicated by the white arrow in Fig. 4(e). Features such as disruption of skin layers and dark lobules have been observed in OCT images of NMSC in previous studies and used to differentiate NMSC from normal skin.43,44 Furthermore, higher signal attenuation in depth was observed in Fig. 4(e) compared with the corresponding image of normal skin.13 Fig. 4(a) A cross-sectional GD-OCM image of a normal nose skin; (b), (c), and (d) are the en face images at the corresponding depth indicated with the red arrows in Fig. 4(a), respectively; (e) a cross-sectional GD-OCM image of BCC located in nose skin; (f), (g), and (h) are the en face images at the corresponding depth indicated with the red arrows in Fig. 4(e), respectively. The size of the cross-sectional images (a) and (e) is , and the size of the en face images is .  In the en face image Fig. 4(b) at the corresponding depth indicated by the red arrows in Fig. 4(a), the numerous keratinocytes around the hair follicle are clearly observed. The en face image Fig. 4(f) of a BCC at the corresponding depth indicated by the red arrows in Fig. 4(e) does not show the organized cellular array. The en face image Fig. 4(c) of normal nose skin in the papillary dermis shows capillaries and hair follicles. The round object indicated with the black arrow in Fig. 4(c) is consistent with a sebaceous gland, as it connects through a duct to an immediately adjacent hair follicle. Clusters of dark cells, sometimes surrounded by lighter areas, are clearly observed [indicated by the white arrows in Fig. 4(g)] and are classic features of BCC and its surrounding stroma seen in histology. The en face images of normal nose skin and BCC are shown at deeper depth in the dermis in Fig. 4(d) and 4(h), respectively. The cross-sectional image in Fig. 5(a) of normal ear skin shows the typical skin layers of the stratum corneum, epidermis and dermis. The well-defined layers are not found in the Fig. 5(e) of the SCC image but replaced by irregularly shaped masses extending into the dermis.45 The irregularity of the tumor is clearly confirmed in the en face images in Fig. 5(f)–5(h) at the three different depths indicated in Fig. 5(e). However, the en face image Fig. 5(b) at a depth in the epidermis in normal ear skin shows keratinocytes in the overall image except a hair follicle and the two sweat ducts. Small black spots observed in the papillary layer in the dermis shown in Fig. 5(c) and 5(d) are inferred to be blood vessels.14 Fig. 5(a) A cross-sectional GD-OCM image of a normal ear skin; (b), (c), and (d) are the en face images at the corresponding depth indicated with the red arrows in Fig. 5(a), respectively; (e) a cross-sectional GD-OCM image of SCC located in ear skin; (f), (g), and (h) are the en face images at the corresponding depth indicated with the red arrows in Fig. 5(e), respectively. The size of the cross-sectional images (a) and (e) is , and the size of the en face images is . 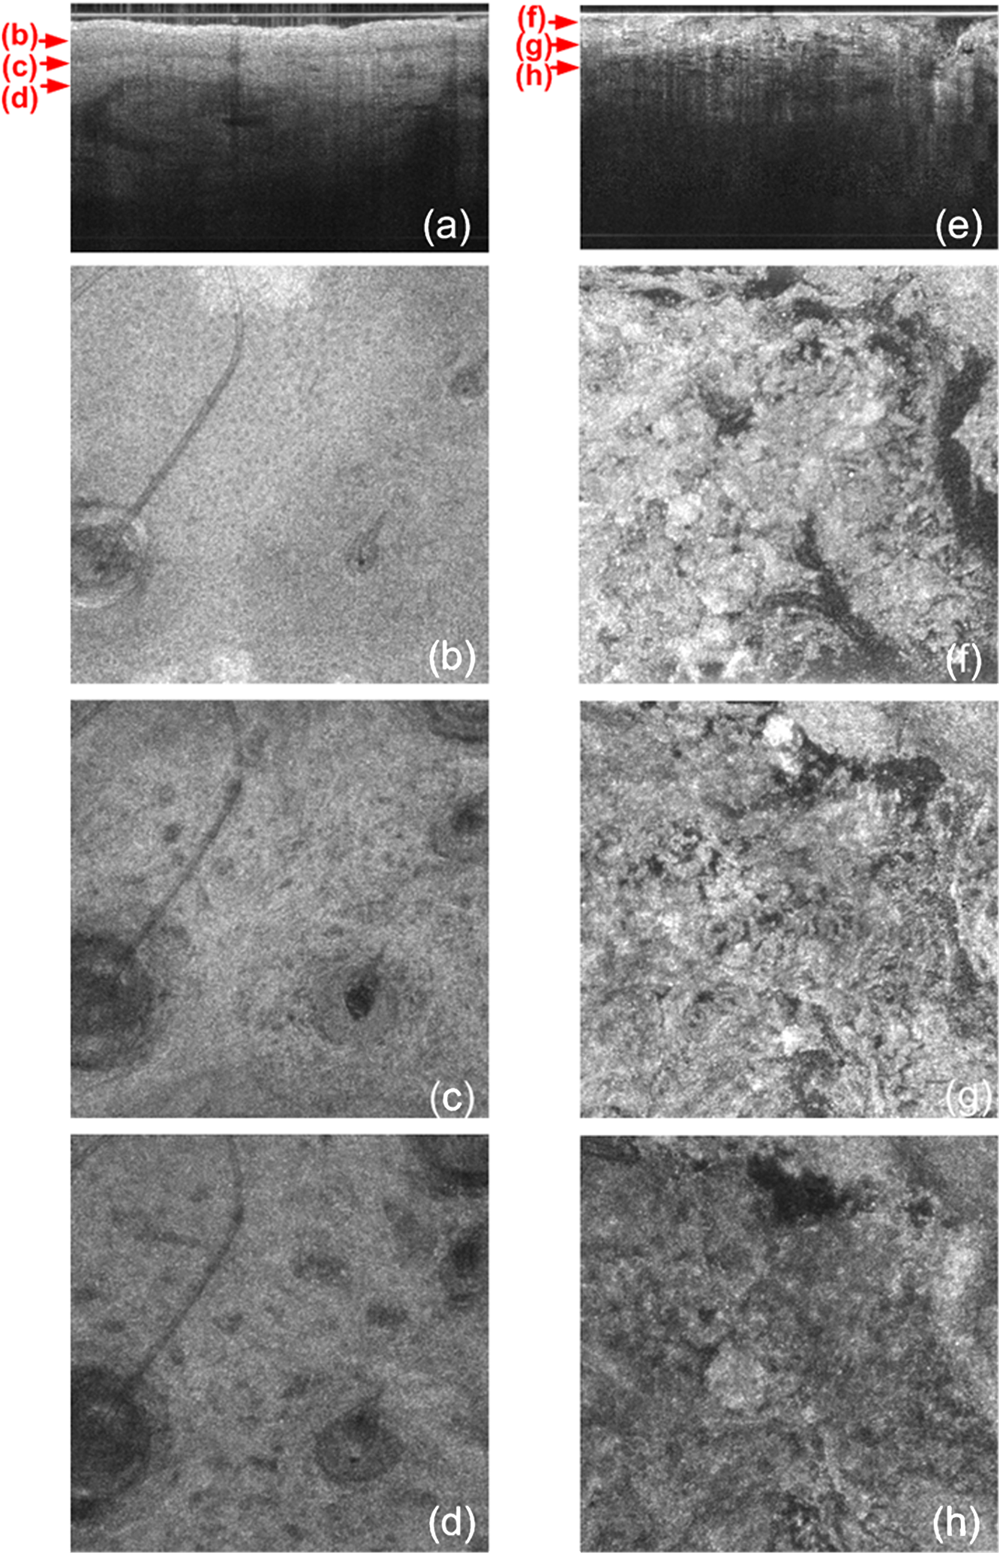 As with the previous two cases (i.e., normal nose skin versus nose BCC and normal ear skin versus ear SCC), the characteristic layering in normal skin is disrupted in the cheek SCC image in Fig. 6(e), while the unperturbed layers are observed in Fig. 6(a) of normal adjacent cheek skin. In addition, a network of keratinocytes [indicated by the black arrows in the en face image Fig. 6(b)] is no longer observed in the SCC en face image Fig. 6(f). The en face images of normal cheek skin and SCC in the dermis are shown in Fig. 6(c) and 5(d) and Fig. 6(g) and 6(h), respectively. Fig. 6(a) A cross-sectional GD-OCM image of a normal cheek skin; (b), (c), and (d) are the en face images at the corresponding depth indicated with the red arrows in Fig. 6(a), respectively; (e) a cross-sectional GD-OCM image of SCC located in cheek skin; (f), (g), and (h) are the en face images at the corresponding depth indicated with the red arrows in Fig. 6(e), respectively. The size of the cross-sectional images (a) and (e) is , and the size of the en face images is .  4.ConclusionIn this study, we investigated morphological differences between NMSC and normal skin in 3-D images with cellular resolution using GD-OCM. This imaging modality has the added capability over FD-OCT of achieving volumetric images with lateral and axial resolution of 2 μm throughout the imaging depth of over 500 μm in human skin. Features of BCC such as the disruption of normal skin layers and nests of densely packed cells were clearly shown in cross-section and en face images at different depths. Additionally, we also observed the disruption of the organized array of keratinocytes in BCC and SCC compared to normal skin. The cellular resolution imaging technique of GD-OCM was also applied to in vivo normal skin from different anatomic locations: nailfold, fingertip, and inner forearm. The acquired images clearly reveal the array of epidermal keratinocytes at the three locations as well as skin appendages such as hair follicles, ducts of sebaceous glands, sweat glands, blood vessels, and the extracellular matrix of connective tissue. Although RCSM may be appropriate for en face in vivo imaging of various skin cells and small structures at different depths, it does not deliver the resolution and the field of view of GD-OCM for the large field of view of volumetric image of the microstructures as well as the large scale structures of the skin appendages. Additionally, it is difficult to obtain in vivo vertical cross-sectional images at high axial resolution with RCSM. GD-OCM is superior to RCSM in fundamentally achieving real-time vertical cross-sectional images with higher axial resolution and deeper imaging depth. This technology has several potential clinical applications, such as in Mohs surgery, which is microscopically controlled surgery used to treat common types of skin cancer. During Mohs surgery, physicians remove successive layers of skin until tumor-free margins are obtained, examining each section microscopically while patients wait in the office for several hours. The extended imaging depth and field of view in GD-OCM will be significantly helpful to find the boundary between cancerous area and normal area to shorten this process considerably. Follow-up clinical studies are planned for in-vivo imaging of NMSC with direct correlation to histology. AcknowledgmentsThis research was funded by the NYSTAR Foundation (C050070) and NIH Core Grant in dermatology. ReferencesJ. AllaliF. D’HermiesG. Renard,
“Basal cell carcinoma of the eyelids,”
Ophthalmologica, 219
(2), 57
–71
(2005). http://dx.doi.org/10.1159/000083263 OPHTAD 0030-3755 Google Scholar
J. A. NevilleE. WelchD. J. Leffell,
“Management of nonmelanoma skin cancer,”
Nat. Clin. Pract. Oncol., 4
(8), 462
–469
(2007). http://dx.doi.org/10.1038/ncponc0883 1743-4254 Google Scholar
H. W. Rogerset al.,
“Incidence estimate of nonmelanoma skin cancer in the United States, 2006,”
Arch. Dermatol., 146
(3), 283
–287
(2010). http://dx.doi.org/10.1001/archdermatol.2010.19 ARDEAC 0003-987X Google Scholar
H. J. Buchwaldet al.,
“Optical coherence tomography versus ultrasound microscopy of conjunctival and eyelid lesions,”
Klin. Monatsbl. Augenheilk, 220
(12), 822
–829
(2003). http://dx.doi.org/10.1055/s-2003-812563 KMAUAI 0023-2165 Google Scholar
H. GuflerF. E. FrankeW. S. Rau,
“High-resolution MRI of basal cell carcinomas of the face using a microscopy coil,”
Am. J. Roentgenol, 188
(5), 480
–484
(2007). http://dx.doi.org/10.2214/AJR.05.0799 AJROAM 0092-5381 Google Scholar
M. Rajadhyakshaet al.,
“In vivo confocal laser microscopy of human skin II: advances in instrumentation and comparison with histology,”
J. Invest. Dermatol., 113
(3), 293
–303
(1999). http://dx.doi.org/10.1046/j.1523-1747.1999.00690.x JIDEAE 0022-202X Google Scholar
B. R. MastersP. T. C. SoE. Gratton,
“Multiphoton excitation fluorescence microscopy and spectroscopy of in-vivo human skin,”
Biophys. J., 72
(6), 2405
–2412
(1997). http://dx.doi.org/10.1016/S0006-3495(97)78886-6 BIOJAU 0006-3495 Google Scholar
D. Huanget al.,
“Optical coherence tomography,”
Science, 254
(5035), 1178
–1181
(1991). http://dx.doi.org/10.1126/science.1957169 SCIEAS 0036-8075 Google Scholar
F. G. Becharaet al.,
“Histomorphologic correlation with routine histology and optical coherence tomography,”
Skin Res. Technol., 10
(3), 169
–173
(2004). http://dx.doi.org/10.1111/j.1600-0846.2004.00038.x 0909-752X Google Scholar
J. Welzelet al.,
“Optical coherence tomography in dermatology: a review,”
Skin Res. Technol., 7
(1), 1
–9
(2001). http://dx.doi.org/10.1034/j.1600-0846.2001.007001001.x 0909-752X Google Scholar
M. C. Pierceet al.,
“Advances in optical coherence tomography imaging for dermatology,”
J. Invest. Dermatol., 123
(3), 458
–463
(2004). http://dx.doi.org/10.1111/jid.2004.123.issue-3 JIDEAE 0022-202X Google Scholar
J. Welzelet al.,
“Optical coherence tomography of the human skin,”
J. Am. Acad. Dermatol., 37
(6), 958
–963
(1997). http://dx.doi.org/10.1016/S0190-9622(97)70072-0 JAADDB 0190-9622 Google Scholar
R. Steineret al.,
“Optical coherence tomography: clinical applications in dermatology,”
Med. Laser Appl, 18
(3), 249
–259
(2003). http://dx.doi.org/10.1078/1615-1615-00107 1615-1615 Google Scholar
A. Alexet al.,
“Multispectral in vivo three-dimensional optical coherence tomography of human skin,”
J. Biomed. Opt., 15
(2), 026025
(2010). http://dx.doi.org/10.1117/1.3400665 JBOPFO 1083-3668 Google Scholar
V. R. Kordeet al.,
“Using optical coherence tomography to evaluate skin sun damage and precancer,”
Lasers Surg. Med., 39
(9), 687
–695
(2007). http://dx.doi.org/10.1002/(ISSN)1096-9101 LSMEDI 0196-8092 Google Scholar
J. Welzelet al.,
“OCT in dermatology,”
Optical Coherence Tomography: Technology and Applications, 1103
–1121 Springer, Berlin
(2008). Google Scholar
J. OlmedoK. WarschawJ. Schmitt,
“Optical coherence tomography for the characterization of basal cell carcinoma in vivo: a pilot study,”
J. Am. Acad. Dermatol., 55
(3), 408
–412
(2006). http://dx.doi.org/10.1016/j.jaad.2006.03.013 JAADDB 0190-9622 Google Scholar
J. M. Olmedoet al.,
“Correlation of thickness of basal cell carcinoma by optical coherence tomography in vivo and routine histologic findings: a pilot study,”
Dermatol. Surg., 33
(4), 421
–425
(2007). http://dx.doi.org/10.1111/dsu.2007.33.issue-4 1076-0512 Google Scholar
T. Gambichleret al.,
“In vivo optical coherence tomography of basal cell carcinoma,”
J. Dermatol. Sci., 45
(3), 167
–173
(2007). http://dx.doi.org/10.1016/j.jdermsci.2006.11.012 JDSCEI 0923-1811 Google Scholar
J. K. Bartonet al.,
“Investigating sun-damaged skin and actinic keratosis with optical coherence tomography: a pilot study,”
Technol. Cancer Res. Treat., 2
(6), 525
–535
(2003). 1533-0346 Google Scholar
P. Wilder-Smithet al.,
“Noninvasive imaging of oral premalignancy and malignancy,”
J. Biomed. Opt., 10
(5), 051601
(2005). http://dx.doi.org/10.1117/1.2098930 JBOPFO 1083-3668 Google Scholar
W. B. Armstronget al.,
“Optical coherence tomography of laryngeal cancer,”
Laryngoscope, 116
(7), 1107
–1113
(2006). http://dx.doi.org/10.1097/01.mlg.0000217539.27432.5a LARYA8 0023-852X Google Scholar
T. Hinzet al.,
“Preoperative characterization of basal cell carcinoma comparing tumour thickness measurement by optical coherence tomography 20-MHz ultrasound and histopathology,”
Acta Derm. Venereol., 92
(3), 132
–137
(2012). http://dx.doi.org/10.2340/00015555-1231 ADVEA4 0001-5555 Google Scholar
R. Ponerantzet al.,
“Optical coherence tomography used as a modality to delineate basal cell carcinoma prior to Mohs micrographic surgery,”
Case Rep. Dermatol., 3
(3), 212
–218
(2011). http://dx.doi.org/10.1159/000333000 Google Scholar
M. Mogensenet al.,
“OCT imaging of skin cancer and other dermatological diseases,”
J. Biophotonics, 2
(6–7), 442
–451
(2009). http://dx.doi.org/10.1002/jbio.v2:6/7 1864-063X Google Scholar
M. Mogensenet al.,
“Assessment of optical coherence tomography imaging in the diagnosis of non-melanoma skin cancer and benign lesions versus normal skin: observer-blinded evaluation by dermatologists and pathologists,”
Dermatol. Surg., 35
(6), 965
–972
(2009). http://dx.doi.org/10.1111/j.1524-4725.2009.01164.x 1076-0512 Google Scholar
A. Aguirreet al.,
“High-resolution optical coherence microscopy for high-speed, in vivo cellular imaging,”
Opt. Lett., 28
(21), 2064
–2066
(2003). http://dx.doi.org/10.1364/OL.28.002064 OPLEDP 0146-9592 Google Scholar
M. Huzairaet al.,
“Topographic variations in normal skin, as viewed by in vivo reflectance confocal microscopy,”
J. Invest. Dermatol., 116
(6), 846
–852
(2001). http://dx.doi.org/10.1046/j.0022-202x.2001.01337.x JIDEAE 0022-202X Google Scholar
M. AkibaK. Chan,
“In vivo video-rate cellular-level full-field optical coherence tomography,”
J. Biomed. Opt., 12
(6), 064024
(2007). http://dx.doi.org/10.1117/1.2822159 JBOPFO 1083-3668 Google Scholar
Y. Zhaoet al.,
“Phase-resolved optical coherence tomography and optical Doppler tomography for imaging blood flow in human skin with fast scanning speed and high velocity sensitivity,”
Opt. Lett., 25
(2), 114
–116
(2000). http://dx.doi.org/10.1364/OL.25.000114 OPLEDP 0146-9592 Google Scholar
M. C. Aalderset al.,
“Doppler optical coherence tomography to monitor the effect of photodynamic therapy on tissue morphology and perfusion,”
J. Biomed. Opt., 11
(4), 044011
(2006). http://dx.doi.org/10.1117/1.2337302 JBOPFO 1083-3668 Google Scholar
J. Strasswimmeret al.,
“Polarization-sensitive optical coherence tomography of invasive basal cell carcinoma,”
J. Biomed. Opt., 9
(2), 292
–298
(2004). http://dx.doi.org/10.1117/1.1644118 JBOPFO 1083-3668 Google Scholar
B. F. Kennedyet al.,
“In vivo three-dimensional optical coherence elastography,”
Opt. Express, 19
(7), 6623
–6634
(2011). http://dx.doi.org/10.1364/OE.19.006623 OPEXFF 1094-4087 Google Scholar
K. Koniget al.,
“Clinical optical coherence tomography combined with multiphoton tomography of patients with skin diseases,”
J. Biophotonics, 2
(6–7), 389
–397
(2009). http://dx.doi.org/10.1002/jbio.v2:6/7 1864-063X Google Scholar
E. Z. Zhanget al.,
“Multimodal photoacoustic and optical coherence tomography scanner using an all optical detection scheme for 3-D morphological skin imaging,”
Biomed. Opt. Express, 2
(8), 2202
–2215
(2011). http://dx.doi.org/10.1364/BOE.2.002202 BOEICL 2156-7085 Google Scholar
K. Leeet al.,
“Micron-class resolution optical coherence microscopy with high acquisition speed for in vivo human skin cell imaging,”
Opt. Lett., 36
(12), 2221
–2223
(2011). http://dx.doi.org/10.1364/OL.36.002221 OPLEDP 0146-9592 Google Scholar
J. P. Rollandet al.,
“Gabor-based fusion technique for optical coherence microscopy,”
Opt. Express, 18
(4), 3632
–3642
(2010). http://dx.doi.org/10.1364/OE.18.003632 OPEXFF 1094-4087 Google Scholar
S. Muraliet al.,
“Three-dimensional adaptive microscopy using embedded liquid lens,”
Opt. Lett., 34
(2), 145
–147
(2009). http://dx.doi.org/10.1364/OL.34.000145 OPLEDP 0146-9592 Google Scholar
K. Leeet al.,
“Dispersion control with Fourier-domain optical delay line in a fiber optic imaging interferometer,”
Appl. Opt., 44
(19), 4009
–4022
(2005). http://dx.doi.org/10.1364/AO.44.004009 APOPAI 0003-6935 Google Scholar
K. Leeet al.,
“Broadband astigmatism correction Czerny-Turner spectrometer,”
Opt. Express, 18
(22), 23378
–23384
(2010). http://dx.doi.org/10.1364/OE.18.023378 OPEXFF 1094-4087 Google Scholar
S. Muraliet al.,
“Assessment of a liquid lens enabled in vivo optical coherence microscope,”
Appl. Opt., 49
(16), D145
–D156
(2010). http://dx.doi.org/10.1364/AO.49.00D145 APOPAI 0003-6935 Google Scholar
H. Dinget al.,
“Refractive indeces of human skin tissues at eight wavelengths and estimated dispersion relations between 300 and 1600 nm,”
Phys. Med. Biol., 51
(6), 1479
–1489
(2006). http://dx.doi.org/10.1088/0031-9155/51/6/008 PHMBA7 0031-9155 Google Scholar
T. Gambichleret al.,
“In vivo data of epidermal thickness evaluated by optical coherence tomography: effects of age, gender, skin type, and anatomic site,”
J. Dermatol. Sci., 44
(3), 145
–152
(2006). http://dx.doi.org/10.1016/j.jdermsci.2006.09.008 JDSCEI 0923-1811 Google Scholar
F. G. Becharaet al.,
“Histomorphologic correlation with routine histology and optical coherence tomography,”
Skin Res. Technol., 10
(3), 169
–173
(2004). http://dx.doi.org/10.1111/j.1600-0846.2004.00038.x 0909-752X Google Scholar
P. A. Khavari,
“Modelling cancer in human skin tissue,”
Nat. Rev. Cancer, 6
(4), 270
–280
(2006). http://dx.doi.org/10.1038/nrc1838 NRCAC4 1474-175X Google Scholar
|


