
|
|
|
Photoacoustic microscopy (PAM) is unique among optical microscopy technologies for its label-free detection of optical absorption with a relative sensitivity of 100%.1 Resolution has always been a key factor in the research and interest of PAM. The lateral resolution of the optical-resolution PAM (OR-PAM) is determined by the light wavelength and the numerical aperture (NA) of the optical objective, specifically, by the formula . Recently, a lateral resolution of 220 nm has been reported for the transmission-mode OR-PAM using a 1.23 NA optical objective at a 532-nm wavelength.2 However, the transmission-mode configuration limits its applications to thin biological tissues, such as a mouse ear. While the reflection-mode configuration is not similarly limited, its implementation is more complicated, making it extremely difficult to realize a large NA in both optical illumination (for high resolution) and ultrasonic detection (for high sensitivity). Until now, in the visible light range, the highest resolution reported for reflection-mode OR-PAM has been with a 0.13 optical NA.3 The existing design of the reflection-mode OR-PAM mainly falls into four categories. First, an optical-acoustic combiner can be used to redirect the ultrasonic waves.3 However, the optical-acoustic combiner is too big to fit into the typically very small working distance of a large-NA objective. Moreover, under high-spatial-resolution conditions, it is difficult to precisely correct the optical distortion introduced by the acoustic lens and the 45 deg split between prisms. Second, a thin piece of glass can be used as the optical-acoustic splitter.4 But for a large-NA objective, even low refractive index glass (Magnesium Fluoride) will introduce noticeable distortion to the optical focusing. Third, a ring-shaped-focused ultrasonic transducer can be used to detect the ultrasonic waves.5 To fabricate such a transducer, a flat active-surface is created and then deformed into a spherical shape for acoustic focusing, so the acoustic NA is limited to . If the optical objective has a 0.5 NA, it is impossible to make a central hole in the transducer that is big enough for the light to pass through. Finally, it is possible to place a commercially available focused transducer off axis.6 However, with a large optical NA, the NA of the transducer is very limited and so is the detection sensitivity. Another issue with this design is the degradation of the axial resolution (e.g., two times degradation with 60° off axis). Therefore, we need a new design for the submicron-resolution PAM. We implemented the reflection-mode submicron-resolution PAM by using a customized parabolic mirror (Ultrasonic S-Lab, LLC) to focus and redirect the ultrasonic waves, as shown in Fig. 1. With the parabolic mirror (1.3-mm focal length, 60 deg apex angle of conical hole, made of stainless steel), sufficient photoacoustic signals ( solid angle, roughly equivalent to the solid angle of a 0.5 NA transducer7) were collected for good sensitivity while the optical focusing remains unaffected. The optical objective (BD Plan Apo SL50, Mitutoyo) has an NA of 0.47. A customized meniscus lens (Biomedical-Optics LLC) with two spherical surfaces, both centered at the objective focus, was used to couple the light from air into water. So the effective NA of the objective is . Although a water-immersion objective might be more convenient, we did not find a commercially available one with sufficient working distance (). The photoacoustic signals were received by a flat ultrasonic transducer (53 MHz central frequency, 94% bandwidth, 4.5-mm diameter of active area) that we customized ourselves. Besides the photoacoustic signals collimated by the parabolic mirror, those directly propagating to the ultrasonic transducer were also received. However, they arrived earlier in time and destructively interfered on the transducer surface. So these early and weak signals were easily differentiated from the focused signals. Fig. 1Reflection-mode submicron-resolution PAM. (a) Schematic of the core system. Acoustic focusing is achieved by the parabolic mirror, which has a central conical hole for light delivery. (b) 3-D model of the parabolic mirror. 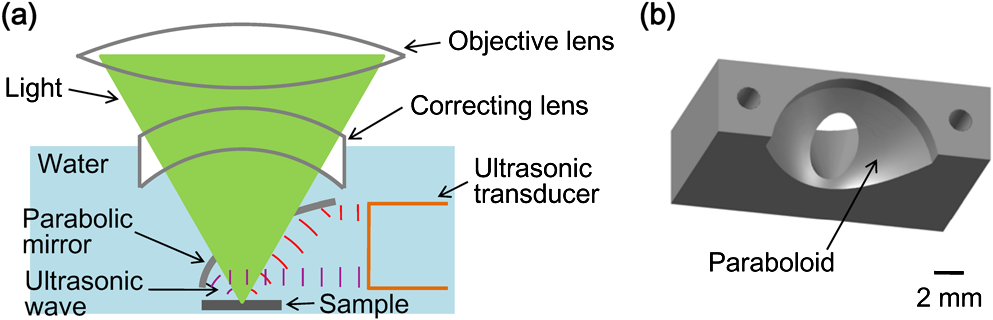 The complete system is described in detail as follows. A Nd:YVO4 laser (SPOT 100-200-532, Elforlight) was triggered by a computer to generate laser pulses with a 532-nm wavelength and a 1.5-ns duration. The laser pulses were coupled to a single-mode optical fiber, which was then connected to a collimator to generate a parallel beam as the input of the optical objective. The laser illumination and ultrasonic detection was explained previously (Fig. 1). The photoacoustic signals detected by the ultrasonic transducer were amplified, digitized at (PCI-5152, National Instruments), and recorded into a computer. Two-dimensional (2-D) raster scanning (PLS-85, MICOS) of the objective and the transducer, while the time-domain photoacoustic signals were digitized, enabled three-dimensional (3-D) imaging. Here, the 3-D images may be shown as 2-D maximum-amplitude projection (MAP) images projected along the depth direction. We measured the lateral resolution of the submicron-resolution PAM. Gold nano-spheres with a 50-nm diameter were imaged to measure the point-spread function (PSF) of the system. Figure 2(a) shows the image of four nano-spheres while Fig. 2(b) shows the mean photoacoustic amplitude of one nano-sphere averaged over the polar angular range versus the radial distance from the sphere center. The experimental data were fitted with the theoretical PSF, a Bessel-form function.8 The lateral resolution, defined by the full-width at half-maximum (FWHM) of the PSF, was quantified to be by fitting the data from six nano-spheres. Taking into account that one nano-sphere in the image might in fact be an aggregation of several nano-spheres, which would worsen the estimated resolution, we measured the edge spread function (ESF) as a further validation. An Air Force resolution test chart was imaged, as shown in Fig. 2(c). The photoacoustic amplitude values along a line crossing the edge of a bar were fitted by the theoretical ESF [Fig. 2(d)], which could be calculated by integrating the 2-D PSF. In this way, the lateral resolution was quantified as by fitting the data from 16 edges. Therefore, we claim that the submicron-resolution PAM has a lateral resolution of . The theoretical lateral resolution is . The experimentally measured resolution is slightly worse, likely due to the imperfect air-water coupling [Fig. 1(a)]. Fig. 2Measuring the lateral resolution of the submicron-resolution PAM. (a) PAM image of four gold nano-spheres each 50 nm in diameter. (b) By fitting the point spread function centered at each nano-sphere, the lateral resolution is quantified as . Blue circle: experimental measurement. Red line: theoretical fit. (c) PAM image of an Air Force resolution test chart. (d) By fitting the edge spread function given by the bars, the lateral resolution is quantified as . Blue circle: experimental measurement. Red line: theoretical fit. 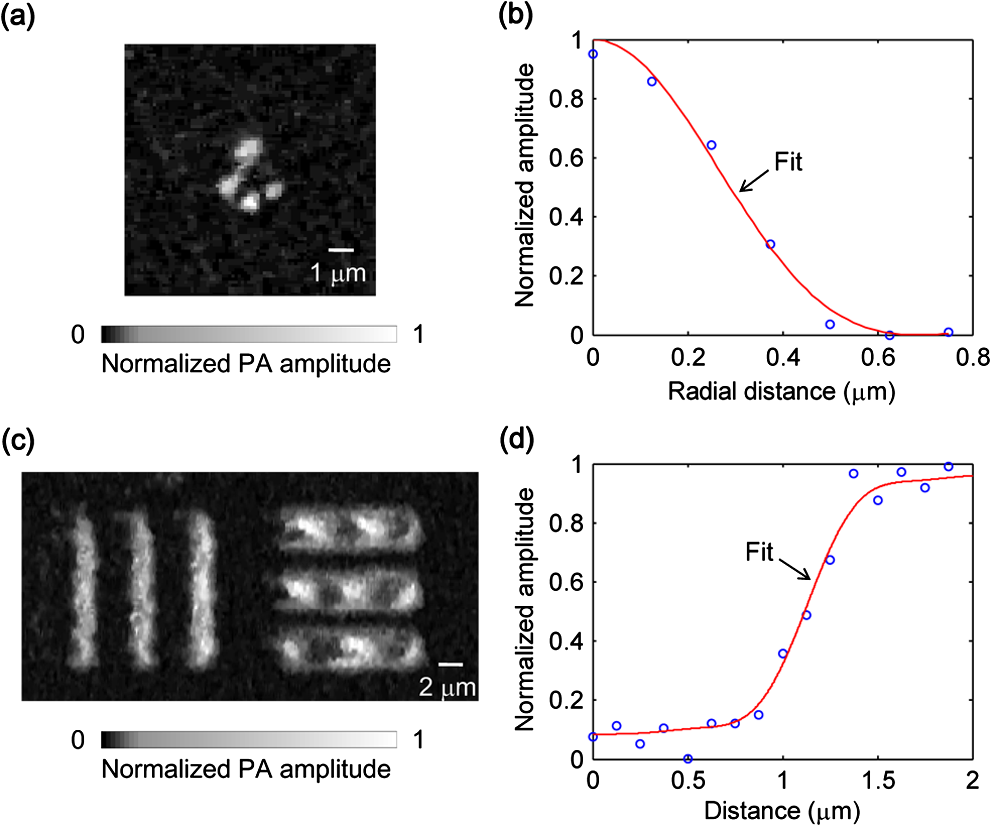 We also measured the axial resolution of the submicron-resolution PAM. The A-line photoacoustic signal of a black tape is shown in Fig. 3(a). As a conservative estimation, the axial resolution could be calculated by numerically shifting and summing two A-line signals and checking whether the two peaks could be differentiated (contrast-to-noise ratio greater than 2) in the envelope [Fig. 3(b)].9 In this way, the axial resolution was quantified as 33 μm, agreeing with the 50 MHz bandwidth of the transducer. However, when the signal-to-noise ratio (SNR) is sufficiently high, the axial resolution can be further improved by deconvolving the experimental A-line data with the system-impulse response,10 for which Fig. 3(a) can be used as the estimation. Figure 3(c) shows the in vivo 3-D image of a mouse ear (Hsd:Athymic , Harlan Co.) after using the Wiener deconvolution ( here). Two blood vessels with a 15 μm distance in the depth direction were resolved. Therefore, with sufficient SNR ( as estimated by simulation), the axial resolution of the submicron-resolution PAM is better than 15 μm. Fig. 3Measurement of the axial resolution of the submicron-resolution PAM. (a) The A-line photoacoustic signal of a black tape. (b) When summing two A-line signals [shown in (a)] with a shift, the contrast-to-noise ratio (CNR) of the envelope is greater than 2. Dashed line: . (c) In vivo 3-D mouse ear image showing two crossed blood vessels (left panel) and a 2-D cross-sectional image (right). By deconvolving the in vivo data with the impulse response shown in (a), the axial resolution is better than 15 μm.  We tested the penetration depth of the submicron-resolution PAM by imaging a human hair inserted obliquely into chicken leg tissue ex vivo. Figure 4(a) shows the B-scan image (fused from three B-scan images acquired by focusing at different depths: 0.04, 0.1 and 0.3 mm). The hair was imaged clearly with an SNR of down to 0.42 mm beneath the tissue surface [Fig. 4(b)]. Therefore, the submicron-resolution PAM can penetrate in soft tissue. Fig. 4Measurement of the penetration depth of the submicron-resolution PAM. (a) A human hair inserted obliquely into chicken leg tissue is imaged clearly down to 0.42 mm beneath the tissue surface. (b) Signal-to-noise ratio (SNR) of the hair versus imaging depth. Dashed lines indicate 6 dB SNR at 0.42 mm imaging depth. The data from the three focal depths 0.04, 0.1, and 0.3 mm are denoted by solid, dashed, and dotted line types.  The submicron-resolution PAM was compared with a 2.4 μm-resolution (calculated from the reported 2.6-μm resolution at 570-nm wavelength) PAM3 by imaging a mouse ear (Hsd:Athymic , Harlan Co.) in vivo. Both systems used a 532 nm-wavelength laser. When imaging the ear, the submicron-resolution PAM used pulse energy, and the 2.4 μm-resolution PAM used pulse energy. Figure 5(a) shows the image from the 2.4 μm-resolution PAM and the corresponding wide-field (i.e., planar) optical microscopy image (blood vessels had much lower contrast). The detailed comparison between the two PAM systems is shown in Figs. 5(b) and 5(c). As indicated by the arrows, capillaries were resolved better by the submicron-resolution PAM. The capillaries appeared finer and richer in the submicron-resolution PAM image. But at the same time, some deeper vessels were out of focus because of the shorter focal zone (). Fig. 5Comparing the submicron-resolution PAM with a 2.4 μm-resolution PAM by imaging a mouse ear in vivo. (a) 2.4 μm-resolution PAM image of the mouse ear (left panel) and the corresponding wide-field optical microscopy image (right panel). (b) Close-up of the blue dashed square area in (a) (left) and the corresponding image from the submicron-resolution PAM (right). Selected differences of interest are indicated by arrows. (c) Close-up of the gray dotted square area in (a) (left) and the corresponding image from the submicron-resolution PAM (right). All PAM images are shown with the same color scale.  In summary, we have developed the submicron-resolution PAM in reflection mode. The 0.5 μm lateral resolution and the reflection-mode configuration suggest potential in vivo applications in high-resolution imaging, or even subcellular imaging, in anatomical sites up to in depth. AcknowledgmentsWe thank Lidai Wang, Junjie Yao, Amy Winkler, and Bin Rao for experimental assistance and helpful discussions. This work was sponsored in part by National Institutes of Health grants R01 EB000712, R01 EB008085, R01 CA134539, U54 CA136398, R01 CA157277, and 5P60 DK02057933. Lihong Wang has a financial interest in Microphotoacoustics, Inc. and Endra, Inc., which, however, did not support this work. ReferencesL. V. Wang,
“Multiscale photoacoustic microscopy and computed tomography,”
Nat. Photon., 3
(9), 503
–509
(2009). http://dx.doi.org/10.1038/nphoton.2009.157 1749-4885 Google Scholar
C. ZhangK. MaslovL. V. Wang,
“Subwavelength-resolution label-free photoacoustic microscopy of optical absorption in vivo,”
Opt. Lett., 35
(19), 3195
–3197
(2010). http://dx.doi.org/10.1364/OL.35.003195 OPLEDP 0146-9592 Google Scholar
S. HuK. MaslovL. V. Wang,
“Second-generation optical-resolution photoacoustic microscopy with improved sensitivity and speed,”
Opt. Lett., 36
(7), 1134
–1136
(2011). http://dx.doi.org/10.1364/OL.36.001134 OPLEDP 0146-9592 Google Scholar
B. Raoet al.,
“Hybrid-scanning optical-resolution photoacoustic microscopy system for in vivo vasculature imaging,”
Opt. Lett., 35
(10), 1521
–1523
(2010). http://dx.doi.org/10.1364/OL.35.001521 OPLEDP 0146-9592 Google Scholar
D.-K. Yaoet al.,
“In vivo label-free photoacoustic microscopy of cell nuclei by excitation of DNA and RNA,”
Opt. Lett., 35
(24), 4139
–4141
(2010). http://dx.doi.org/10.1364/OL.35.004139 OPLEDP 0146-9592 Google Scholar
R. L. SheltonB. E. Applegate,
“Off-axis photoacoustic microscopy,”
IEEE Trans. Biomed. Eng., 57
(8), 1835
–1838
(2010). http://dx.doi.org/10.1109/TBME.2010.2043103 IEBEAX 0018-9294 Google Scholar
E. F. Schubert, Light-emitting diodes, 374
–376 Cambridge University Press, Cambridge, UK
(2006). Google Scholar
L. V. WangH.-I. Wu, Biomedical Optics: Principles and Imaging, 164
–169 Wiley, Hoboken, New Jersey
(2007). Google Scholar
G. Kuet al.,
“Photoacoustic microscopy with 2-µm transverse resolution,”
J. Biomed. Opt., 15
(2), 021302
–021302-1-5
(2010). http://dx.doi.org/10.1117/1.3339912 JBOPFO 1083-3668 Google Scholar
J. A. Jensenet al.,
“Deconvolution of in-vivo ultrasound B-mode images,”
Ultrason. Imag., 15
(2), 122
–133
(1993). http://dx.doi.org/10.1006/uimg.1993.1010 ULIMD4 0161-7346 Google Scholar
|


