|
|
1.IntroductionGastrointestinal malignancies are one of the leading causes of cancer-related deaths. Of gastrointestinal malignancies, colorectal cancer is the fourth most commonly diagnosed cancer in the world, and it is more common in developed countries.1 Cancers that are confined within the colon wall are often curable with surgery, whereas cancer that has spread widely around the body is usually incurable and management then focuses on extending the person’s life via chemotherapy and improving his/her quality of life. Therefore, many studies have been done to diagnose cancer at its early stage.2–7 Studies at more advanced stages, however, may be useful as well. Proper cancer staging is very important to assess the appropriate medical treatment after surgery to increase the patient’s survival time. Most colorectal cancers are staged after pathologic examination of the surgical resection specimen.8 This is a tedious and difficult work that typically involves the preparation and microscopic examination of many slides and requires a lot of time and professional skills. Being fast, noninvasive, or minimally invasive and inexpensive, optical imaging techniques have been attracting much attention for biomedical diagnostics.9–15 Such techniques thus seem to have great potential to improve the efficiency of the staging procedure. In previous experimental16,17 and numerical18,19 studies, we showed that multispectral Mueller imaging can provide useful contrasts for ex vivo human colon cancer in the advanced stages and allows different histological variants of the tumor to be distinguished. Budding zones, characterized by very thick cancer layers with high cellular densities, are less depolarizing than healthy regions for all investigated wavelengths (500 to 700 nm), whereas ulcerated zones exhibit a response similar to that of healthy tissue, especially at longer wavelengths (650 to 700 nm). These results suggested that in budding zones, the light beam interacts predominantly with the superficial cancer layer for all used wavelengths. Conversely, in ulcerated zones where the cancer is not as thick, the light beam probably interacts predominantly with healthy deeper layers, especially at longer wavelengths. Though the explanation of the experimental trends outlined above seems quite intuitive, a better assessment of the contributions of the various tissue layers in the light backscattered by a typical colon sample is clearly necessary. To this end, in this study we measured the overall intensity and polarimetric responses of healthy colon samples when the outer layers were progressively exfoliated. These measurements were carried out with two different substrates, black and white paper. Black paper is used for a direct characterization of the contributions of the light directly scattered within the sample, and white, for the light traversing the sample and backscattered through it by the substrate. 2.Methods2.1.Experimental SetupA schematic of the multispectral imaging Mueller polarimeter used in this study is shown in Fig. 1 and is an upgraded version of that described in Refs. 20 and 21. A halogen lamp and a fiber bundle are used to illuminate the sample. The illumination beam passes through a telescopic set of lenses with its iris placed in common focus, a telecentric configuration that images the output of the fiber bundle inside the Polarization State Generator (PSG), with a subsequent image of the source on the sample that we want to analyze. The PSG, obtained by using a polarizer together with two nematic liquid crystals with fixed axes and variable retardations, modulates the polarization of the incident beam. A Polarization State Analyzer (PSA), obtained with the same optical elements of the PSG assembled in reverse order, is used to analyze the backscattered light. Using the telecentric system of the PSG allows a spatially uniform polarization of the beam to be obtained over the field of view; this can eliminate artifacts caused by positioning of the sample. To image the object under study in the backscattering configuration, we used a CCD camera (resolution ). A close-up lens coupled with the zoom of the camera allows the observation window to be changed from 4 to . The wavelength was varied from 500 to 700 nm in steps of 50 nm by use of 20-nm-wide interference filters. Finally, a metallic plate was used to measure and matrices characterizing respectively PSG and PSA. The sample was placed on an entirely transparent glass. Through a system of rails, the glass along with the sample can be displaced in space in the , , directions. Using this experimental setup we analyzed each layer of colon with different substrates under the same experimental conditions, with the natural deformations of the sample being negligible during the time of measurement. The size of the observed window was kept equal to . 2.2.ProcedureThe colon has a tubular structure composed of different layers with different microscopic properties. From the innermost to outermost, the layers are mucosa, submucosa, muscular tissue (formed by circular muscular tissue and longitudinal muscular tissue), pericolic tissue (formed predominantly by fat), and serosa. As mentioned above, we measured the Mueller matrix of various colon samples deposited on two different substrates in backscattering geometry. Whole colon was measured first. Then the fat tissue was removed and the Mueller matrix measurements were done on fat tissue alone and on the remaining part of the sample (i.e., the superposition of mucosa, submucosa, and muscular tissue). Last, muscular tissue was separated from the mucosa and submucosa, and Mueller matrices of muscular tissue and the combination of mucosa and submucosa were measured. Each sample was measured above substrates of white paper and black paper. Here the white paper is called “Lambertian,” as it features high albedo and a diffuse (nearly cosine) angular distribution of the backscattered light no matter how it is illuminated, and the latter is termed “absorber.” Our raw experimental data essentially consist of non-normalized Mueller matrix images with . For such a matrix , where identifies the pixel, the generic elements are written as and and vary between 1 and 4. We point out that the elements are not calibrated: these elements thus provide the overall reflectivity of the imaged object at pixel for incident unpolarized light in arbitrary units. These units may vary with wavelength as a result of the spectral variation of the illumination intensity and/or the CCD sensitivity, among other factors. Throughout this work, we consider spatial averages of the raw data, to eliminate as much as possible the effects of sample inhomogeneities, such as variations in thickness. As a result, for the generic matrix image considered above, we denote its spatial average by , whose elements are In the following, we also consider the matrices , whose generic elements are those of normalized by :3.Results and Discussion3.1.Measurements on Bare SubstratesThe Mueller matrices of the Lambertian and absorber alone, respectively, are and , and their averages are and . Figure 2 shows the intensity data, in the form of unnormalized , for both types of substrates. As has already been mentioned, the overall normalization factor, related to the illumination intensity and CCD sensitivity, depends on the wavelength. However, condition was satisfied for all investigated wavelengths. Fig. 2(a) Images of the two substrates. (b) Unnormalized intensities measured on both substrates, and the ratio of the corresponding reflectivities. 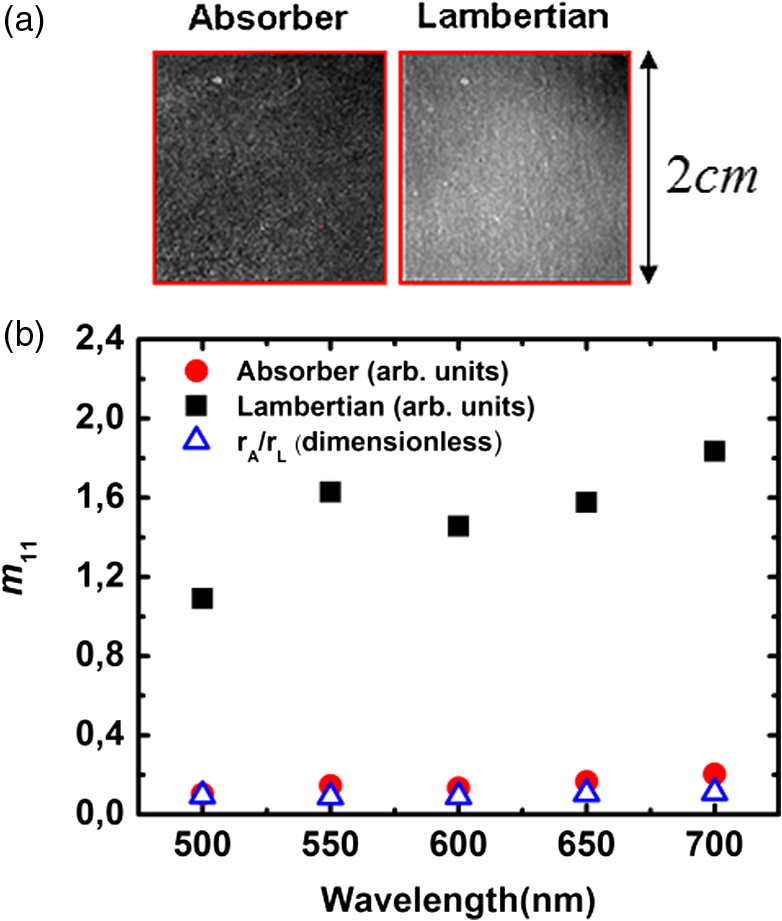 We define the sample reflectivities and for incident unpolarized light as and where is the intensity of the incident light. The ratio of these reflectivities turns out to be for all investigated wavelengths. This result suggests that the absorber is not perfect.From the polarimetric point of view, both Lambertian and absorber are pure depolarizers, with diagonal Mueller matrices. Figure 3 summarizes the results of the polarimetric measurements. The relationship between the diagonal terms of the normalized Mueller matrices, (typical of backscattering by particles smaller than ), was satisfied for all wavelengths. The Lambertian was more depolarizing than the absorber for both linear and circular incident polarizations as3.2.Measurements of Colon Samples3.2.1.Intensities measurementsAs outlined in Fig. 4 the unnormalized Mueller matrix of the system comprising the colon sample and the substrate can be written as the incoherent sum of three terms: where is the contribution of the light (blue line in Fig. 4) directly backscattered by the colon sample, without reaching the substrate; with , is the contribution of the light (red line in Fig. 4) scattered by the sample and the substrate; and is the contribution of specular reflections (black lines in Fig. 4) of the surface. As we analyzed only those zones where specular reflections were negligible, we consider .Fig. 4Different contributions to the Mueller matrix of the system composed of the sample and the substrate in backscattering geometry.  The mean values of the first element of the and Mueller matrices can be written as where is the intensity of illuminating light; are, respectively, the reflectivity and transmittance of the analyzed sample for the incident light; are, respectively, the reflectivity and transmittance of the sample for light diffused by the substrate; and is the reflectivity of the substrate for the light diffused by the sample. As transmittance and reflectivity generally depend on the angle of incidence of impinging light, we have to consider and , as the light touching the substrate is mainly diffused by the sample and is thus much less directional than the illumination beam. For the same reason, the reflectivity of the substrate when the sample is present () is different from its counterpart without the sample ().Equation (5) shows that is small, and so certainly is as well. Hence and the matrix is approximately equal to the measured matrix with the absorber as a substrate. On the other hand, with the Lambertian substrate the value of [from Eq. (1)] is not small; therefore, the term cannot be neglected. We assume, however, that for the terms are negligible. Hence By subtracting Eq. (9) from Eq. (11), we immediately find that which can be considered a good estimate of the light that passes through the sample, touches the substrate, is scattered back by the substrate, and again passes through the sample and is detected.The different samples are coded as
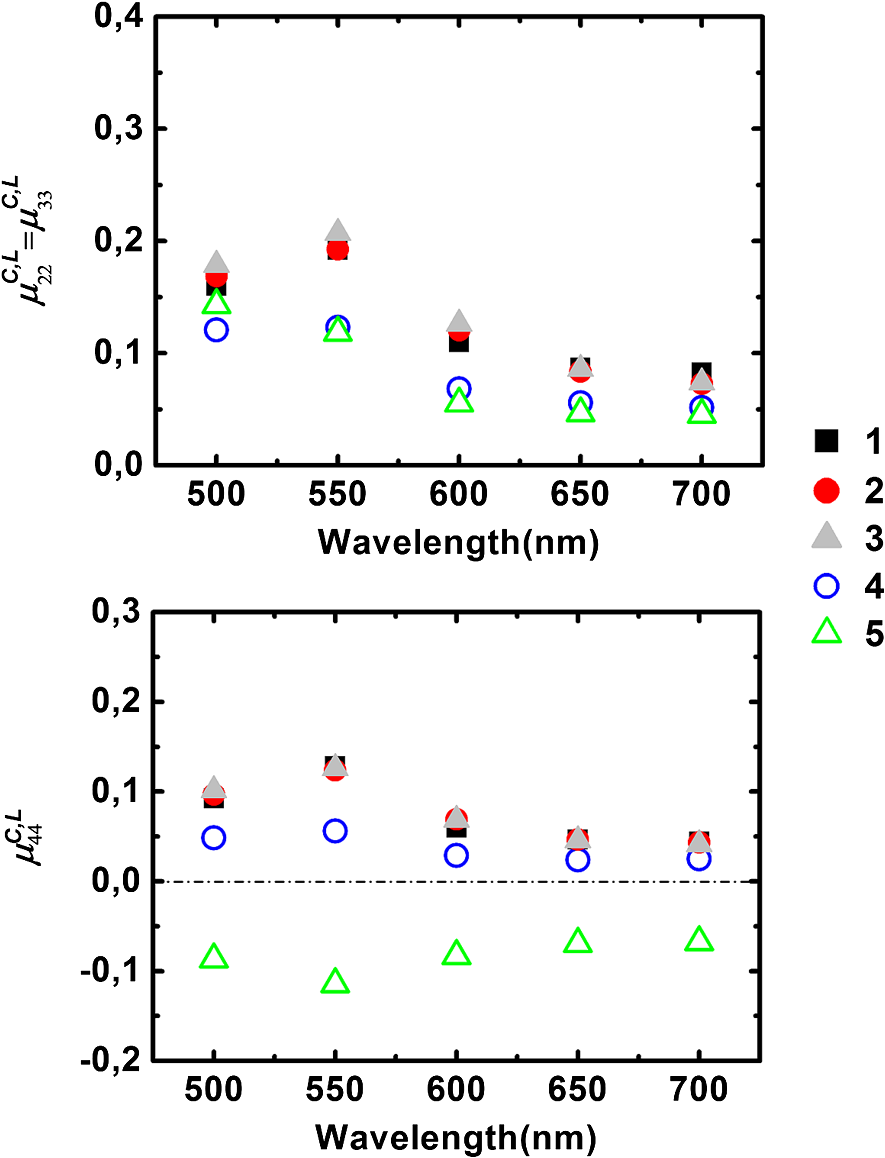
For the samples coded 1, 2 and 3, both and increase with wavelength, as shown in Fig. 5. We pointed out that these quantities are given in arbitrary units that depend on the wavelength. However, the overall relative increase of and from 500 to 700 nm is much larger than that observed for the Lambertian alone (Fig. 2). As a result, we can safely conclude that the reflectivities of all samples for both the directly and indirectly scattered light do increase with wavelength. For , the trend is caused by an increase in the average number of scattering events suffered by the photons, as light penetrates deeper into the layers. This increment is larger for whole colon (sample 3) than for the mucosal layer (sample 1) because for the former, longer wavelengths may penetrate into the deeper layers (e.g., muscular and fat) and then backscatter, while these layers are absent for sample 1. Sample 2 (mucosa, submucosa, and muscular tissue) is an intermediate case. The increase of with wavelength also confirms that light penetrates more deeply. Fig. 5(a) Light intensity backscattered only by the sample for , 2, 3 in arbitrary units. (b) Light passing through the sample, backscattered by the Lambertian substrate, and passing through the sample again for , 2, 3. 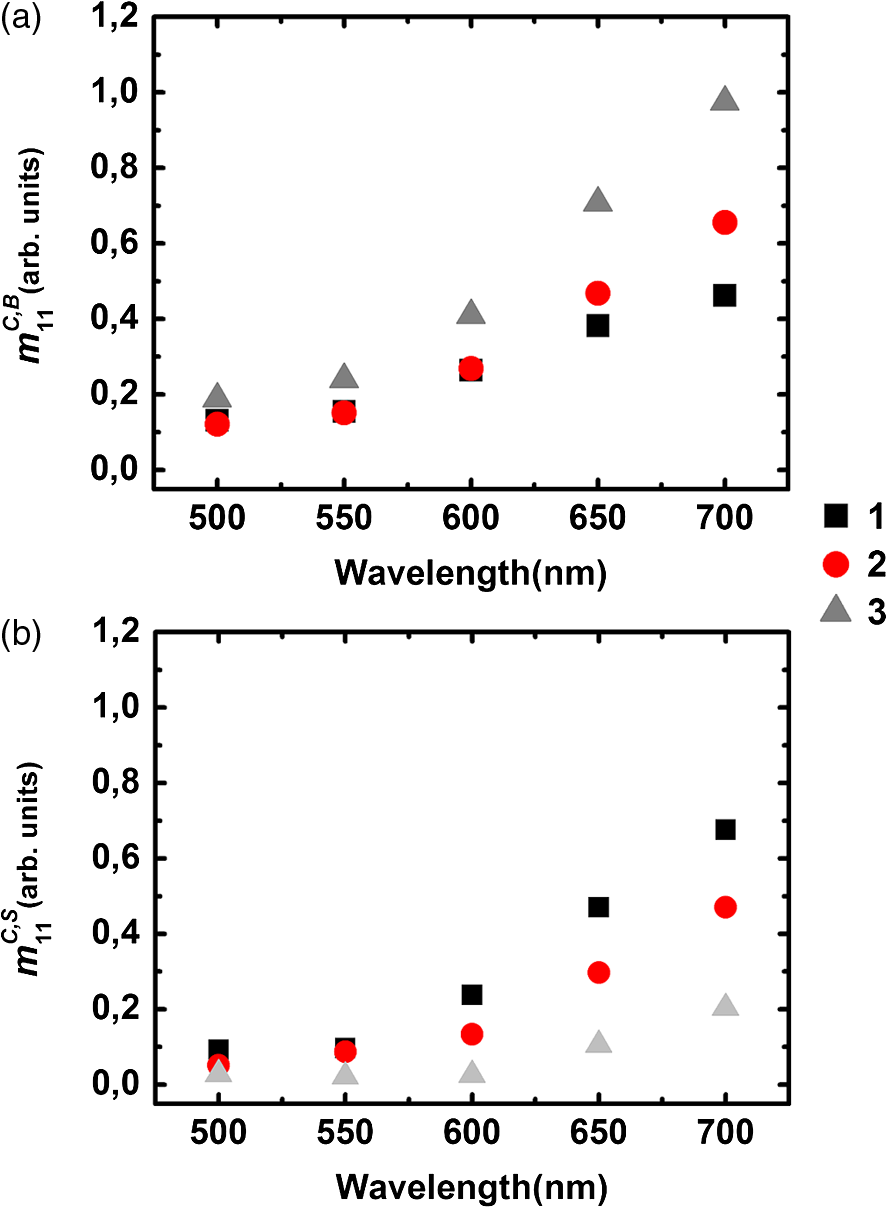 The relative positions of the curves corresponding to samples 1, 2, and 3 for in Fig. 5 are easy to understand: sample thickness increases from 1 to 3, allowing less light to pass through and reach the substrate. Even though and are unnormalized quantities, the data shown in Fig. 5 can be used to compare the different layers at each given wavelength. To this end, we normalize the directly backscattered intensity for samples 1 and 2 by the analogous quantity measured on sample 3 (whole colon). The results are shown in Fig. 6. Fig. 6Intensities backscattered from layers 1 (mucosa and submucosa) and 2 (mucosa, submucosa, and muscular tissue) normalized by backscattered intensity from whole colon (sample 3).  These results clearly show that at shorter wavelengths (500 to 600 nm) the main contribution to the directly backscattered light is coming from layer 1 (mucosa and submucosa) because the ratio was observed to be almost the same () as for layers 1 and 2 (at 500 nm the difference is less than 5%). As a result, muscular layer seems to have negligible contribution to the total detected backscattered light at shorter wavelengths. Two effects may account for this behavior: first, the absorption of hemoglobin, because of which the light passes through the sample, may be partially absorbed, and second, the scattering (by the muscular layer) may be more forwardly directed. Conversely, at higher wavelengths (650 and 700 nm) deeper layers like the muscular and fat layers too have a contribution in the total detected backscattered light. At these wavelengths blood has the least absorption ()22 so less light will be absorbed, and second, the fat layer, which behaves like a Rayleigh scatterer, will have backscattering that more effectively contributes to the total detected backscattered light. 3.2.2.Depolarization measurementsThe depolarization behavior of the different layers was also studied. In Fig. 7 we plot the values of normalized diagonal elements and for the five types of samples. Fig. 7Normalized diagonal elements of the Mueller matrix for the five studied samples with absorber substrate.  In Fig. 7 (top panel) for all samples except fat, the elements () exhibit a peak at 550 nm, followed by a slow decrease with increasing wavelength from 500 to 700 nm. In other words, the depolarizing power is at its minimum at 550 nm and increases with increasing wavelength. This trend is related to hemoglobin absorption (which is maximum at 550 nm among the used wavelengths22), so photons that suffer large scattering events (more depolarized) are absorbed and less scattered (less depolarized) photons are detected, hence resulting in lower depolarization. Sample 2 is quite close to sample 1 in the green part of the spectrum, while it becomes more similar to sample 3 (whole colon), with a stronger depolarization in the red part. These trends are consistent with previous results on intensities: in the green, mucosa and submucosa is the dominating layer, and in the red, the muscular tissue too exhibits a significant contribution to the backscattering, and this contribution is clearly strongly depolarized. Strong depolarization was also observed on sample 4 (muscular layer) and sample 5 (fat layer) at all wavelengths. The same trends are observed on the bottom panel of Fig. 7 as are observed on the top panel of Fig. 7, which respectively describe depolarization for circularly (bottom) and linearly (top) polarized illuminations. However, depolarization is always larger for circular than linear polarization, as usual for biological tissues, where most scatterers are smaller than optical wavelengths, and thus operate in the Rayleigh regime. The negative values of for the fat layer correspond to a reversal of the sense of rotation of the electric field.23 In Fig. 8 we present the results of the same kind of measurements, with the Lambertian substrate replacing the absorber. For samples 3, 4, and 5, the results are practically identical to the previous ones (Fig. 7). This indicates that the light which may have traversed these samples to reach the substrate is already totally depolarized. Conversely, for samples 1 and 2 depolarization increases, especially in the red part of the spectrum. This is again a clear indication that a significant part of the light actually reaches the substrate, where it becomes totally depolarized while being scattered backwards, providing a totally depolarized contribution that increases the observed depolarization. 4.ConclusionPolarimetric measurements of the light backscattered from colon samples at various steps of exfoliation and with two different substrates allowed us to quantify the fractions of light backscattered directly and indirectly (i.e., via the substrate) by the samples under study. For shorter wavelengths, a large fraction of backscattered light comes from the mucosa and submucosa, while for the larger wavelengths, the contribution of deeper layers (the muscular and fat layers) is also significant. The muscular layer, as well as fat, turns out to be highly depolarizing. For the fat layer the inversion of sign for circular polarization () was also observed. These results should prove useful for the interpretation of Mueller images of samples of colon and other organs with similar architecture, healthy or diseased. ReferencesX. Shao, W. Zheng and Z. Huang,
“Polarized near-infrared autofluorescence imaging combined with near-infrared diffuse reflectance imaging for improving colonic cancer detection,”
Opt. Express, 18
(23), 24293
–24300
(2010). http://dx.doi.org/10.1364/OE.18.024293 OPEXFF 1094-4087 Google Scholar
N. Iftimia et al.,
“Fluorescence-guided optical coherence tomography imaging for colon cancer screening: a preliminary mouse study,”
Biomed. Opt. Express, 3
(1), 178
–191
(2012). http://dx.doi.org/10.1364/BOE.3.000178 BOEICL 2156-7085 Google Scholar
T. D. Wang et al.,
“In vivo identification of colonic dysplasia using fluorescence endoscopic imaging,”
Gastrointest. Endosc., 49
(4 Pt 1), 447
–455
(1999). http://dx.doi.org/10.1016/S0016-5107(99)70041-6 GAENBQ 0016-5107 Google Scholar
R. Richards-Kortum et al.,
“Spectroscopic diagnosis of colonic dysplasia,”
Photochem. Photobiol., 53
(6), 777
–786
(1991). PHCBAP 0031-8655 Google Scholar
P.-L. Hsiung et al.,
“Detection of colonic dysplasia in vivo using a targeted heptapeptide and confocal microendoscopy,”
Nat. Med., 14
(4), 454
–458
(2008). http://dx.doi.org/10.1038/nm1692 1078-8956 Google Scholar
C.-C. Yu et al.,
“Quantitative spectroscopic imaging for non-invasive early cancer detection,”
Opt. Express, 16
(20), 16227
–16239
(2008). http://dx.doi.org/10.1364/OE.16.016227 OPEXFF 1094-4087 Google Scholar
Colon and Rectum,
(2006). Google Scholar
M. H. Smith et al.,
“Mueller matrix imaging polarimetry in dermatology,”
Proc. SPIE, 3911 210
–216
(2000). http://dx.doi.org/10.1117/12.384904 PSISDG 0277-786X Google Scholar
S. L. Jacques et al.,
“Polarized light camera to guide surgical excision of skin cancers,”
Proc. SPIE, 6842 68420I
(2008). http://dx.doi.org/10.1117/12.761823 PSISDG 0277-786X Google Scholar
Y. Guo et al.,
“Second-harmonic tomography of tissues,”
Opt. Lett., 22
(17), 1323
–1325
(1997). http://dx.doi.org/10.1364/OL.22.001323 OPLEDP 0146-9592 Google Scholar
B. D. Cameron and H. Anumula,
“Development of a real-time corneal birefringence compensated glucose sensing polarimeter,”
Diabetes Tech. Theraput., 8
(2), 156
–164
(2006). http://dx.doi.org/10.1089/dia.2006.8.156 Google Scholar
Y. Lo and T. Yu,
“A polarimetric glucose sensor using a liquid-crystal polarization modulator driven a sinusoidal signal,”
Opt. Commun., 259
(1), 40
–48
(2006). http://dx.doi.org/10.1016/j.optcom.2005.08.061 OPCOB8 0030-4018 Google Scholar
W. Denk, J. H. Strickler and W. W. Webb,
“2-photon laser scanning fluorescence microscopy,”
Science, 248
(4951), 73
–76
(1990). http://dx.doi.org/10.1126/science.2321027 SCIEAS 0036-8075 Google Scholar
M. F. G. Wood et al.,
“Proof-of-principle demonstration of a Mueller matrix decomposition method for polarized light tissue characterization in-vivo,”
J. Biomed. Opt., 14
(1), 014029
(2009). http://dx.doi.org/10.1117/1.3065545 JBOPFO 1083-3668 Google Scholar
A. Pierangelo et al.,
“Ex-vivo characterization of human colon cancer by Mueller polarimetric imaging,”
Opt. Express, 19
(2), 1582
–1593
(2011). http://dx.doi.org/10.1364/OE.19.001582 OPEXFF 1094-4087 Google Scholar
A. Pierangelo et al.,
“Use of Mueller imaging for the staging of human colon cancer,”
Proc. SPIE, 7895 78950E
(2011). http://dx.doi.org/10.1117/12.878248 PSISDG 0277-786X Google Scholar
M. R. Antonelli et al.,
“Mueller matrix imaging of human colon tissue for cancer diagnostics: how Monte Carlo modeling can help in the interpretation of experimental data,”
Opt. Express, 18
(10), 10200
–10208
(2010). http://dx.doi.org/10.1364/OE.18.010200 OPEXFF 1094-4087 Google Scholar
M. R. Antonelli et al.,
“Impact of model parameters on Monte Carlo simulations of backscattering Mueller matrix images of colon tissue,”
Biomed. Opt. Express, 2
(7), 1836
–1851
(2011). http://dx.doi.org/10.1364/BOE.2.001836 BOEICL 2156-7085 Google Scholar
R. Ossikovski et al.,
“Experimental implementation and properties of Stokes nondiagonalizable depolarizing Mueller matrices,”
Opt. Lett., 34
(7), 974
–976
(2009). http://dx.doi.org/10.1364/OL.34.000974 OPLEDP 0146-9592 Google Scholar
C. Fallet et al.,
“Experimental validation of the symmetric decomposition of Mueller matrices,”
Opt. Express, 18
(2), 831
–842
(2010). http://dx.doi.org/10.1364/OE.18.000831 OPEXFF 1094-4087 Google Scholar
S. Prahl,
“Optical absorption of hemoglobin,”
http://omlc.ogi.edu/spectra/hemoglobin/index.html Google Scholar
S. Morgan and M. E. Ridgway,
“Polarization properties of light backscattered from a two layer scattering medium,”
Opt. Express, 7
(12), 395
–402
(2000). http://dx.doi.org/10.1364/OE.7.000395 OPEXFF 1094-4087 Google Scholar
|