|
|
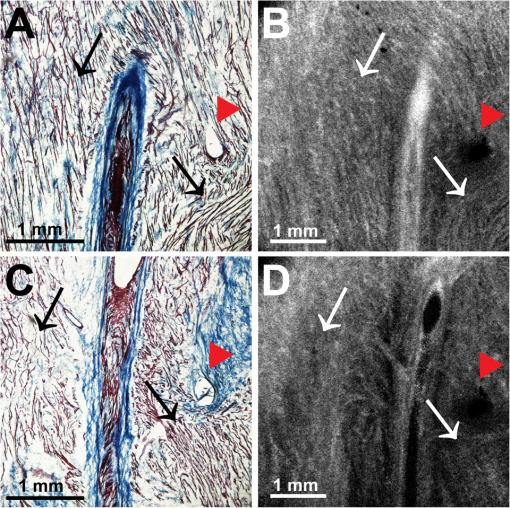
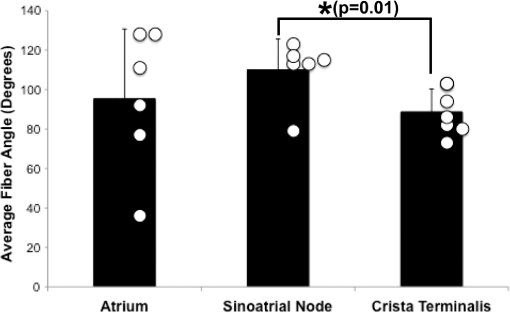
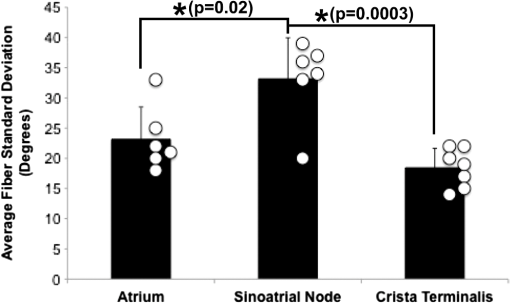
1.IntroductionThe sinoatrial node (SAN) is a complex, heterogenous structure located in the upper, posterior region of the right atrium (RA) responsible for initiating cardiac impulses during normal conduction. Structural investigations of the SAN have revealed it to be a diffuse, cigar-shaped structure extending between the superior and inferior vena cavae,1 and electrically isolated from the remaining bulk of atrial tissue.2–4 The location of the leading pacemaker within the larger SAN is highly variable and can be affected by both vagal tone and changes in extracellular ion concentrations.5,6 Early experiments investigating the mechanism of impulse formation and propagation through the SAN have pointed to the presence of discrete exit pathways,7,8 which have more recently been functionally and anatomically identified in both the canine and human SAN.9,10 Atrial arrhythmias, such as flutter and fibrillation, have been shown to involve both the SAN and its exit pathways.11 These arrhythmias can be diagnosed during routine electrophysiology studies and potentially eradicated by catheter ablation procedures. Successful procedural outcomes oftentimes depend on the precise in situ identification of the atrial pacemaker complex, as well as normal/abnormal atrial myocardium. Current clinical anatomical visualization techniques, including magnetic resonance imaging (MRI), computed tomography (CT), and ultrasound, deliver relatively low spatial resolutions and cannot be performed in real time during electrophysiology procedures. Optical coherence tomography (OCT), on the other hand, is an imaging technique, allowing for the visualization of micron-scale structures within nontransparent biological tissues, with resolutions ranging from submicrometer through 15 μm.12,13 Despite OCT’s high spatial resolution, however, it is currently limited by its depth penetration, estimated to be 2 to 3 mm in biological tissues13 and recently shown to be 1 to 2 mm in human cardiac tissue.14 Furthermore, OCT can be used in situ for real-time, high-resolution visualization of cardiac structures with catheter-based imaging systems.15,16 The use of OCT in visualizing components of the human heart vital to both normal and abnormal conduction, including high-resolution identification of the SAN, was evaluated in our recent study.14 Additional previous studies have shown the utility of OCT in imaging components of the conduction system in both rabbit17,18 and human hearts.14 We have also explored the relationship between structure, imaged using OCT, and function, visualized using optical mapping, in the rabbit SAN.19 The rabbit SAN, however, is essentially a two-dimensional structure,20 as opposed to the three-dimensional canine7,9 and human10,21 SANs. In this study, we aimed to apply ex vivo OCT imaging to canine SANs, which had been functionally characterized via optical mapping as published in our previous study.9 Furthermore, we aimed to structurally identify elements of the atrial pacemaker complex, including nodal tissue and exit pathways, in addition to quantifying local fiber orientation in these areas important in the generation and maintenance of both normal and abnormal cardiac conduction. 2.Materials and Methods2.1.Experimental PreparationThe experimental protocol was approved by the Institutional Animal Care and Use Committee of Washington University. Canine right atrial preparations () were initially isolated and functionally characterized via optical mapping with a voltage-sensitive dye. Functional data describing the activation of the SAN and the presence of discrete exit pathways was published in our previous study.9 Immediately after the optical mapping experiment, the tissue preparations were perfused and fixed with 3.7% formaldehyde overnight and then transferred to 20% sucrose for 2 days. Specimens were dissected to include the right atrial appendage (RAA), crista terminalis (CT), and 2 to 3 cm of tissue beyond the CT, where the SAN is located.6,22 The tissues were photographed and clearly marked with pins to correlate OCT images with corresponding structural and functional datasets. It should be noted that the seven preparations imaged via OCT in this study were initially optically mapped and the electrophysiological results published earlier.9 2.2.OCT ImagingThe basics of our OCT system have been described previously.14,19,23 In short, we imaged each specimen () in overlapping segments from the endocardial surface, with final axial and lateral resolutions of 10 μm (in air). 2.3.Histology and ImmunohistochemistryAfter imaging, tissue specimens () were embedded and frozen in Tissue-Tek® OCT compound (Electron Microscopy Sciences, Hatfield, PA) and stored at . The tissues were then cryosectioned at 16 μm (, parallel to endocardium; , perpendicular to endocardium) and mounted on Superfrost Plus glass slides (Fisher Scientific). Sister sections were then stained using either Masson trichrome (IMEB, San Marcos, CA) or antibodies for the gap junctional protein connexin 43 (Sigma-Aldrich, St. Louis, MO), the cardiac myocyte marker--actinin (Sigma-Aldrich, St. Louis, MO), and the fibroblast marker vimentin (Progen Biotechnik, Heidelberg, Germany), as described previously.9,24 Imaging of both histology and immunohistochemistry was performed on a Nikon C1/80i confocal microscope with an attached AxioCam MRc5 brightfield camera (Carl Zeiss). 2.4.OCT Image Processing and AnalysisOCT images were processed using MATLAB (Mathworks), as described previously.14 Individual OCT images were acquired six times, and then averaged to reduce background noise. Median filtering was also performed with a smoothing kernel to further diminish speckle noise. Custom-designed analysis programs were developed in MATLAB for virtual tissue slicing in order to visualize fiber orientation in relation to the tissue surface,19 as well as to quantify the depth of OCT imaging.14 Quantification of 2D fiber orientation was performed using an automated gradient-based algorithm developed and validated in cardiac tissue.25 In short, this method initially calculated the local gradient of each pixel the image of interest. Then, within a small local window of the larger image, the dominant local direction of the gradient was determined. Cardiac fiber angles were assigned perpendicular to this gradient. Areas of interest from which fiber orientation was assessed included the CT, atrial myocardium, SAN, block zone, and exit pathway(s). These areas were identified via a combination of histology, immunohistochemistry, and functional datasets. The SAN, however, was only identifiable in six out of seven hearts imaged via OCT. Quantitative data are expressed as . A Student’s -test was used to determine statistical significance. A -value of was considered statistically significant. 3.Results3.1.Identification of the Atrial Pacemaker ComplexOCT imaging of the canine atrial pacemaker complex achieved an average depth penetration of from the endocardial surface across all specimens. The approximate thickness of tissue incorporating and surrounding the atrial pacemaker complex was 2 to 3 mm. Although the SAN is defined as a primarily subepicardial structure,2 inferior portions of the node are located closer to the endocardial surface bringing them within range for OCT.10 Consequently, although OCT could not consistently image throughout the entire thickness of tissue in the area of the SAN, the depth penetration was such that key components of the atrial pacemaker complex could be visualized. OCT failed, however, at identifying nodal tissue in one heart out of seven total imaged. The initial functional and structural identification of the atrial pacemaker complex was achieved through the merging of several data sets as shown in Fig. 1. The primary field of view for all imaging modalities encompassed tissue ranging from the crista terminalis (CT) to the interatrial septum (IAS) [Fig. 1(a)], which incorporated both nodal tissue and normal atrial myocardium into each data set. Optical mapping revealed the location of the primary pacemaker [Fig. 1(b)], the block zone, and two (or more) exit pathways from the SAN.9 In addition, both histology [Fig. 1(c)] and immunofluorescent labeling for connexin 43 [Fig. 1(d)] pinpointed the location of the SAN, as distinguished from surrounding normal atrial myocardium. Fig. 1Identification of the atrial pacemaker complex. (a) Photograph of a typical SA nodal preparation as viewed from the endocardium with relevant structures labeled. (b) Typical atrial activation map of normal sinus rhythm from the same SAN preparation as shown in panel A. The white ellipsoid represents the area of earliest activation of the atria. (c) Typical histology slide of the SAN with its approximate borders outlined by the dotted black line. (d) Typical immunofluorescent slide of the SAN with its approximate border outlined by the dotted white line. Connexin 43 is absent within the borders of the SAN. Abbreviations: SAN, sinoatrial node; SVC, superior vena cava; IVC, inferior vena cava; RAA, right atrial appendage; IAS, interatrial septum; Cx43, connexin 43. Modified and reproduced with permission from Fedorov, et al. Structural and functional evidence for discrete exit pathways that connect the canine sinoatrial node and atria. Circ Res. 104(7), 915-923 (2009).  Resolution-wise, OCT is comparable to conventional histological analyses,12–14 which allows for the direct comparison of both techniques in identifying structures within the myocardium. Figure 2 illustrates this concept from two overlying fields of view. The images shown in Fig. 2(a) and 2(b) are located approximately 0.44 mm below the endocardial surface, whereas those images shown in Fig. 2(c) and 2(d) are located at a depth of approximately 0.69 mm. Major identifying structures, such as the sinus node artery and a pinhole (as indicated by the red arrowheads), are apparent using both conventional and virtual histology. In addition, abrupt changes in fiber orientation and organization can be identified and confirmed with OCT, as indicated by the arrows in Fig. 2. 3.2.Quantification of Fiber OrientationFiber orientation, as related to impulse propagation in the atrial pacemaker complex, was assessed from three fields of view in each heart. Figure 3 shows typical fiber orientation patterns from areas identified as the crista terminalis, as indicated by the green boxes in Fig. 3(b) and 3(c), and the interatrial septum, as indicated by the blue boxes in Fig. 3(d) and 3(e), at two depths (0.17 and 0.49 mm) below the endocardial tissue surface. As is evident in the OCT images, these areas of tissue exhibit strong unidirectional fiber orientation with dominant fiber angles of and as measured in the crista terminalis and interatrial septum, respectively. Fig. 3Identification of the crista terminalis and interatrial septum with OCT. (a) Photograph of an SA nodal preparation as viewed from the endocardium with the OCT fields of view for the CT and IAS identified by the green and blue boxes, respectively. OCT images of the unidirectional fiber orientation of the CT and IAS 0.17 mm (b and d) and 0.49 mm (c and e) below the endocardium. Abbreviations: SVC, superior vena cava; IVC, inferior vena cava; RAA, right atrial appendage; CT, crista terminalis; IAS, interatrial septum. 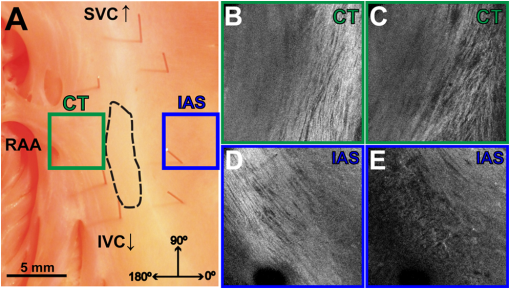 OCT fields of view encompassing nodal tissue, on the other hand, exhibit very different orientation patterns as shown in Fig. 4 and Video 1. Initially, immediately under the endocardial tissue surface [Fig. 4(b), ], there is a tendency for a strong unidirectional fiber orientation with a dominant angle of , similar to the interatrial septum. As the field of view progresses from the endocardium towards the epicardium and through nodal tissue, the cardiac fibers display an increased amount of disarray as shown in Fig. 4(e) through 4(g). This fiber disarray is representative of SA nodal tissue, which propagates impulses at slower conduction velocities than normal atrial myocardium.4,9 Fig. 4Identification of the sinoatrial node with OCT. (a) Photograph of an SA nodal preparation as viewed from the endocardium with the OCT field of view for the SAN identified by the white box. OCT images (Video 1, MOV, 6.1 MB) [URL: http://dx.doi.org/10.1117/1.JBO.17.7.071309.1] of the fiber orientation are shown at (b) 0.17 mm, (c) 0.24 mm, (d) 0.3 mm, (e) 0.36 mm, (f) 0.42 mm, and (g) 0.49 mm below the endocardium. 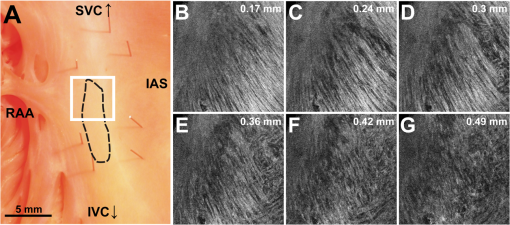 Specific fiber orientation analyses, as shown in Fig. 5 in a single preparation, illustrate the changing orientation and fiber angle distributions in the CT, endocardial atrial layer above the SAN, and the SAN itself. Both the CT and endocardial atrial tissue layers exhibit strong unidirectional fiber orientations with dominant angles centered around 69 deg and 130 deg as shown in Fig. 5(a) through 5(f). Nodal tissue, as verified via standard histology and immunohistochemistry, exhibits a higher degree of fiber disarray as reflected in a wider range of fiber angles (), as shown in Fig. 5(g) through 5(i). Overall average fiber orientation among all preparations, as summarized in Fig. 6, was consistent across samples within the CT (), however, the endocardial atrial layer located above the SAN exhibited a wide range of dominant fiber angles (36 to 128 deg) between specimens. Within each specimen there was still a strong tendency for the endocardial atrial layer above the SAN to exhibit unidirectional fiber orientation as in Fig. 5(d) through 5(f). The overall average angle of the SAN itself was relatively consistent among the specimens at , however each individual specimen did exhibit a high degree of fiber disarray within the node, such as that illustrated in Fig. 5(g) through 5(i). The amount of fiber disarray was evaluated based on the standard deviation of angles within each structure (CT, endocardial atrial layer, and SAN) as shown in Fig. 7 among all preparations. Overall, the SAN demonstrated significantly higher standard deviations () than both the endocardial atrial layer (, ) and the CT (, ) indicative its higher degree of fiber disarray. Fig. 5Fiber angle distribution in the crista terminalis, atrium, and sinoatrial node in a single preparation. (a) OCT image of cardiac fibers in the CT. (b) Assigned fiber angle vectors in the CT at a depth of 0.43 mm. (c) Distribution of fiber angles in the CT with an average dominant angle of . (d) OCT image of cardiac fibers in normal atrial myocardium located endocardial to the SAN at a depth of 0.17 mm. (e) Assigned fiber angle vectors in normal atrial myocardium. (f) Distribution of fiber angles in the atrium with an average dominant angle of . (g) OCT image of cardiac fibers in the SAN at a depth of 0.49 mm. (h) Assigned fiber angle vectors in the SAN. (I) Distribution of fiber angles in the SAN with an average dominant angle of . 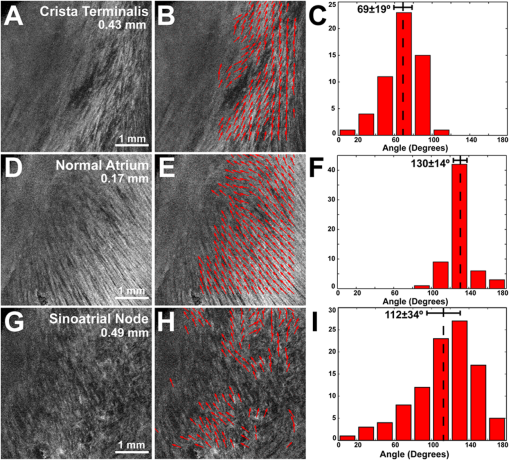 3.3.Additional Identifiable Features of the Atrial Pacemaker ComplexIn addition to evaluating fiber orientation in the CT, endocardial atrium, and SAN, fibers were also identified with unique orientation patterns in the block zone26 as shown in Fig. 8 and Video 2. The bright white area, as indicated by the white arrow in Fig. 8(c), most likely contributes to the functional block zone, as shown in Fig. 8(a). The pattern of fibers indicated by the red arrow in Fig. 8(e) appear to “dead-end” in the block zone. Consequently, an impulse originating from the SAN would not be able to traverse these fibers and would instead have to bypass the block zone, as indicated by the dotted white line in Fig. 8(e), in order to excite the remaining bulk of atrial tissue. Fig. 8Identification of the block zone with OCT. (a) Photograph of an SA nodal preparation as viewed from the endocardium with the OCT field of view for the SA nodal block zone identified by the white box. OCT images of the fiber orientation are shown at (b) 0.07 mm, (c) 0.12 mm, (d) 0.18 mm, (e) 0.24 mm, (f) 0.32 mm, and (g) 0.42 mm below the endocardium. The white arrow in (c) indicates the probable anatomic correlate of the functional block zone. The dotted white lines indicate the pathways for impulse propagation around the block zone. The red arrow indicates fibers that “dead-end” in the functional block zone. Abbreviations: SVC, superior vena cava; IVC, inferior vena cava; RAA, right atrial appendage; IAS, interatrial septum. (Video 2, MOV, 5.9 MB) [URL: http://dx.doi.org/10.1117/1.JBO.17.7.071309.2] 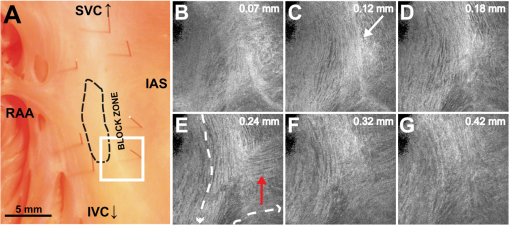 4.DiscussionIt is well known that cardiac function is intimately linked to underlying tissue structure. In this study, we had the distinct advantage of performing structurally based imaging on electrophysiologically characterized preparations. We focused specifically on the structure-function relationship in the canine SAN with particular emphasis on fiber orientations patterns as they relate to SA nodal conduction. Our previous functional study demonstrated the presence of the block zone, nodal tissue, and discrete exit pathways in the canine heart.9 In addition, these structures were also identified using more traditional histological and immunohistochemical techniques. Now for the first time, we have demonstrated the existence of these structures using a nondestructive imaging modality. We have identified unique fiber orientation patterns specific to the CT (Fig. 3), SAN (Fig. 4), atrial myocardium (Figs. 3 and 4), and block zone (Fig. 8). In addition, we quantified fiber orientation distributions, using an automated gradient-based algorithm,25 in these areas (Fig. 5). We found that the CT and atrial myocardium tended to display unidirectionally based fiber orientations, whereas the SAN exhibited an increased amount of fiber disarray manifested as a significantly greater standard deviation (Fig. 7). Although we were unsuccessful in concretely identifying the exit pathways using OCT, we believe their presence may be masked by surrounding fibers with similar orientation patterns. We were, most importantly, able to distinguish SA nodal tissue from the surrounding atrial myocardium (Figs. 4, 5, and 7). In addition to being a key component of normal cardiac conduction, the atrial pacemaker complex, consisting of the SAN, block zone, exit pathway(s), and surrounding atrial myocardium, has also been shown to be involved in arrhythmias, such as atrial flutter and fibrillation.9,11 These arrhythmias are oftentimes associated with SA nodal dysfunction8 and, more importantly, are accompanied by both functional and structural changes in the SAN.27 Structural changes, such as alterations in interstitial fibrosis,28 within the SAN could potentially be monitored with high spatial resolution over time with OCT, as an indicator of disease progression. In addition, an increased amount of fibrosis or abrupt changes in fiber orientation patterns may result in a higher propensity for reentrant arrhythmias.29 Recently, it has been suggested that there is a unique structure running parallel to the human sinoatrial node termed the paranodal area.30,31 This region was shown to have unique molecular and histological characteristics in the human heart, with properties intermediate between the SAN and normal right atrial myocardium. In our study, we were unable to identify this area in the canine heart using both traditional histology and OCT, despite the functional similarities we have found between the human and canine SA nodes.9,10 The identification of the paranodal area in the human heart via OCT still remains to be explored. OCT is a nondestructive imaging technique with superior spatial resolution as compared to other anatomical visualization and reconstruction techniques.12,13 Most importantly, OCT can be miniaturized into a catheter-based imaging system15,16 to be threaded through the vasculature and into the cardiac chambers. In this way, physicians can directly relate, in real time and in situ, cardiac function to its underlying structure during electrophysiology studies and ablation procedures. In addition, the continued development of automated visualization and analysis tools19,25 for OCT will only serve to power its movement into mainstream cardiology. 5.ConclusionWe have demonstrated the ability of OCT in detecting components of the atrial pacemaker complex, which are intimately involved in both normal and abnormal cardiac conduction. We identified and quantified unique fiber orientation patterns specific to the CT, SAN, atrial myocardium, and block zone using an automated gradient-based algorithm. Based on this study, we believe OCT is continuing to emerge as a key imaging modality with the potential to identify, in real time and in situ, structural substrates responsible for both normal and abnormal cardiac conduction. AcknowledgmentsThe authors would like to thank William J. Hucker, MD, PhD, for his early contributions to the OCT imaging and Christine P. Fleming, PhD for her development of the fiber orientation algorithm. Funding sources: The authors would also like to thank the following funding sources: NIH R01 HL085369. Disclosures: None. ReferencesH. Dobrzynskiet al.,
“Computer three-dimensional reconstruction of the sinoatrial node,”
Circulation, 111
(7), 846
–854
(2005). http://dx.doi.org/10.1161/01.CIR.0000152100.04087.DB CIRCAZ 0009-7322 Google Scholar
D. Sanchez-Quintanaet al.,
“Sinus node revisited in the era of electroanatomical mapping and catheter ablation,”
Heart, 91
(2), 189
–194
(2005). http://dx.doi.org/10.1136/hrt.2003.031542 1355-6037 Google Scholar
R. V. OrenC. E. Clancy,
“Determinants of heterogeneity, excitation and conduction in the sinoatrial node: a model study,”
PLoS Comput. Biol., 6
(12), e1001041
(2010). http://dx.doi.org/10.1371/journal.pcbi.1001041 1553-734X Google Scholar
M. R. Boyettet al.,
“Connexins in the sinoatrial and atrioventricular nodes,”
Adv. Cardiol., 42 175
–197
(2006). http://dx.doi.org/10.1159/000092569 ACDYB2 Google Scholar
V. V. Fedorovet al.,
“Postganglionic nerve stimulation induces temporal inhibition of excitability in rabbit sinoatrial node,”
Am. J. Physiol. Heart Circ. Physiol., 291
(2), H612
–H623
(2006). http://dx.doi.org/10.1152/ajpheart.00022.2006 0363-6135 Google Scholar
O. Monfrediet al.,
“The anatomy and physiology of the sinoatrial node—a contemporary review,”
Pacing Clin. Electrophysiol., 33
(11), 1392
–1406
(2010). http://dx.doi.org/10.1111/j.1540-8159.2010.02838.x Google Scholar
B. I. Bromberget al.,
“Primary negativity does not predict dominant pacemaker location: implications for sinoatrial conduction,”
Am. J. Physiol., 269
(3 Pt. 2), H877
–H887
(1995). AJPHAP 0002-9513 Google Scholar
R. B. Schuessler,
“Abnormal sinus node function in clinical arrhythmias,”
J. Cardiovasc. Electrophysiol., 14
(2), 215
–217
(2003). http://dx.doi.org/10.1046/j.1540-8167.2003.02229.x JCELE2 1045-3873 Google Scholar
V. V. Fedorovet al.,
“Structural and functional evidence for discrete exit pathways that connect the canine sinoatrial node and atria,”
Circ. Res., 104
(7), 915
–923
(2009). http://dx.doi.org/10.1161/CIRCRESAHA.108.193193 CIRUAL 0009-7330 Google Scholar
V. V. Fedorovet al.,
“Optical mapping of the isolated coronary-perfused human sinus node,”
J. Am. Coll. Cardiol., 56
(17), 1386
–1394
(2010). http://dx.doi.org/10.1016/j.jacc.2010.03.098 JACCDI 0735-1097 Google Scholar
V. V. Fedorovet al.,
“Complex interactions between the sinoatrial node and atrium during reentrant arrhythmias in the canine heart,”
Circulation, 122
(8), 782
–789
(2010). http://dx.doi.org/10.1161/CIRCULATIONAHA.109.935288 CIRCAZ 0009-7322 Google Scholar
B. Povazayet al.,
“Submicrometer axial resolution optical coherence tomography,”
Opt. Lett., 27
(20), 1800
–1802
(2002). http://dx.doi.org/10.1364/OL.27.001800 OPLEDP 0146-9592 Google Scholar
J. G. Fujimoto,
“Optical coherence tomography for ultrahigh resolution in vivo imaging,”
Nat. Biotechnol., 21
(11), 1361
–1367
(2003). http://dx.doi.org/10.1038/nbt892 NABIF9 1087-0156 Google Scholar
C. M. Ambrosiet al.,
“Virtual histology of the human heart using optical coherence tomography,”
J. Biomed. Opt., 14
(5), 054002
(2009). http://dx.doi.org/10.1117/1.3213604 JBOPFO 1083-3668 Google Scholar
G. J. Tearneyet al.,
“Images in cardiovascular medicine. Catheter-based optical imaging of a human coronary artery,”
Circulation, 94
(11), 3013
(1996). CIRCAZ 0009-7322 Google Scholar
C. P. Fleminget al.,
“Real-time monitoring of cardiac radio-frequency ablation lesion formation using an optical coherence tomography forward-imaging catheter,”
J. Biomed. Opt., 15
(3), 030516
(2010). http://dx.doi.org/10.1117/1.3459134 JBOPFO 1083-3668 Google Scholar
M. Jenkinset al.,
“Optical coherence tomography imaging of the purkinje network,”
J. Cardiovasc. Electrophysiol., 16
(5), 559
–560
(2005). http://dx.doi.org/10.1046/j.1540-8167.2005.30621.x JCELE2 1045-3873 Google Scholar
M. Guptaet al.,
“Imaging of the atrioventricular node using optical coherence tomography,”
J. Cardiovasc. Electrophysiol., 13
(1), 95
(2002). http://dx.doi.org/10.1046/j.1540-8167.2002.00095.x JCELE2 1045-3873 Google Scholar
W. J. Huckeret al.,
“Bimodal biophotonic imaging of the structure—function relationship in cardiac tissue,”
J. Biomed. Opt., 13
(5), 054012
(2008). http://dx.doi.org/10.1117/1.2975826 JBOPFO 1083-3668 Google Scholar
W. K. Bleekeret al.,
“Functional and morphological organization of the rabbit sinus node,”
Circ. Res., 46
(1), 11
–22
(1980). http://dx.doi.org/10.1161/01.RES.46.1.11 CIRUAL 0009-7330 Google Scholar
J. P. Boineauet al.,
“Demonstration of a widely distributed atrial pacemaker complex in the human heart,”
Circulation, 77
(6), 1221
–1237
(1988). http://dx.doi.org/10.1161/01.CIR.77.6.1221 CIRCAZ 0009-7322 Google Scholar
T. N. James,
“Anatomy of the sinus node of the dog,”
Anat. Rec., 143 251
–265
(1962). http://dx.doi.org/10.1002/(ISSN)1097-0185 ANREAK 0003-276X Google Scholar
Z. HuA. Rollins,
“Quasi-telecentric optical design of a microscope-compatible OCT scanner,”
Opt. Express, 13
(17), 6407
–6415
(2005). http://dx.doi.org/10.1364/OPEX.13.006407 OPEXFF 1094-4087 Google Scholar
W. J. Huckeret al.,
“Connexin 43 expression delineates two discrete pathways in the human atrioventricular junction,”
Anat. Rec. (Hoboken), 291
(2), 204
–215
(2008). http://dx.doi.org/10.1002/ar.20631 Google Scholar
C. P. Fleminget al.,
“Quantification of cardiac fiber orientation using optical coherence tomography,”
J. Biomed. Opt., 13
(3), 030505
(2008). http://dx.doi.org/10.1117/1.2937470 JBOPFO 1083-3668 Google Scholar
M. R. BoyettH. HonjoI. Kodama,
“The sinoatrial node, a heterogeneous pacemaker structure,”
Cardiovasc. Res., 47
(4), 658
–687
(2000). http://dx.doi.org/10.1016/S0008-6363(00)00135-8 CVREAU 0008-6363 Google Scholar
P. Sanderset al.,
“Electrophysiological and electroanatomic characterization of the atria in sinus node disease: evidence of diffuse atrial remodeling,”
Circulation, 109
(12), 1514
–1522
(2004). http://dx.doi.org/10.1161/01.CIR.0000121734.47409.AA CIRCAZ 0009-7322 Google Scholar
J. Ausmaet al.,
“Structural changes of atrial myocardium due to sustained atrial fibrillation in the goat,”
Circulation, 96
(9), 3157
–3163
(1997). CIRCAZ 0009-7322 Google Scholar
M. Valderrabanoet al.,
“Dynamics of intramural and transmural reentry during ventricular fibrillation in isolated swine ventricles,”
Circ. Res., 88
(8), 839
–848
(2001). http://dx.doi.org/10.1161/hh0801.089259 CIRUAL 0009-7330 Google Scholar
N. J. Chandleret al.,
“Molecular architecture of the human sinus node: insights into the function of the cardiac pacemaker,”
Circulation, 119
(12), 1562
–1575
(2009). http://dx.doi.org/10.1161/CIRCULATIONAHA.108.804369 CIRCAZ 0009-7322 Google Scholar
N. Chandleret al.,
“Computer three-dimensional anatomical reconstruction of the human sinus node and a novel paranodal area,”
Anat. Rec. (Hoboken), 294
(6), 970
–979
(2011). http://dx.doi.org/10.1002/ar.21379 Google Scholar
|

