
|
|
1.IntroductionNear-infrared spectroscopy (NIRS) is a neuroimaging technique that allows real-time monitoring of cortical changes in the levels of oxyhemoglobin (), deoxyhemoglobin (Hb), and total hemoglobin (HbT) in response to various tasks.1,2 Recently, several researchers3–5 have assessed whether NIRS can detect the actual cortical hemodynamic changes associated with neural activation in response to tasks by using NIRS in combination with other methods, such as magnetoencephalography (MEG), transcranial magnetic stimulation (TMS), and electroencephalograms (EEG). Although the results of these studies showed good concordance between NIRS data and those of other modalities, most did not show either short-time or intrinsic (without stimulation) neurohemodynamic processes. In addition, activation was induced by task blocks or by direct nerve stimulation. However, a study of event-related activations is more appropriate because a short-duration reaction and a specific cortical response can be elicited by voluntary cognitive processes. Event-related studies using NIRS have been reported.6,7 Electrophysiologically, movement-related cortical potentials (MRCP) have been studied in order to elucidate the neural activation involved in processes ranging from motor preparation to motor initiation with voluntary movement.8–10 Moreover, several investigators have used MRCP combined with functional magnetic resonance imaging (fMRI),11,12 TMS11 and positron emission tomography (PET),13 to evaluate the localization of MRCP. Those studies demonstrated that motor association areas—such as the supplementary motor area (SMA), premotor cortex (PMC), and sensorimotor cortex (SMC)—are activated with MRCP generators. However, the detailed reciprocal relationships between these motor association areas and the primary motor cortex remain uncertain. In PET and fMRI studies, it has been difficult to examine real-time cortical activation during the entire time span from motor preparation to motor execution. However, NIRS is a suitable method for real-time recording, and it can be conducted simultaneously with EEG recording. In the present study, for the first time, we examined motor preparatory and motor executive activation elicited by a simple and completely voluntary pinch task and compared the NIRS data with simultaneously recorded MRCPs. Furthermore, we endeavored to apply the technique of stereotactically superimposing NIRS images upon the subject’s three-dimensional (3-D) magnetic resonance images in order to obtain more detailed spatial information. 2.Materials and Methods2.1.SubjectsSix healthy male volunteers [age (), ] participated in the present study. According to the Edinburgh Inventory,14 all were right-handed. Informed consent was obtained from each subject before the experiment. All investigations were in accordance with the latest version of the Declaration of Helsinki and were approved by the Institutional Review Board of the Niigata University School of Medicine. 2.2.Motor TaskIn a dimmed room, subjects were seated in a comfortable chair with their arms on the armrests. They faced the monitor, which presented a fixation cross at a distance of approximately 90 cm. A device, which counted the number of pinching movements and sent specific signals to the NIRS system, was placed at the end of the right armrest (Fig. 1). Subjects were instructed to make a simple right thumb-index finger pinch of this device every 10 s at their own pace. In order to minimize possible artifacts, they were asked to stare at the fixation cross on the screen and not count the number of pinching movements during the entire session. After 100 samples had been stored, the session was ended. The total testing time was about 17 min. Fig. 1Photograph of a custom-made trigger counter and two electrodes on the right first dorsal interosseus muscle used for electromyogram (EMG) recording. When a subject performs a simple pinch task, the number of pinching movements is detected by the counter, and an EMG input is triggered for near-infrared spectroscopy (NIRS) and the movement-related cortical potentials (MRCP) measurement system.  2.3.MRCP Data AcquisitionEEG signals were recorded using electrodes at Fz, Cz, C3, and C4, according to the International 10–20 system, with the left ear used as reference, and the forehead as ground [Fig. 2(a)]. EMGs associated with pinch movements were recorded with two electrodes placed on the first dorsal interosseus muscle of the right hand, and the signals for both the NIRS and the MRCP measurement system were triggered (Fig. 1). All data were digitized on-line at a rate of 500 Hz. The time constants for the EEG and EMG recordings were 3 and 0.03 s, respectively. The high-frequency filters for the EEG and EMG recordings were 70 and 1000 Hz, respectively. In all channels, a 50 Hz notch filter was applied. Fig. 2(a) Placement of the bilateral probe sets and electroencephalography (EEG) electrodes at Fz, Cz, C3, and C4 was in accordance with the International 10–20 system. The NIRS probes, which are separated from each other by 3 cm, are positioned over the bilateral motor cortex and motor association cortex. Fz, Cz, and C3 indicate the positions of EEG electrodes (the C4 electrode was also placed in the left hemisphere). (b) Schema of NIRS probes and EEG electrodes. The bilateral probe sets, positioned as channel numbers 18 and 42, are placed symmetrically beside Cz since C3 and C4 were enclosed by channel numbers 16, 19, 20, and 23 and numbers 40, 43, 44, and 47, respectively. The region of interest (ROI) is shaded gray: prefrontal cortex (PFC), dorsal premotor cortex (dPMC), and the hand area of the sensorimotor cortex (SMC). (c) Top view of 3-D brain cortex in subject 1, with the position of the probes on the brain (red dots: emitters; blue dots: detectors). PMC, dPMC, and the hand area of SMC were bilaterally covered by the placed probes. ROIs were set for PFC (channels 4, 5, 28, and 29), dPMC (channels 11, 12, 35, and 36), and the hand area of SMC (channels 16, 19, 20, 23, 40, 43, 44, and 47) as shown in (b).  2.4.MRCP Data AnalysisFor MRCP data analysis, the EEG recording was segmented into epochs from 1600 ms before EMG onset to 1500 ms after EMG onset. All movement trials were assessed by the interval time, the quantitative evaluation of the EMG, and other artifacts. Based on previous studies, it is well known that the hemodynamic response to a brief period of neural activation typically peaks 4 or 5 s after the neural response. Taking this into account, we planned to analyze the period ranging from to after EMG onset for the NIRS data analysis. Therefore, when the interval was under 9 s, the epochs were removed. The same procedure was applied if the EMG recording was unsuitable (e.g., very low amplitude or lacking a single movement). Finally, artifact-free epochs were averaged according to EMG onset with a baseline calculated from 2000 ms to 1600 ms before EMG onset. 2.5.NIRS Data AcquisitionThe standard method for NIRS has been described in detail elsewhere.2,6 NIRS was carried out with a spectrometer (ETG-4100; Hitachi Medical Corporation, Japan), using probe sets (24 channels for each hemisphere). The inter-probe distance was 3 cm, and NIRS signals were recorded at a sample rate of 10 Hz from all channels. The trigger mark was obtained from the EMG signal as described in the MRCP data acquisition section (Sec. 2.3). 2.6.NIRS Probe Placement ProcedureAs shown in Fig. 2(b), the position of each channel was numbered from 1 to 48. In order to cover the bilateral motor cortex and motor association cortex, the probes were placed symmetrically beside Cz since C3 and C4 were enclosed by channel numbers 16, 19, 20, and 23 and numbers 40, 43, 44, and 47, respectively. Consequently, Fz was placed essentially between channel numbers 4 and 28 in all subjects. In order to confirm the precise positions of the probes, we demonstrated a probe-cortex correlation using an appropriate software system (EZT-DM 101/102; Hitachi Medical Corporation, Japan). In this system, the spatial information of each probe on the head surface was first registered. Second, the 3-D head surface image and the 3-D brain image were generated from the subject’s own T1-weighted MRI data (MAGNETOM Verio 3T, Siemens, Germany), using 3-D reconstruction software (ZedView, LEXI, Tokyo, Japan), and each probe position was mapped onto the 3-D head surface image. Finally, probe positions were superimposed onto the subject’s own 3-D brain image [Fig. 2(c)]. In the present study, this procedure was performed in all subjects, and we obtained accurate regional information about hemodynamic responses to neural activation. Figure 2(c) shows that the bilateral prefrontal cortex (PFC), the bilateral dorsal premotor cortex (dPMC), and the bilateral hand area of the SMC were covered by the placement of the probes. According to the results of these processes, the regions of interest (ROIs) were set in all subjects for PFC (channels 4, 5, 28, and 29), dPMC (channels 11, 12, 35, and 36), and the hand area of SMC (channels 16, 19, 20, 23, 40, 43, 44, and 47) within an acceptable structural error range due to variable head or brain shape, as shown in Fig. 2(b). 2.7.NIRS Data AnalysisThe data analysis was performed using a custom-made software program (MATLAB; The Math Works). The epochs that had been removed from the MRCP data analysis were excluded, and the remaining data were filtered by a band-pass filter with a range of 0.08 to 0.75 Hz. The average baseline Hb concentration was calculated for the interval from 2.5 s to 2.0 s before EMG onset, and the concentration changes were analyzed from the pre-movement phase (2.0 s before EMG onset) to the post-movement phase (6.0 s after EMG onset). That is, each period ranged from to after EMG onset. During this interval, the relative concentration changes of , Hb, and HbT were averaged, and the time courses were obtained for each channel. 2.8.Comparison Between MRCP and NIRS DataIn order to evaluate the coupling between electrophysiological neural activity and hemodynamic changes, the averaged waveforms of the MRCPs at Fz, Cz, C3, and C4 and the averaged , Hb, and HbT changes in the bilateral PFC/dPMC and the hand area of the contralateral SMC were obtained. These results allowed time data comparisons between MRCP and NIRS. 3.Results3.1.Behavioral DataThe mean interval between pinch movements was , and the average number of movement trials subjected to analysis was . We excluded 13% of trials (shorter interval, 9%; very low amplitude EMG, 1%; lacking a single movement, 1%; artifacts, 2%). All subjects were cooperative during the entire session. 3.2.MRCP ResultsFigure 3 shows the averaged MRCP waveforms for subject one during the performance of a voluntary right thumb-index finger pinching movement conducted at his own pace. In subject one, the initial slow negativity, known as the Bereitschaftspotential (BP),9 started 1590 ms before EMG onset and peaked 905 ms before EMG onset. Following the BP, the steeper component with a negative slope (),15 occurred 535 ms before EMG onset and terminated 45 ms after EMG onset. Maximal BP was observed at Cz, while maximal was detected at C3. The motor potential (MP),16 following was then recognized mainly at C3, and it peaked 125 ms after EMG onset. The averaged MRCP values, including BP, , and MP, were clearly recognizable in subjects two and three, as well as in subject one. The latency and the maximal position of the MRCP components for each subject are presented in Table 1. The maximal BP peak was observed in Cz or Fz, while or MP showed significant maximums mainly at C3 for all subjects. Fig. 3Average MRCP waveforms at Fz, Cz, C3, and C4, and the EMG recording for subject one. The vertical dotted line marks the onset of the EMG burst. The Bereitschaftspotential (BP) was maximal at Cz, while the negative slope () was maximal at C3. The following motor potential (MP) was dominant at C3. Similar results were obtained for all subjects.  Table 1Latency and maximal position of the MRCP components in each subject.
Note: That the latency is expressed as the interval before (indicated by −) or after EMG onset. 3.3.NIRS ResultsThe average changes of , Hb, and HbT compared to baseline for subject one are shown in Fig. 4. In subject 1, the PFC and dPMC were bilaterally and symmetrically activated with similar amplitudes before EMG onset. Following these activations, the hand area of the SMC showed left-dominant activation and a peak after EMG onset. Figure 5 shows the average changes of , Hb, and HbT in each ROI for each subject, and the time to peak for the average changes in each ROI for subjects one, two, and three typical responses. The time to peak for the average changes in each ROI for each subject is presented in Table 2. For all subjects, the PFC and dPMC were bilaterally activated before EMG onset. The cross-correlation coefficient from each subject between the two hemispheres’ NIRS signals ranged from 0.92 to 0.98 in the PFC, and ranged from 0.94 to 0.98 in the dPMC. Thus we averaged the bilateral temporal PFC and dPMC data and considered the averaged data to be identical for the left and right. The peak in the PFC preceded that in the dPMC by 0.1 s or occurred at the same time. The mean peak latency of was before EMG onset in the PFC and before EMG onset in the dPMC. Following these activations, the hand area of the SMC showed left-dominant activation after EMG onset. The topography of the average changes in subject three showed that hemodynamic activation occurred earlier in the bilateral PFC and dPMC than in the hand area of the SMC, with left dominance (Fig. 6). Fig. 4Average changes of , Hb, and HbT compared to baseline in response to a simple right-handed pinching task in subject one. Before EMG onset, the PFC and dPMC were bilaterally and symmetrically activated with similar amplitudes. The hand area of the SMC significantly activated after EMG onset with contralateral dominance. 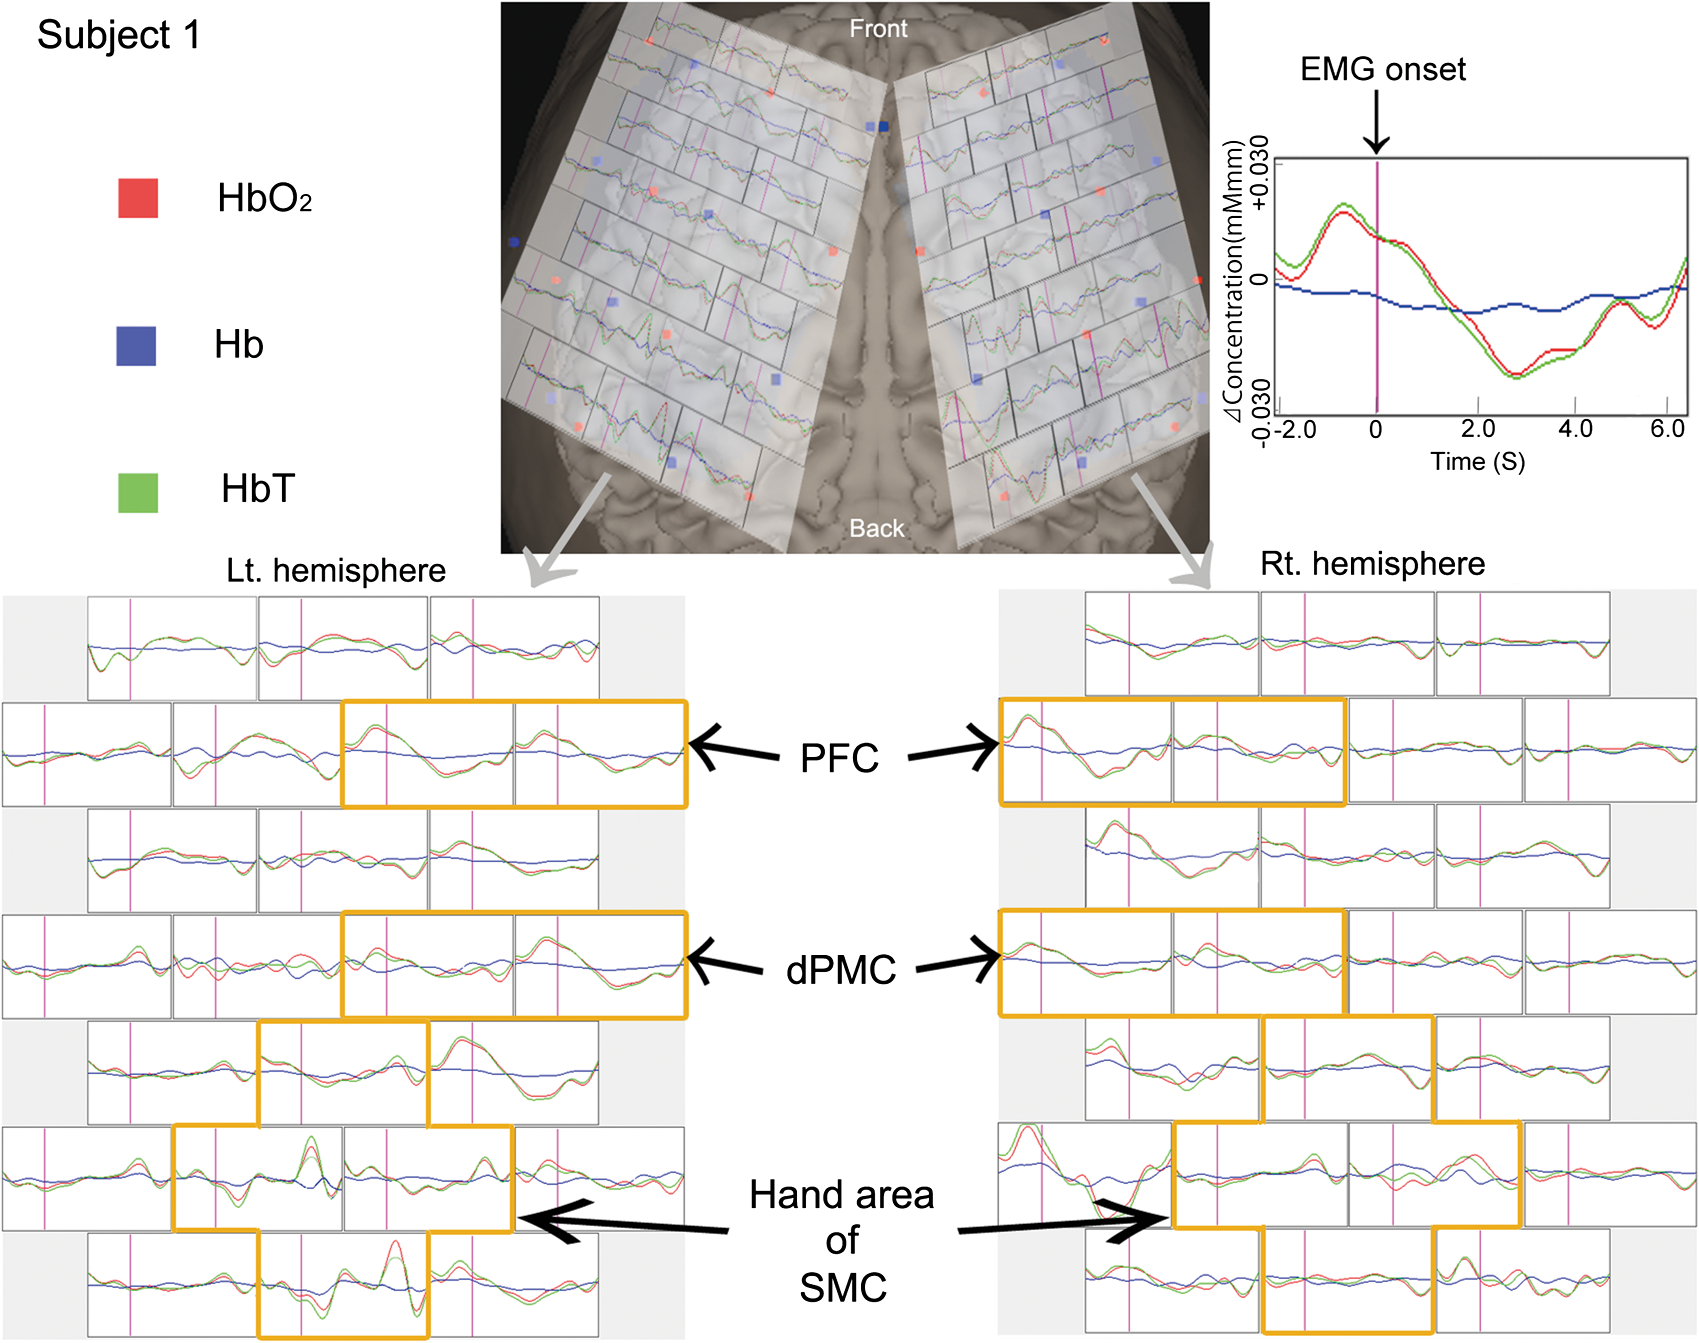 Fig. 5Typical hemodynamic responses in each ROI for each of three individual subjects. For all subjects, PFC and dPMC were bilaterally activated before EMG onset, and the peak time of was the same () for these two regions with similar amplitudes. Following these activations, the hand area of the SMC showed left-dominant activation after EMG onset. The error bars indicate standard errors for and Hb. 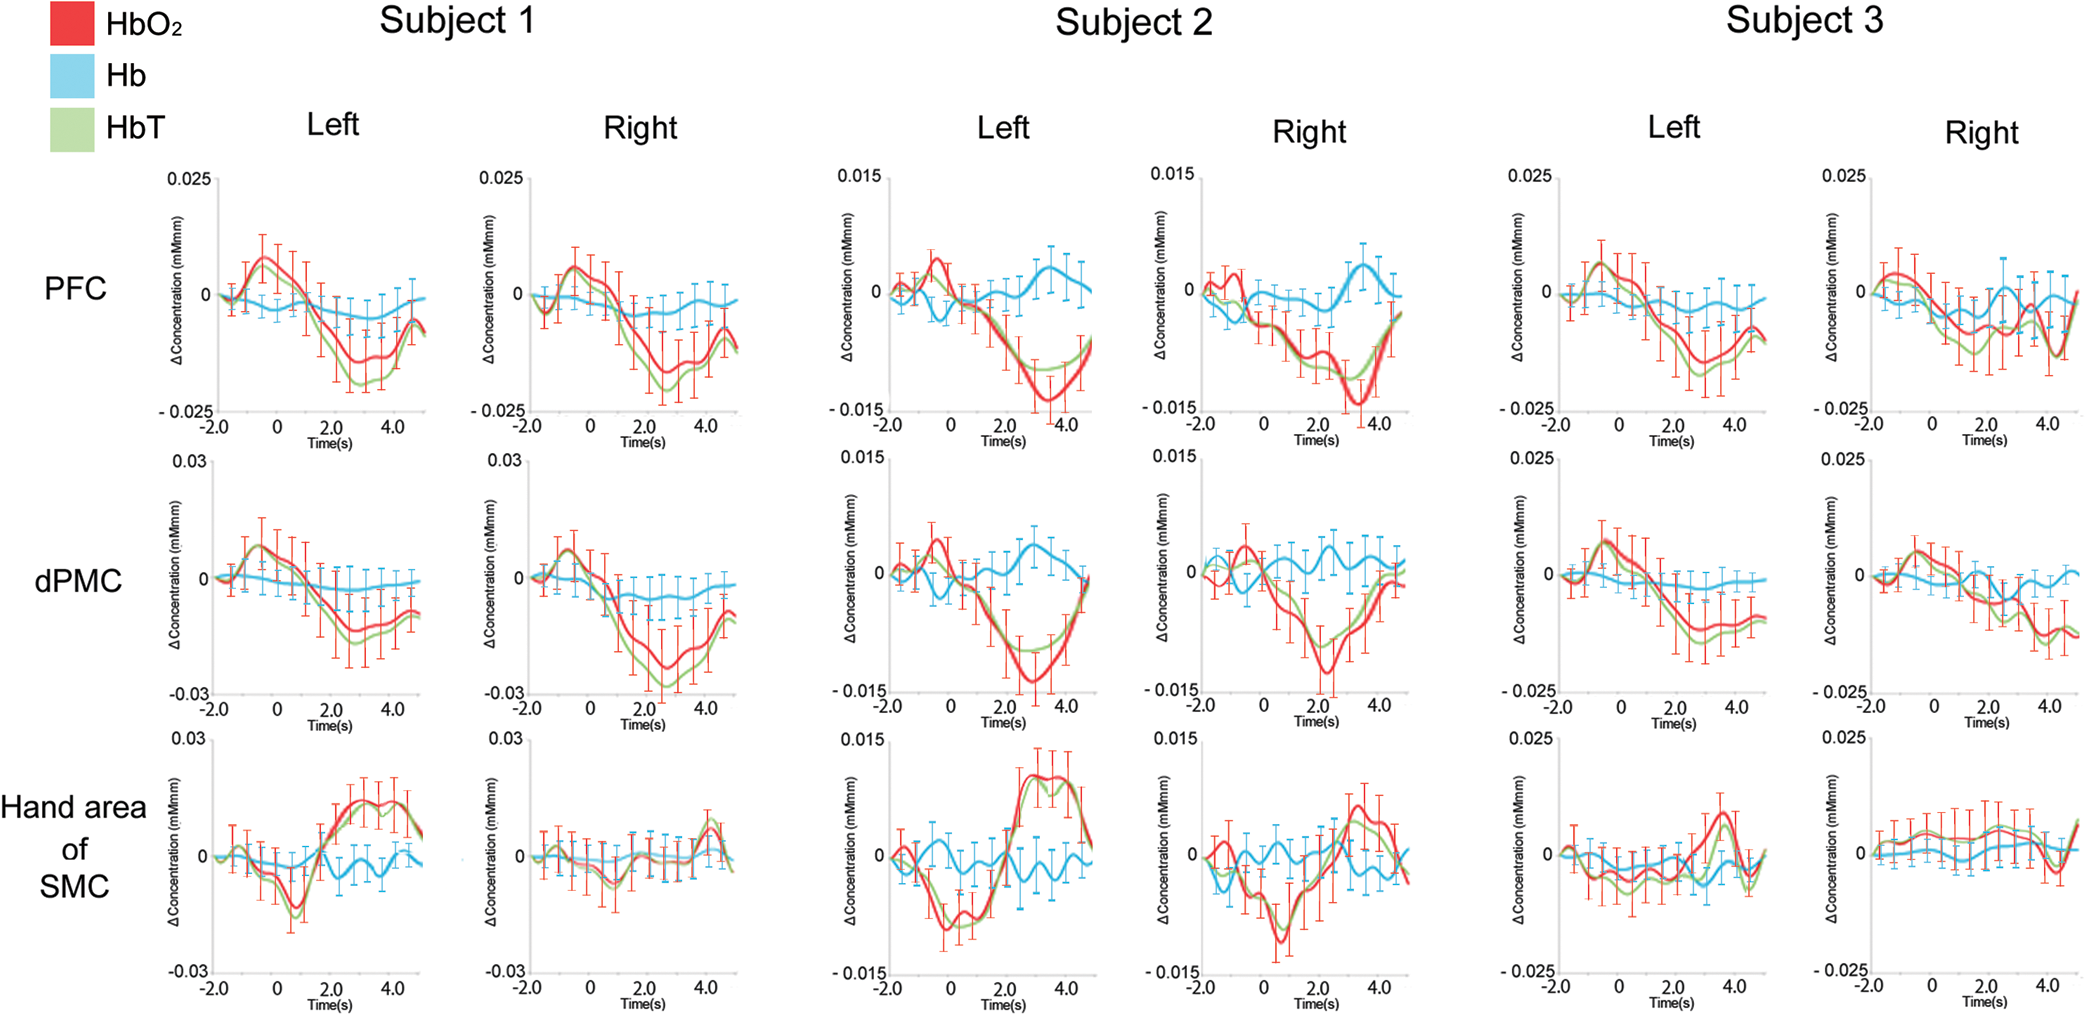 Fig. 6The topography of the averaged changes in subject three. The hemodynamic activation that occurred earlier in the bilateral PFC and dPMC than in the hand area of the SMC showed left-dominance.  Table 2Time to peak of averaged HbO2 Changes for each subject in PFC, dPMC, and the contralateral hand area of SMC.
Note: That the latency is expressed as the interval before (indicated by −) or after EMG onset, and bilateral data in PFC or dPMC are regarded as identical here. 3.4.Results of Comparisons Between MRCP and NIRS DataFigure 7 presents the average time-series waveforms of MRCP and NIRS signals in the PFC, dPMC, and contralateral hand area of the SMC in subject three. Similar results were obtained in the others. For all subjects, the onset of MRCP was followed by the hemodynamic responses. The sources of MRCP were various cortical projection neurons in the motor association areas.17 Thus MRCP may have been contaminated by various active potentials from these regions.15 According to previous MRCP study with MEG,18 the motor field that peaks at EMG onset is present in the bilateral primary motor areas with contralateral dominance, and the movement-evoked field I, which is detected about 0.1 s after EMG onset, is present only in the contralateral somatosensory area. Since both are thought to be counterparts of the MP component of MRCP,19 the MP component in C3 can be regarded as regional potentials mainly in the contralateral SMC. Taking these factors into account, we regarded the peak increase after EMG onset in the hand area of the SMC as the response to neural activation in the same region. Hence, in order to obtain temporal information about the vascular response to neural activity, we measured the peak time of the MP component in C3 (Table 1) and the peak time of changes in the contralateral hand area of the SMC (Table 2) and then calculated their difference for each subject. The difference was on average. Fig. 7Average time-series waveforms of MRCP and changes in the mPFC, mPMC, and the contralateral hand area of the SMC in subject three. The onset of MRCP was followed by hemodynamic responses. The increase after EMG onset in the contralateral hand area of the SMC was regarded as the vascular response to the MP component in C3.  4.DiscussionIn this study, we conducted simultaneous NIRS and MRCP monitoring in the motor cortex during a voluntary right-finger pinch task. Significant , Hb, and HbT changes and activation were observed in the bilateral PFC and dPMC in the motor preparatory phase and activation in the contralateral hand area of the SMC, which were followed by the movement. Furthermore, by comparing MRCP and NIRS data, we evaluated the temporal relationship between hemodynamic changes and neural activity. The peak of the MP component preceded that of the changes in C3 by 3.4 to 3.9 s. As demonstrated in several studies on movement-related activation using PET or fMRI, motor preparation is associated with activation in the PFC,20 PMC,21 and parietal cortex.22 In the present study, in order to obtain the pure motor preparation state and minimize possible artifacts, we asked subjects to carry out tasks with an approximate 10 s interval at their own pace without cues. We demonstrated not only motor preparatory activation in the bilateral PFC and dPMC, but also motor executive activation in the contralateral hand area of the SMC, although this activation was brief, and the amplitude was small. Furthermore, cross-correlation analysis revealed quite strong correlations between the two hemispheres’ hemodynamic responses in both the PFC and the dPMC. With respect to the topography of average changes, the hemodynamic activation that occurred earlier in the bilateral PFC and dPMC than in the hand area of the SMC became increasingly left-dominant with the passage of time. Thus the NIRS study revealed a motor neural network associated with the single motor task being performed. Recent reports have described the event-related NIRS using several tasks.6,7 Although these studies demonstrated stable NIRS signals with well-designed tasks, it was difficult to investigate whether the observed NIRS signals were neural activation responses to the tasks. The simultaneous recording of NIRS and event-related potentials (ERPs), as in our present study, resolves this problem. The benefits of this methodology include the feasibility of comparing hemodynamic responses and neural activity simultaneously, as well as the detection of the origins of activation. Previous studies showed that the bilateral SMC or SMA were the main sources of MRCPs, especially the BP and components,12,23 while the MP source was in the contralateral SMC.18 Our results suggest that the and Hb changes in the motor preparatory phase occurred in the bilateral PFC and dPMC when the maximal peak of BP was observed in Fz or Cz, and that of was observed in Cz or C3. The increase in the motor initiation phase was significant in the hand area of the SMC, with left dominance, when the strongest peak of MP was clearly detected in C3. Careful consideration of the motor preparatory NIRS signals in the bilateral PFC and dPMC is warranted. First, the activation patterns were homogeneous in the bilateral PFC, dPMC, and several other frontal cortex areas. These NIRS signals may thus include some systemic physiological noise. To validate these data, we performed preliminary NIRS experiments in which motion would not be voluntary, with subjects instead performing the pinch task following the presentation of instructions on a computer screen. Consequently, motor preparatory activation was not detected while the bilateral PFC and the hand area of the SMC were activated in the motor initiation phase. These motor preparatory activations may have occurred coextensively and reciprocally in the bilateral PFC, dPMC, and other frontal cortex areas. Second, the temporal traces of PFC and dPMC show a biphasic response in the and HbT traces with a decrease following activation, while the Hb traces show almost no response. Though it is unclear why these responses occurred, the baseline settings, systemic noise, and other factors may have affected the results. A study using other averaging techniques or additional artefact removal will be needed to assess the validity of our procedure and its applicability. In order to discuss the temporal coupling between hemodynamic changes and neural activity, we also compared MRCP and NIRS data from the vicinity of the contralateral hand sensorimotor area. Previous studies found that the vascular response to motor stimulation typically peaks approximately 2 to 5 s after stimulation, the duration of which ranged from 2 to 20 s.7,24,25 Our results showed that the peak of the increase in C3 occurred 3.4 to 3.9 s later than that of MP in the left hand area of the SMC in response to the right voluntary pinch task. These results indicate that the vascular response to neural activity occurs within 4 s in a simple or brief voluntary motor task. Such a rapid hemodynamic response has not previously been reported. We were able to detect small hemodynamic responses to fine neural activity induced by a very brief () voluntary task, which was different from the block-manner (2 to 20 s) and cue-designed tasks employed in previous studies. In conclusion, for the first time, we performed a movement-related cortical study with simultaneous NIRS and ERP recordings. In addition, we evaluated the relationship between hemodynamic responses and neural activities with respect to region and time. Although further examination and discussion are warranted, our method is a promising strategy for event-related motor control and neurovascular coupling studies. AcknowledgmentsWe thank Hitachi Medical Corporation Japan for the ETG-4100 and for its technical support of this study. ReferencesI. Nambuet al.,
“Single-trial reconstruction of finger-pinch forces from human motor-cortical activation measured by near-infrared spectroscopy (NIRS),”
Neuroimage, 47
(2), 628
–637
(2009). http://dx.doi.org/10.1016/j.neuroimage.2009.04.050 NEIMEF 1053-8119 Google Scholar
Y. Satoet al.,
“Near-infrared spectroscopic study and the Wada test for presurgical evaluation of expressive and receptive language functions in glioma patients: with a case report of dissociated language function,”
Neurosci. Lett., 510
(2), 104
–109
(2012). http://dx.doi.org/10.1016/j.neulet.2012.01.011 NELED5 0304-3940 Google Scholar
B. M. Mackertet al.,
“Dynamics of cortical neurovascular coupling analyzed by simultaneous DC-magnetoencephalography and time-resolved near-infrared spectroscopy,”
Neuroimage, 39
(3), 976
–986
(2008). http://dx.doi.org/10.1016/j.neuroimage.2007.09.037 NEIMEF 1053-8119 Google Scholar
H. Mochizukiet al.,
“Cortical hemoglobin-concentration changes under the coil induced by single-pulse TMS in humans: a simultaneous recording with near-infrared spectroscopy,”
Exp. Brain. Res., 169
(3), 302
–310
(2006). http://dx.doi.org/10.1007/s00221-005-0149-0 EXBRAP 0014-4819 Google Scholar
M. Takeuchiet al.,
“Brain cortical mapping by simultaneous recording of functional near infrared spectroscopy and electroencephalograms from the whole brain during right median nerve stimulation,”
Brain. Topogr., 22
(3), 197
–214
(2009). http://dx.doi.org/10.1007/s10548-009-0109-2 BRTOEZ 0896-0267 Google Scholar
Y. NoguchiT. TakeuchiK. L. Sakai,
“Lateralized activation in the inferior frontal cortex during syntactic processing: event-related optical topography study,”
Hum. Brain. Mapp., 17
(2), 89
–99
(2002). http://dx.doi.org/10.1002/(ISSN)1097-0193 HBRME7 1065-9471 Google Scholar
H. Obriget al.,
“Cerebral oxygenation changes in response to motor stimulation,”
J. Appl. Physiol., 81
(3), 1174
–1183
(1996). JAPYAA 0021-8987 Google Scholar
G. BarrettH. ShibasakiR. Neshige,
“Cortical potentials preceding voluntary movement: evidence for three periods of preparation in man,”
Electroencephalogr. Clin. Neurophysiol., 63
(4), 327
–339
(1986). http://dx.doi.org/10.1016/0013-4694(86)90017-9 ECNEAZ 0013-4694 Google Scholar
H. H. KornhuberL. Deecke,
“Hirnpotentialänderungen bei Willkürbewegungen und passiven Bewegungen des Menschen: Bereitschaftspotential und reafferente Potentiale,”
Pflügers. Arch. Ges. Physiol., 284 1
–17
(1965). Google Scholar
H. G. Vaughan Jr.L. D. CostaW. Ritter,
“Topography of the human motor potential,”
Electroencephalogr. Clin. Neurophysiol., 25
(1), 1
–10
(1968). http://dx.doi.org/10.1016/0013-4694(68)90080-1 ECNEAZ 0013-4694 Google Scholar
A. Inuggiet al.,
“Motor area localization using fMRI-constrained cortical current density reconstruction of movement-related cortical potentials, a comparison with fMRI and TMS mapping,”
Brain. Res., 1308 68
–78
(2010). http://dx.doi.org/10.1016/j.brainres.2009.10.042 BRREAP 1385-299X Google Scholar
K. Tomaet al.,
“Generators of movement-related cortical potentials: fMRI-constrained EEG dipole source analysis,”
Neuroimage, 17
(1), 161
–173
(2002). http://dx.doi.org/10.1006/nimg.2002.1165 NEIMEF 1053-8119 Google Scholar
M. Hondaet al.,
“Movement-related cortical potentials and regional cerebral blood flow change in patients with stroke after motor recovery,”
J. Neurol. Sci., 146
(2), 117
–126
(1997). http://dx.doi.org/10.1016/S0022-510X(96)00291-2 JNSCAG 0022-510X Google Scholar
R. C. Oldfield,
“The assessment and analysis of handedness: the Edinburgh inventory,”
Neuropsychologia, 9
(1), 97
–113
(1971). http://dx.doi.org/10.1016/0028-3932(71)90067-4 NUPSA6 0028-3932 Google Scholar
H. Shibasakiet al.,
“Components of the movement-related cortical potential and their scalp topography,”
Electroencephalogr. Clin. Neurophysiol., 49
(3–4), 213
–226
(1980). http://dx.doi.org/10.1016/0013-4694(80)90216-3 ECNEAZ 0013-4694 Google Scholar
L. DeeckeP. ScheidH. H. Kornhuber,
“Distribution of readiness potential, pre-motion positivity and motor potential of the human cerebral cortex preceding voluntary finger movements,”
Exp. Brain. Res., 7
(2), 158
–168
(1969). http://dx.doi.org/10.1007/BF00235441 EXBRAP 0014-4819 Google Scholar
E. NeidermeyerF. Lopes da Silva,
“Electroencephalography: basic principles, clinical applications, and related fields,”
William & Wilkins, Baltimore
(1993). Google Scholar
D. CheyneH. Weinberg,
“Neuromagnetic fields accompanying unilateral finger movements: pre-movement and movement-evoked fields,”
Exp. Brain. Res., 78
(3), 604
–612
(1989). http://dx.doi.org/10.1007/BF00230248 EXBRAP 0014-4819 Google Scholar
T. Nagamineet al.,
“Cortical magnetic and electric fields associated with voluntary finger movements,”
Brain. Topogr., 6
(3), 175
–183
(1994). http://dx.doi.org/10.1007/BF01187707 BRTOEZ 0896-0267 Google Scholar
J. B. Pochonet al.,
“The role of dorsolateral prefrontal cortex in the preparation of forthcoming actions: an fMRI study,”
Cerebr. Cortex., 11
(3), 260
–266
(2001). http://dx.doi.org/10.1093/cercor/11.3.260 53OPAV 1047-3211 Google Scholar
W. Richteret al.,
“Sequential activity in human motor areas during a delayed cued finger movement task studied by time-resolved fMRI,”
Neuroreport, 8
(5), 1257
–1261
(1997). http://dx.doi.org/10.1097/00001756-199703240-00040 NERPEZ 0959-4965 Google Scholar
M. F. Rushworthet al.,
“The left parietal cortex and motor attention,”
Neuropsychologia, 35
(9), 1261
–1273
(1997). http://dx.doi.org/10.1016/S0028-3932(97)00050-X NUPSA6 0028-3932 Google Scholar
A. Ikedaet al.,
“Movement-related potentials recorded from supplementary motor area and primary motor area. Role of supplementary motor area in voluntary movements,”
Brain, 115
(4), 1017
–1043
(1992). http://dx.doi.org/10.1093/brain/115.4.1017 BRAIAK 0006-8950 Google Scholar
T. J. Huppertet al.,
“A temporal comparison of BOLD, ASL, and NIRS hemodynamic responses to motor stimuli in adult humans,”
Neuroimage, 29
(2), 368
–382
(2006). http://dx.doi.org/10.1016/j.neuroimage.2005.08.065 NEIMEF 1053-8119 Google Scholar
A. Kleinschmidtet al.,
“Simultaneous recording of cerebral blood oxygenation changes during human brain activation by magnetic resonance imaging and near-infrared spectroscopy,”
J. Cerebr. Blood. Flow. Metabol., 16
(5), 817
–826
(1996). http://dx.doi.org/10.1097/00004647-199609000-00006 JCBMDN 0271-678X Google Scholar
|
|||||||||||||||||||||||||||||||||||||||||||||||||||||||||||||||||||||||||||||||||||||||||||||||||||||||||||||||||||


