|
|
1.IntroductionOver the past 25 years, near-infrared (NIR) optical imaging approaches have been developed for breast cancer diagnosis based upon the endogenous absorption contrast owing to the nonspecific process of angiogenesis, in order to discriminate normal from diseased tissues.1–6 In recent years, hand-held based optical imaging systems employing the surface reflectance-based imaging configuration were developed in an attempt to translate the technology to the clinic, with maximum patient comfort and portability (against bulky optical imagers available). The hand-held optical imagers available to date7–27 have only flat probe heads (Table 1), which limit them from: (i) contouring to tissue curvatures with good surface contact, and (ii) obtaining depth information, due to lack of transillumination measurements (since they obtain only reflectance measurements). In addition, these imagers have not demonstrated three-dimensional (3-D) optical tomography (with or without fluorescence), and their application has been limited to in vivo spectroscopic measurements of physiological properties12,13,16,17,21,22 and two-dimensional (2-D) target localization (without tomographic analysis).19,20,27 In order to successfully reconstruct a lesion size and location in three dimensions, a priori information from another imaging modality (e.g., ultrasound) was required.25,26 Table 1Comparison of existing imagers and our (Gen-1) hand-held optical imager.
A novel (Generation-1 or Gen-1) hand-held optical imager was recently developed in our Optical Imaging Laboratory28,29 (see Fig. 1). The unique features of this hand-held imager include: (i) flexibility of the hand-held probe to image large surface areas () and different tissue curvatures (0 to 45 deg) rapidly; (ii) ability to perform simultaneous multiple point illumination and collection of optical signals from large tissue surfaces rapidly; (ii) performance of reflectance imaging from the hand-held design, similar to ultrasound; and (iii) ability to perform 3-D tomographic imaging (using the tracked positional information of the probe during imaging). The Gen-1 imager is also capable of performing continuous-wave and frequency-domain imaging. The feasibility towards 2-D surface mapping and 3-D tomographic imaging has been demonstrated on cubical tissue phantoms.28–30 Fig. 1(a) The Gen-1 hand-held probe consisting of six source fibers and 165 detection fibers; (b) The benchtop Gen-1 hand-held optical imager consisting of the hand-held probe, laser source system, ICCD detector system, and pertinent electrical components. 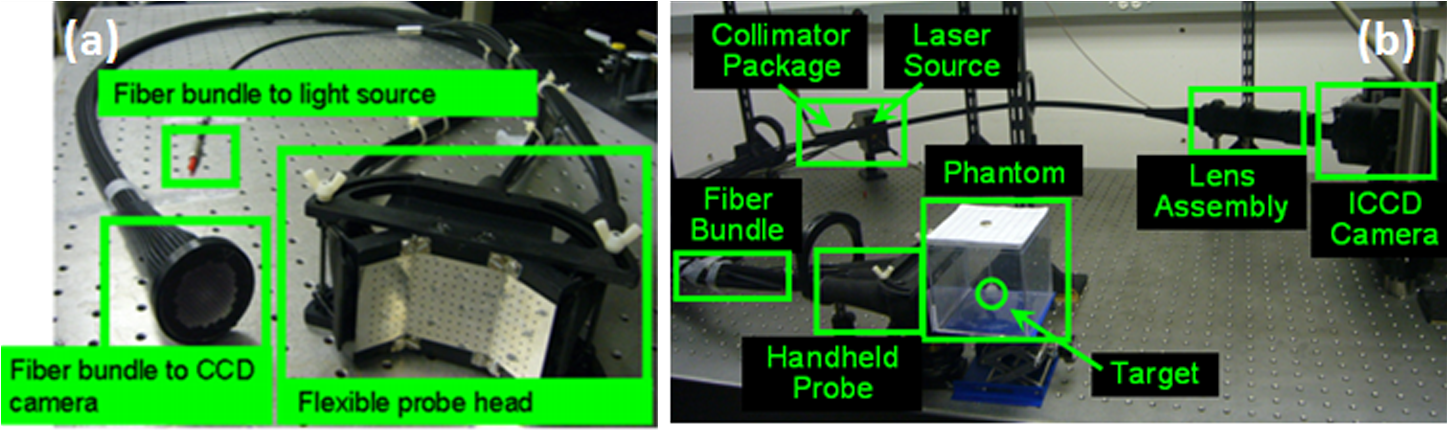 However, the Gen-1 optical imager was limited by the following features: (i) the segmented three-piece design of the probe head does not have a smooth tissue-probe contact, causing noisy or no signals at all at the interface of the segments. This in turn leads to false positive results (unpublished work) from specularly reflected signals due to sharp edges. (ii) A single probe head, although flexible to curve up to 45 deg, is not capable of collecting effective transillumination images towards improved target depth recovery. (iii) An aluminum-based probe head is not patient comfortable (i.e., metal feels cold to skin), when it contacts the tissue. (iv) The design is bulky, making it difficult to hold the probe by the operator. (v) Large probe head area causes tension to the fibers upon flexing the probe to image tissue curvatures. (vi) Non-uniform distribution of the simultaneously illuminated sources causes poor target detectability near weaker sources. In summary, the Gen-1 imager was not only bulky and less patient comfortable, but was also challenging for in vivo clinical applications being limited from imaging breast curvatures with good surface contact. Herein, a generation-2 (Gen-2) hand-held optical imager is developed as a portable device with improved features appropriate towards (future) in vivo breast imaging studies and clinical translation of the technology. In the following sections, the instrumentation development of the imager is described. The effect of the improved instrumentation in enhancing target detectability is experimentally validated from tissue phantom studies and the potential clinical applications of the device are highlighted. 2.Materials and Methods2.1.Instrumentation (Gen-2 Hand-Held Probe)A Gen-2 hand-held probe has been developed with features that would overcome the limitations of Gen-1 hand-held probe (described in Sec. 1 and shown in Table 2). These features include: Table 2Comparison of the Gen-1 and Gen-2 hand-held optical probe (developed at the Optical Imaging Laboratory).
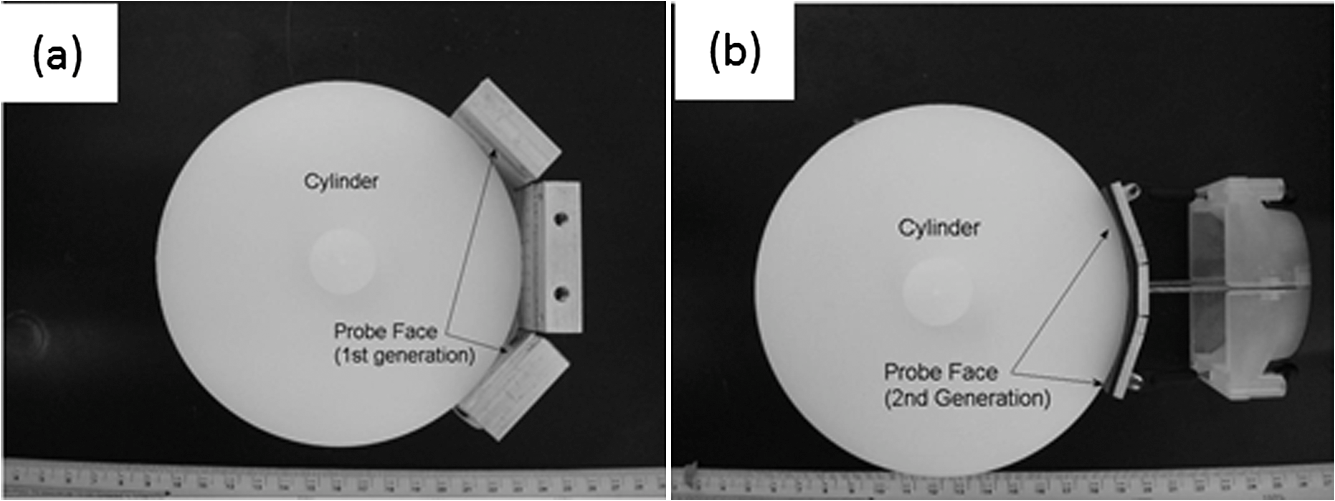
(1) A smooth probe head with five-piece segmented design for a smooth contact, no sharp edges and maximum patient comfort. This involved the use of silicone to interlock fivedifferent probe face pieces made of Lexan [see Fig. 2(a) and 2(b)]. The silicone/Lexan probe face would be more comfortable (i.e., not cold to the skin when contacted) on the skin over a metal-based (aluminum) probe head (Gen-1). Additionally, the five-part probe head with flexible silicone interlocking allows a smooth curvature of the probe head with surface contact (experimentally measured) on typical breast curvatures in comparison to about surface contact using the three-piece Gen-1 probe head (as described in Sec. 2.1.1 below). The probe head was curved using a locking-spring mechanism that allows the user to lock the probe face to the required curvature in order to allow maximum surface contact. Fig. 2(a) The Gen-2 hand-held probe with the forked two-part probe head design, (b) one of the two-part probe heads in its curved position, consisting of three source fibers and 96 detector fibers in each probe head, and (c) the Gen-2 portable cart-based optical imager, consisting of the hand-held probe, laser source system, ICCD camera, and pertinent electrical systems.  (2) A forked probe design, such that there are two smaller area probe heads to perform reflectance, transillumination, and/or simultaneous bilateral imaging with greater flexibility. Two smaller probe heads of are developed, with 96 detectors and three sources on each probe head. The total area of the two probe heads is the same as the total probe head area of the Gen-1 design. Hence, the source fiber layout (i.e., six sources on the Gen-1 probe head) was maintained the same for the Gen-2 probe (three sources on each of the two probe heads) in order to maximize the total area of illumination.28 Additionally, the 96 detectors (multimode fibers of 710 µm diameter and 1.5 m length) are located 0.5 cm from each other and with respect to the three sources (multimode fibers of 710 µm diameter and 2 m length) on each probe head. The detector fibers from both the probe heads are bundled together at the other end and mounted onto a mount-piece that is in turn coupled via a C-mount to the intensified charge coupled device (ICCD) camera (detector). The source fibers are connected to the laser diode based source system as described in Sec. 2.2. (3) The bulky design of the probe handle has been downsized for ease of operator holding it. The smaller probe head in Gen-2 made the probe head a true hand-held design that could be held in the operator’s hand with ease, unlike the Gen-1 probe design [as seen in Figs. 1(a), 2(a), and 2(b)]. 2.1.1.Surface contact area of the hand-held probeExperimental measurements of surface area contact with the Gen-1 and Gen-2 probe heads was determined to be and 86% respectively. The experiments were performed using a 13-cm-diameter solid cylindrical phantom. The probes were adjusted to their maximum allowable curvature as appropriate for the cylindrical phantom and placed in contact to its cylindrical surface. A white light digital image of the setup was acquired from the top view (see Fig. 3). The digitized image was converted to grayscale and a Sobel filter was applied in order to display only the edge information. Three points (or pixel locations) on each large probe plate (i.e., three probe plates each for Gen-1 and Gen-2’s single probe head) was determined and fitted to a circle. The curvature () of each fitted circle is estimated from the radius of the circle (), and the surface contact area () for a single probe plate is estimated using the equation below, where and are the radius of curvatures of the each large probe plate and cylindrical phantom (in cm), respectively. The cylindrical phantom’s curvature (i.e., ) is , based on its 6.5 cm radius (). is the surface area of the respective probe plate that is imaged (). The total surface area contact is the summation of three probe plates’ contact area (for Gen-1 and Gen-2 probes). From this experimental approach, the total surface contact areas for Gen-1 and Gen-2 probes are and , respectively. In additional to the above procedure, a template of the probe plates was used with an ink pad stamping approach onto the cylindrical phantom in order to measure the total contact area using Vernier calipers. This approach also provided similar values of effective surface contact area (i.e., for Gen-1 and for Gen-2 probe, respectively). On an average, the Gen-2 probe has almost three times greater surface contact on a cylindrical phantom over the Gen-1 probe. Effective surface contact area was not obtained from human breast tissues, since the probe contact can change on the nonconforming soft tissues. This can cause inconsistency in the experimental data based on pressure applied onto the tissue. Although, the above study on a cylindrical phantom clearly demonstrates that Gen-2 probe has an improved surface contact over Gen-1 probe.2.2.Instrumentation (Gen-2 Hand-Held Imager)Unlike the benchtop-based Gen-1 optical imager, the Gen-2 optical imager is assembled such that it is a portable unit. The Gen-2 hand-held probe is coupled to a laser-diode based source system and an ICCD-based detector in a portable cart as shown in Fig. 2(c). 2.2.1.Laser-diode-based source systemThe laser-diode-based source system in Gen-1 optical imager employed a custom-built collimation package consisting of a focusing lens and a diffuser28 in order to allow uniform intensity lasing of the six simultaneous sources. However, the design was not very successful as the collimator-diffuser package not only caused intensity loss, but also caused the source strength distribution amongst all six fibers (of the source fiber bundle) to vary significantly ( standard deviation). Herein, an alternate design is implemented towards achieving simultaneous multiple point sources with uniform source intensity distribution in the Gen-2 imager (see Fig. 4). Fig. 4(a) Schematic of the Gen-2 hand-held optical imager as a continuous-wave imaging system. (b) The schematic of the laser diode based source system that allows uniform illumination from each point source. The source system is also capable of frequency-domain measurements via a frequency-synthesizer and an RF splitter (for future frequency-domain imaging studies). 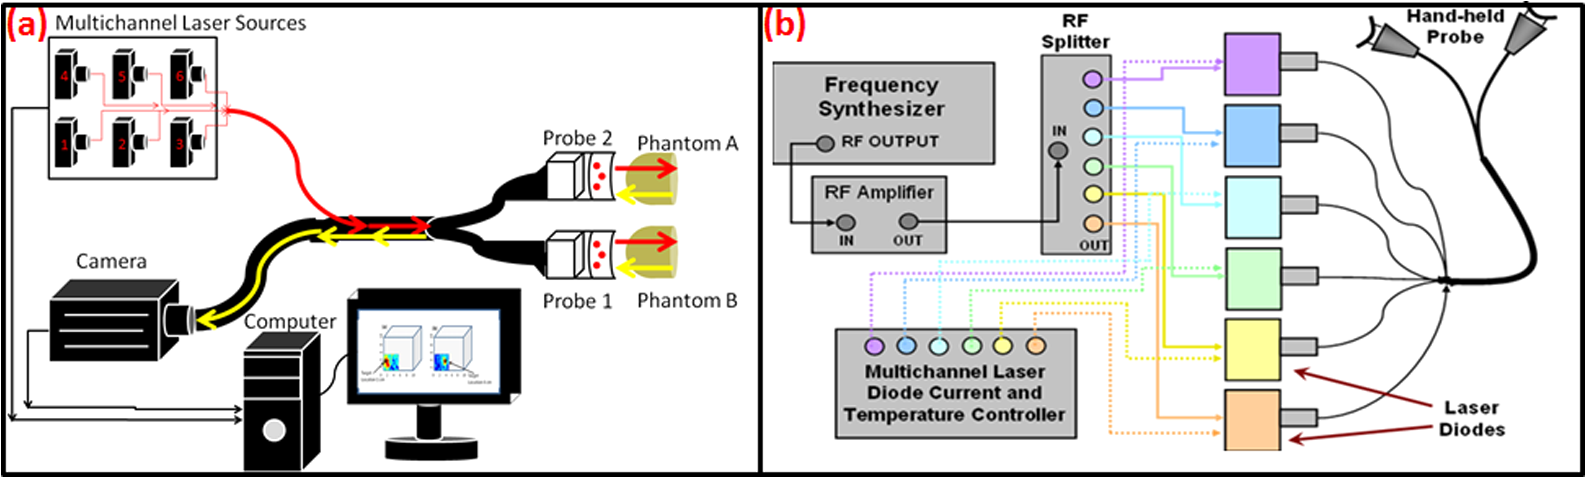 The design involved the use of six laser diodes that are simultaneously controlled (temperature and current) using a multichannel laser diode current and temperature controller (Newport, Irvine, CA). An external RF splitter (Minicircuits, Brooklyn, NY) is used to generate six simultaneous RF signals from a single frequency synthesizer and inputted into the multichannel laser diode controller (in order to allow frequency-domain based imaging as well, in future). The turn ON/OFF of laser diodes during imaging is controlled remotely via custom-developed Labview software, such that simultaneous as well as sequential multipoint illumination is feasible. This source system design was able to achieve uniform source intensity illumination (with standard deviation in output intensity across the six illumination points) (as shown in Fig. 5). Uniform source intensity illumination is essential in detecting deep or small volume targets that could otherwise be missed when the source intensity distribution varies significantly. This has been experimentally evaluated as described in Sec. 2.3. Fig. 5(a) The source-detector layout of the Gen-1 hand-held probe, with all fibers spaced 0.5 cm apart. The typical output intensity from each of the six simultaneous illumination sources (solid red circles) is shown. The mean and standard deviation of output source light intensity is , making it a nonhomogenous source distribution. (b) The source-detector layout of each of the two probe heads of the Gen-2 imager. The typical output intensity from each of the (three each) simultaneous illumination sources (solid red circles) is shown. The mean and standard deviation of output source light intensity for the two probe heads is and , making it a homogenous source distribution.  2.2.2.ICCD-based detection systemA customized gain-modulated ICCD camera (PI-MAX II Princeton Instruments, Trenton, NJ) is used to simultaneously detect optical signals from all detector fibers () placed onto a single circular mount. The circular mount is connected to the ICCD camera via a C-mounted focusing lens (AF Nikkor 50 mm ). A lens assembly is placed between the focusing lens and ICCD camera, in order to hold appropriate optical filters (e.g., band pass, interference, holographic) during imaging studies. The hand-held probe along with the source and detector system is assembled in a portable cart, mimicking a typical portable ultrasound-based imaging system. Currently, the Gen-2 imager is developed to operate in the continuous-wave mode, in order to acquire steady-state intensity images via custom-developed Labview based imaging software. In the future, appropriate instrumentation will be added to facilitate frequency-domain imaging, as in the Gen-1 imager [as shown in Fig. 4(b)]. 2.3.Experimental Studies and Data AnalysisExperimental tissue phantom studies were performed in order to demonstrate the effectiveness of the Gen-2 hand-held optical imager over the Gen-1 imager in terms of its target detectability (that may be impacted from the uniformity or nonuniformity of source strength distribution). A cubical phantom of was filled with 1% Liposyn solution (Hospira, Lake Forest, IL) with optical properties mimicking that of a breast tissue. A ( diameter) tumor-simulating target filled with 0.08% (by volume) India Ink (an absorption contrast agent, added to increase the optical contrast between target and background) in 1% Liposyn solution was placed at various locations and a depth of 1.0 cm from the imaging surface. The absorption () and reduced scattering coefficient () of 1% Liposyn as measured using a homodyne single-pixel based frequency domain system (at 785 nm wavelength) was and , respectively (where ). The absorption coefficient of 0.08% India Ink was estimated using a spectrophotometer as at 785 nm wavelength. The reduced scattering coefficient () of India Ink can vary between 4 and as reported by various researchers,31,32 and was challenging to estimate in our studies. The typical optical properties of human breast tissues33 are , . Hence, the phantoms used in the current studies have similar optical properties of a human breast tissue. Simultaneous multiple point illumination was carried out using both Gen-1 and Gen-2 imagers. Laser diodes at 785 nm wavelength were used at an output optical power in each source. Continuous-wave measurements of attenuated near-infrared signals were acquired by the ICCD-based detector in both the imagers. In Gen-1 and Gen-2 imager, the exposure time was set to 0.2 s and five repeated measurements were acquired (and averaged) at each probe location on the tissue phantom surface. Since the focus of this study was only to evaluate the effect of uniform source distribution on target detectability, only one probe head of the two heads were used during imaging studies in the Gen-2 imager. Prior to performing the imaging studies, the source strengths of the simultaneous sources were measured using an optical power meter (Thorlabs Inc., Newton, NJ). The continuous-wave (CW) based raw intensity signals acquired by the detectors in both the imagers were postprocessed in order to determine the 2-D intensity distribution map of the imaged surface (as 2-D surface contour plots). Experimental studies were performed with the target placed at various locations, with respect to the source locations. For consistency, the target’s location was shifted horizontally in the -axis, keeping its vertical position (-axis) and depth (-axis) constant, and optical signals were acquired at each of the target’s location. A subtraction-based approach was employed in order to minimize the background noise from the excitation leakage.29 In the subtraction approach, optical signals of the homogenous Liposyn phantom were acquired without the target(s), at the same experimental conditions as the experiments with the embedded targets. These background optical signals were subtracted from the respective optical signals acquired with the target in place. The results are shown as 2-D surface contour plots of the subtracted intensity signals in different experimental cases. Quantitative analysis of the 2-D optical images was also performed in order to estimate the detected target location, distance off from true target location, detected target size, and measurement errors. The detected target location was determined as the location with the maximum absorption intensity (from the subtracted intensity signals). The distance off between the true and detected 2-D target location was further calculated. The detected target size was estimated from average FWHM (full-width half max) value obtained across - and -axis independently (as measured at the detected target’s centroid). The measurement errors for each experimental case was estimated as the average standard deviation of the five repeated measurements of (detected) normalized optical intensity data obtained across all the detectors of the Gen-1 and Gen-2 probes. 3.Results and DiscussionThe improvement of the Gen-1 hand-held optical imaging system in terms of the hand-held design, source illumination system, and the compactness of the system (from a benchtop setup) has led to the evolution of a more clinically applicable and portable Gen-2 hand-held optical imager. The effectiveness of the Gen-2 over Gen-1 imager towards improved 2-D target detectability is experimentally evaluated. The output powers of the simultaneous illuminating sources in both the generations of the hand-held imager are shown in Fig. 5. The source intensities in Gen-1 probe vary significantly across the six sources with a 94% standard deviation and an average power of 1.02 mW. In comparison, the Gen-2 probes have significantly consistent source intensities across the three sources in each probe head, with a 3% standard deviation and an average power of 2.01 mW. Figure 6 shows the 2-D surface contour plots of the detected signals using the Gen-1 imager for two experimental cases, where the target was placed deep, but at different locations in the cubical phantom. Although experiments were performed at various target -locations along the same plane, only three experimental cases are shown here for brevity. When the target was located at [2,2.5,1] or [4,2.5,1] cm, it was closer to two relatively strong sources (2.169, 1.03, or 2.087 mW). The detected (and subtracted) optical signals were able to detect the target distinctly and closer to its true location [see Fig. 6(a) and 6(b) and cases 1 and 2 of Table 3]. On the contrary, when the target was located at [9, 2.5, 1] cm, it was closer to two relatively weaker sources (0.053 and 0.715 mW). The detected (and subtracted) optical signals could not detect the target [as seen from Fig. 6(c) and case 3 of Table 3]. This is possibly because the source signals attenuate exponentially and weaker sources may eventually lead to insensitive NIR signals from the targets. Hence, in spite of subtracting the background excitation leakage signals, the optical signals from the absorption-contrasted target are too weak to be detected by the ICCD camera. Fig. 6Two-dimensional surface contour plots of the differential absorption in the imaged region of a cubical phantom (filled with 1% Liposyn), and a absorption contrasted target (filled with 0.08% India Ink and 1% Liposyn solution) located at the same depth, but at various locations. The imaging studies were carried out using the Gen-1 imager, with the target located at (a) [2,2.5,1] cm, i.e., closer to a strong input source, (b) [4,2.5,1] cm, i.e., closer to a strong input source; and (c) [9,2.5,1] cm, i.e., closer to a weaker input source. The hollow black circle represents the true target location. All the plots are drawn to scale with respect to the max detected (and subtracted) intensity across the three experimental cases (for better comparison) and further normalized.  Table 3Quantitative details of the detected target location, size and measurement errors for different experimental cases using the Gen-1 and Gen-2 imager.
Figure 7 shows the 2-D surface contour plots of the detected signals using Gen-2 imager (only one probe head used) for two experimental cases, where the target was placed deep, but at different locations in the cubical phantom. In this study, the detected (and subtracted) optical signals were able to distinctly detect the target in 2-D, at any target location with respect to the source layout (as quantitatively shown from cases 4 through 6 of Table 3). This is possibly because of the presence of strong and uniform-strength source illumination in the Gen-2 imager unlike in Gen-1, that generate signals sensitive enough to be detected by the ICCD camera. Fig. 7Two-dimensional surface contour plots of the differential absorption in the imaged region of a cubical phantom (filled with 1% Liposyn), and a absorption target (filled with 0.08% India Ink and 1% Liposyn solution) located at the same depth, but at various locations. The imaging studies were carried out using a single probe of the Gen-2 imager, with the target located at (a) [1,2.5,1] cm, (b) [2.5,2.5,1] cm, and (c) [4,2.5,1] cm. The hollow black circle represents the true target location. All the plots are drawn to scale with respect to the max detected (and subtracted) intensity across the three experimental cases (for better comparison) and further normalized.  From Table 3, it is observed that the estimated target size (i.e., average FWHM measurements) was consistently larger than the true target size (0.95 cm diameter) in most experimental cases and independent of the imager used (Gen-1 or Gen-2). This is probably from the diffused optical signal, whose detected size from 2-D images is impacted by the depth of the target as well. In terms of the average measurement errors across the different experimental cases, the Gen-1 imager was an order of magnitude smaller than the Gen-2 imager at any given target location with respect to the source. This is because the measurement error is dependent on the stability of the input source light, sensitivity of the detector (here ICCD camera), and other electronics during repeated measurements. From vast experimental studies and experience, it was observed that the sensitivity of the ICCD camera played a significant role in impacting the measurement errors. The Gen-1’s ICCD camera was a highly sensitive Gen-III image intensifier (FS9910, ITT Night Vision) optically coupled to a 16-bit CCD camera (PI-SCX, Princeton Instruments) and the Gen-2’s ICCD camera was a customized PI-MAX II (Princeton Instruments). From the specifications of the camera and their performance, the Gen-1’s ICCD camera was highly sensitive and consistently demonstrated lesser measurement errors over Gen-2’s camera, independent of the probe it was coupled to (i.e., Gen-1 or Gen-2 probe). In other words, while the ICCD camera predominantly affects the overall measurement errors during experimental studies, the effectiveness in improved target detectability is primarily due to the nature of the source strength distribution from the probes. Thus, the greater the uniformity in source strength distributions across the simultaneous multiple point sources, the better the probability to detect targets (as in the Gen-2 system). The measurement errors, although they don’t appear to impact the target detectability in 2-D imaging studies, may have an impact during 3-D image reconstructions when incorporated into the inversion algorithm (e.g., Approximate Extended Kalman Filter, AEKF). Thus the above studies have demonstrated the effectiveness of uniform source strength distribution on target detectability during near real-time surface imaging using the Gen-2 imager. Additionally, the smooth curvable Gen-2 probe head has an improved surface area contact with respect to a curved phantom (e.g., cylindrical) compared to the three-piece Gen-1 probe head. The images of Gen-1 on curved phantoms yielded excessive excitation leakage due to poor surface contact, causing direct leakage of excitation light from the sources to the detector fibers at the edges of the three-piece probe head. The fork-designed of the probe-head has the flexibility for unilateral or simultaneous bilateral imaging of both the breast tissues. In most cases, breast cancer is unilateral, allowing the noncancerous breast tissue as a reference to obtain an improved tumor-to-background (T:B) contrast. Additionally, any instrument effects are accounted for by referencing the images from one probe head with respect to the other, potentially improving the signal-to-noise ratio (SNR). Recently, preliminary studies were performed on cubical tissue phantoms () filled with 1% Liposyn and absorbance contrast agent(s) in order to demonstrate the feasibility of simultaneous bilateral imaging. Two cubical phantoms were used, one with and the other without the absorbance-contrasted target, filled with 0.08% (by volume) India Ink (Chartpak, Leeds, MA) and 1% Liposyn solution. The volume (or 0.95 cm diameter) target was located between 1.0 and 2.5 cm deep. At each depth (-axis), the -axis locations were shifted while the -axis location was kept constant. Both the phantoms were imaged simultaneously using the two-part “forked” hand-held probe(s) at symmetric locations via CW measurement technique. The images were post-processed in order to obtain the 2-D surface contour plots of the detected optical intensity distribution of both the cubical phantoms (see Fig. 8). Fig. 8Two-dimensional surface contour plots of the detected optical intensity in the (a) left phantom with a absorption contrasted target; (b) right phantom with no target. The cubical phantom is filled with 1% Liposyn solution and the target is filled with 0.08% India Ink and 1% Liposyn solution. The studies were performed using Gen-2 imager as a simultaneous bilateral imaging (of left and right phantoms) approach. The subtracted (left—right) and calibrated surface contour plot of differential transmission is shown in (c), with the black hollow circle representing the true target location. The contour plots (a) and (b) are normalized individually for better visual representation. The scale of the subtracted contour plot in (c) was converted to a positive scale and further normalized for a distinctly visualizing the improved optical contrast from the unsubtracted image [i.e., (a)].  From the figure, it was observed that by subtracting the image from one phantom with respect to the other (i.e., image from phantom with target and without target) the excitation leakage was minimized, thus improving the target:background (T:B) optical contrast and target detectability. The T:B optical contrast was estimated as the ratio of maximum absorbed intensity (within the true target location) with respect to the mean background intensity. It was observed that the T:B optical contrast of the unsubtracted 2D images [i.e., Fig. 8(a)] was leading to no target detection. On the contrary, the optical contrast of the subtracted 2-D image [i.e., Fig. 8(c)] was , thus distinctly detecting the target. Additionally, the detected target ([2.5,3] cm) was closer to its true location ([2.5,2.5] cm) as well. These data are important in demonstrating the underlying concept of simultaneous bilateral imaging across two tissues (or tissue phantoms) and its feasibility to better differentiate target from background. In an actual breast tissue, heterogeneity of the breast tissues can warrant recovery of artifacts of varying contrast ratios with respect to tumor sites when the contralateral breast tissue’s image is used as the background for subtraction. Currently, work is carried out to overcome these artifacts by developing novel data postprocessing tools that can differentiate tumors from artifacts. 4.ConclusionsA Gen-2 hand-held optical imager was developed with significant improvements over the existing Gen-1 hand-held optical imager in our laboratory. The unique features of the developed Gen-2 hand-held optical imager include: (i) a compact, portable design, similar to an ultrasound device; (ii) a fork-designed flexible probe head(s) with surface contact onto different breast curvatures; (iii) A simultaneous illumination and detection setup at multiple point locations towards near real-time surface imaging of large areas; and (iv) A uniform illumination intensity distribution across multiple simultaneous point sources, allowing improvement in target detection. The fork-design of the probe with two head(s) has the flexibility for unilateral or simultaneous bilateral imaging of both the breast tissues. The fork-design also has the flexibility to be used together or independently in order to perform reflectance imaging as in an ultrasound approach (when the probe heads are placed next to each other), or can be used to perform compressed tissue imaging (when the two probe heads are placed opposite to each other) as in x-ray mammography. This flexibility to image reflected and/or transmitted (or transilluminated) signals will also allow in-depth and early-stage tumor diagnosis (as detected light from transmitted signals that pass through the entire depth of the imaged tissue).34 Optical imaging would be clinically relevant for in vivo studies only when either fluorescence imaging is performed using single-wavelength approach, or when physiological properties (or blood flow contrast) are determined from multiwavelength approach. The focus of the above study was to demonstrate the effectiveness of improved instrumentation (Gen-2 over Gen-1 imager) towards improved 2-D target detectability during the single-wavelength CW imaging studies. In our ongoing efforts, the Gen-2 imager is modified to allow multiwavelength imaging as well such that the physiological properties or the blood flow details of the highly heterogeneous breasts can between differentiate tumor(s) from the background, towards clinical breast cancer imaging studies (both as a real-time 2-D imager and 3-D tomographic imager). In parallel, in vivo breast imaging studies are carried out to assess the effectiveness of simultaneous bilateral imaging in actual breast tissues towards tumor detection (initially at a single wavelength and later at multi-wavelengths). Additionally, other ongoing studies are focused on implementing 3-D positional tracking devices onto the hand-held probe head(s),35 such that coregistered imaging and eventually 3-D tomographic imaging is possible using the Gen-2 imager. AcknowledgmentsThe authors would like to acknowledge the funding support from NIH (R15CA119253), Coulter Foundation (Biomedical Translational Research Grant), and Department of Defense’s Pre-Doctoral Fellowship (from Breast Cancer Research Program) to one of the co-authors. ReferencesD. Grosenicket al.,
“Development of a time-domain optical mammograph and first in vivo applications,”
Appl. Opt., 38
(13), 2927
–2943
(1999). http://dx.doi.org/10.1364/AO.38.002927 APOPAI 0003-6935 Google Scholar
S. B. Colaket al.,
“Clinical optical tomography and NIR spectroscopy for breast cancer detection,”
IEEE J. Sel. Top. Quant. Electron., 5
(4), 1143
–1158
(1999). http://dx.doi.org/10.1109/2944.796341 IJSQEN 1077-260X Google Scholar
B. W. Pogueet al.,
“Quantitative hemoglobin tomography with diffuse near-infrared spectroscopy: pilot results in the breast,”
Radiology, 218
(1), 261
–266
(2001). RADLAX 0033-8419 Google Scholar
H. Jianget al.,
“Three-dimensional optical tomographic imaging of breast in a human subject,”
IEEE Trans. Med. Imag., 20
(16), 1334
–1340
(2001). http://dx.doi.org/10.1109/42.974928 ITMID4 0278-0062 Google Scholar
A. Liet al.,
“Optimal linear inverse solution with multiple priors in diffuse optical tomography,”
Appl. Opt., 44
(10), 1948
–1956
(2005). http://dx.doi.org/10.1364/AO.44.001948 APOPAI 0003-6935 Google Scholar
A. P. GibsonJ. C. HebdenS. R. Arridge,
“Recent advances in diffuse optical imaging,”
Phys. Med. Biol., 50
(4), R1
–R43
(2005). http://dx.doi.org/10.1088/0031-9155/50/4/R01 PHMBA7 0031-9155 Google Scholar
S. EricksonA. Godavarty,
“Hand-held based near-infrared optical imaging systems: a review,”
Med. Eng. Phys., 31
(5), 495
–509
(2008). http://dx.doi.org/10.1016/j.medengphy.2008.10.004 MEPHEO 1350-4533 Google Scholar
Q. Zhuet al.,
“Design of near-infrared imaging probe with the assistance of ultrasound localization,”
Appl. Opt., 40
(19), 3288
–3303
(2001). http://dx.doi.org/10.1364/AO.40.003288 APOPAI 0003-6935 Google Scholar
B. J. Tromberg,
“Optical scanning and breast cancer,”
Acad. Radiol., 12
(8), 925
–933
(2005). Google Scholar
T. H. Phamet al.,
“Broad bandwidth frequency domain instrument for quantitative tissue optical spectroscopy,”
Rev. Sci. Instrum., 71
(6), 2500
–2513
(2000). http://dx.doi.org/10.1063/1.1150665 RSINAK 0034-6748 Google Scholar
M. J. Holbokeet al.,
“Three-dimensional diffuse optical mammography with ultrasound localization in a human subject,”
J. Biomed. Opt., 5
(2), 237
–247
(2000). http://dx.doi.org/10.1117/1.429992 JBOPFO 1083-3668 Google Scholar
A. E. Cerussiet al.,
“Sources of absorption and scattering contrast for near-infrared optical mammography,”
Acad. Radiol., 8
(3), 211
–218
(2001). Google Scholar
A. E. Cerussiet al.,
“Spectroscopy enhances the information content of optical mammography,”
J. Biomed. Opt, 7
(1), 60
–71
(2002). http://dx.doi.org/10.1117/1.1427050 JBOPFO 1083-3668 Google Scholar
D. B. Jakubowskiet al.,
“Monitoring neoadjuvant chemotherapy in breast cancer using quantitative diffuse optical spectroscopy: a case study,”
J. Biomed. Opt., 9
(1), 230
–238
(2004). http://dx.doi.org/10.1117/1.1629681 JBOPFO 1083-3668 Google Scholar
A. Cerussiet al.,
“Predicting response to breast cancer neoadjuvant chemotherapy using diffuse optical spectroscopy,”
Proc. Natl. Acad. Sci. U. S. A., 104
(10), 4014
–4019
(2007). http://dx.doi.org/10.1073/pnas.0611058104 PNASA6 0027-8424 Google Scholar
K. S. Noet al.,
“In vivo breast cancer measurement with a handheld laser breast scanner,”
in Proc. of 50th IEEE International Midwest Symp. on Circuits and Systems (MWSCAS),
(2007). Google Scholar
B. Chanceet al.,
“Breast cancer detection based on incremental biochemical and physiological properties of breast cancers: a six-year, two-site study,”
Acad. Radiol., 12
(8), 925
–933
(2005). http://dx.doi.org/10.1016/j.acra.2005.04.016 Google Scholar
S. NiokaB. Chance,
“NIR spectroscopic detection of breast cancer,”
Technol. Cancer Res. Treat., 4
(5), 497
–512
(2005). 1533-0346 Google Scholar
B. Chanceet al.,
“Simple ac circuit for breast cancer detection and object detection,”
Rev. Sci. Instrum., 77
(6), 064301
(2006). http://dx.doi.org/10.1063/1.2205151 RSINAK 0034-6748 Google Scholar
Q. LiuQ. LuoB. Chance,
“2D phased array fluorescence wireless localizer in breast cancer detection,”
in 2003 IEEE International Workshop on Computer Architectures for Machine Perception,
71
–73
(2004). Google Scholar
J. R. X. Xuet al.,
“Development of a handheld near infrared imager for dynamic characterization of in vivo biological tissue systems,”
Appl. Opt., 46
(30), 7442
–7451
(2007). http://dx.doi.org/10.1364/AO.46.007442 APOPAI 0003-6935 Google Scholar
T. Durduranet al.,
“Diffuse optical measurement of blood flow in breast tumors,”
Opt. Lett., 30
(21), 2915
–2917
(2005). http://dx.doi.org/10.1364/OL.30.002915 OPLEDP 0146-9592 Google Scholar
A. Liebertet al.,
“Bed-side assessment of cerebral perfusion in stroke patients based on optical monitoring of a dye bolus by time-resolved diffuse reflectance,”
NeuroImage, 24
(2), 426
–435
(2005). http://dx.doi.org/10.1016/j.neuroimage.2004.08.046 NEIMEF 1053-8119 Google Scholar
U. Sunaret al.,
“Noninvasive diffuse optical measurement of blood flow and blood oxygenation for monitoring radiation therapy in patients with head and neck tumors: a pilot study,”
J. Biomed. Opt., 11
(6), 064021
(2006). http://dx.doi.org/10.1117/1.2397548 JBOPFO 1083-3668 Google Scholar
Q. Zhuet al.,
“Imager that combines near-infrared diffusive light and ultrasound,”
Opt. Lett., 24
(15), 1050
–1052
(1999). http://dx.doi.org/10.1364/OL.24.001050 OPLEDP 0146-9592 Google Scholar
Q. Zhuet al.,
“Ultrasound-guided optical tomographic imaging of malignant and benign breast lesions: initial clinical results of 19 cases,”
Neoplasia, 5
(5), 379
–388
(2003). 1522-8002 Google Scholar
N. G. Chenet al.,
“Portable near-infrared diffusive light imager for breast cancer detection,”
J. Biomed. Opt., 9
(3), 504
–510
(2004). http://dx.doi.org/10.1117/1.1695410 JBOPFO 1083-3668 Google Scholar
B. Jayachandranet al.,
“Design and development of a hand-held optical probe toward fluorescence diagnostic imaging,”
J. Biomed. Opt., 12
(5), 054014
(2007). http://dx.doi.org/10.1117/1.2799193 JBOPFO 1083-3668 Google Scholar
J. Geet al.,
“Three-dimensional fluorescence-enhanced optical tomography using a hand-held probe based imaging system,”
Med. Phys., 35
(7), 3354
–3363
(2008). http://dx.doi.org/10.1118/1.2940603 MPHYA6 0094-2405 Google Scholar
J. GeS. J. EricksonA. Godavarty,
“Fluorescence tomographic imaging using a hand-held probe based optical imager: extensive phantom studies,”
Appl. Opt., 48
(7), 6408
–6416
(2009). http://dx.doi.org/10.1364/AO.48.006408 APOPAI 0003-6935 Google Scholar
H. XuM. Patterson,
“Determination of the optical properties of tissue-simulating phantoms from interstitial frequency domain measurements of relative fluence and phase difference,”
Opt. Express, 14
(14), 6485
–6501
(2006). http://dx.doi.org/10.1364/OE.14.006485 OPEXFF 1094-4087 Google Scholar
F. MartelliG. Zaccanti,
“Calibration of scattering and absorption properties of a liquid diffusive medium at NIR wavelengths. CW method,”
Opt. Express, 15
(2), 486
–500
(2007). http://dx.doi.org/10.1364/OE.15.000486 OPEXFF 1094-4087 Google Scholar
D.R. Leffet al.,
“Diffuse optical imaging of the healthy and diseased breast: a systematic review,”
Breast Cancer Res. Treat., 108
(1), 9
–22
(2008). http://dx.doi.org/10.1007/s10549-007-9582-z BCTRD6 Google Scholar
J. Gonzalezet al.,
“Gen-2 hand-held optical imager towards cancer imaging: reflectance and transillumination phantom studies,”
Sensors, 12
(2), 1885
–1897
(2012). http://dx.doi.org/10.3390/s120201885 SNSRES 0746-9462 Google Scholar
S. Regaladoet al.,
“Automated coregistered imaging using a hand-held probe-based optical imager,”
Rev. Sci. Instrum., 81
(2), 023702
(2010). http://dx.doi.org/10.1063/1.3271019 RSINAK 0034-6748 Google Scholar
|