|
|
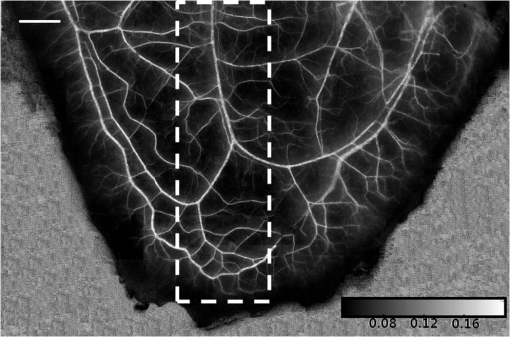
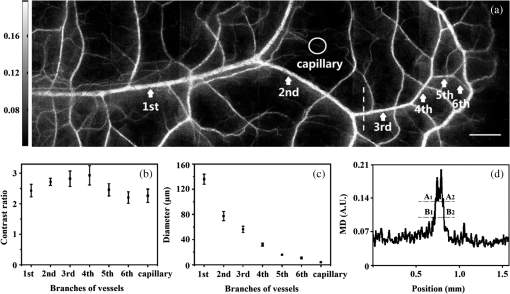
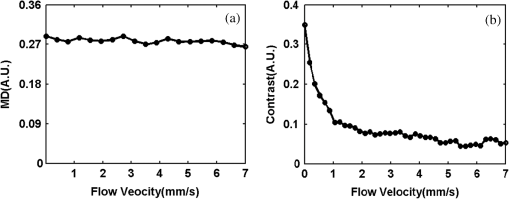
1.IntroductionAchieving the visualization and functional measurement of blood microcirculation under normal and diseased conditions is critical for scientific research and clinical diagnosis, such as evaluation of drug action, partial blood perfusion of ischemic territories, characterization of atherosclerotic plaques, etc.1–3 A number of noninvasive imaging techniques have been developed.4,5 Magnetic resonance imaging can achieve visualization of blood flow and is widely used in clinical diagnosis,6 but it is limited in its temporal and spatial resolution. Laser Doppler velocimeter can obtain blood flow velocity images with high spatial resolution,7 but its temporal resolution is low due to its point-by-point scanning manner. Optical microangiography is used to monitor the changes of cerebral blood flow after traumatic brain injury with a higher spatial resolution and sensitivity.8 However, it usually lacks the anti-interference ability. Different from the above optical techniques, laser speckle imaging (LSI) can be used for obtaining a full-field image of blood flow, with which some drawbacks of other imaging techniques can be avoided.9 The first LSI works based on spatial laser speckle contrast analysis (sLSCA),10 where the imaging parameter, speckle contrast, which is defined as the ratio of the standard deviation of the intensity to the mean intensity of the speckle pattern, is inverse to the velocity of scatterers. Then, temporal LSCA (tLSCA) was developed to increase the spatial resolution.11 There are also some other improvements introduced further into LSI. For instance, instead of using a conventional laser source, sinusoidal intensity pattern of light was applied to the sLSCA to promote the accuracy of speckle contrast;12 line beam scanning illumination was used to increase the sampling depth of blood flow imaging.13 Because of the limited spatial resolution and sensitivity, however, the conventional LSI based on sLSCA or tLSCA cannot achieve microangiography. Recently, we proposed a new LSI method based on intensity fluctuation modulation (IFM).14 (For simplicity, we abbreviate the name of this imaging method as LSI-IFM.) With this method, we obtained a full-field and high-resolution image. Here the imaging parameter is modulation depth (MD) defined as the ratio of the dynamic speckle to the stationary speckle. It is mainly decided by the concentration of the scatterers and, therefore, closely related to Brownian motion of scatterers rather than their directional motion as in the case of the conventional LSI. The function of IFM is to isolate the dynamic speckle pattern from its stationary counterpart by an appropriate filter processing. Obviously, our imaging mechanism is new. In this paper, we demonstrate that with this technique, we can obtain microangiography and realize monitoring the vascular self-recovering process. The organization of the paper is as follows. In Sec. 2, we present the theoretical description of the IFM method and the experimental setup. In Sec. 3, we demonstrate the validation of the IFM method for microangiography by the phantom experiments. Then, we show the ideal performance of our imaging method in an in vivo experiment on the blood microcirculation of a rabbit ear and display its ability in monitoring vascular self-recovering process of the ear. Section 4 is our conclusion. 2.Theory and Material2.1.TheoryIn this section, we describe our imaging method. The laser speckle phenomenon is random. The acquired signal is the sum of intensities of different frequency components and can be described as where is the intensity of the stationary speckle pattern corresponding to the nonmoving scatterers and is the modulated frequency. The term represents the signal of the dynamic speckle pattern generated by the moving scatterers and, obviously, fluctuates in time evolution. is the boxcar function defined as (Ref. 9) and describes the acquisition process, where is the time point and is the total acquisition time. To separate the stationary and dynamic speckles, we apply Fourier transform (FT) to the acquired signal. For each pixel, the frequency spectrum can be described as where is related to the stationary speckle pattern in the range centered at zero frequency, and is related to the dynamic speckle pattern in the higher-frequency range. One of the two speckle pattern signals can be obtained by filtering out the another. By applying inverse FT to them, we obtain their time-domain expressions.By the MD definition, the imaging parameter can be expressed as where means the temporal average. In the practical condition, due to the system noise, the artificial sharking interference, for example, the stationary speckle intensity may fluctuate slightly and the relative noise is in the low-frequency range. This noise affects the image quality severely. By using the IFM method to filter the signals in a proper range centered at the zero frequency, the system noise can be effectively suppressed. In this way, the desired flow information can be extracted from the background with high SNR.2.2.System SetupThe schematic of our system is shown in Fig. 1. An expanded and collimated He-Ne laser beam (, 85 mw) illuminated the tissue at a 90 deg incidence through a beam splitter. The remitted speckle pattern was recorded by an 8-bit CMOS camera (acA2000-340 km, Basler) with a resolution of (). A custom microscope was attached to the camera to ensure that each speckle size was approximate to an area of 1 pixel, which was . Crossed polarizers were set to eliminate spurious contributions from reflections. For each acquisition, sequential 1024 frames were obtained to ensure the accuracy of imaging. The exposure time of 200 μs and acquisition speed of 300 fps were used in the experiment, respectively. The whole imaging apparatus was fixed on a vibration-isolator optical platform. 3.Experiment and AnalysisIn this section, we present some phantom experimental results to illustrate our imaging method. The first experiment was made to show the IFM function of separating the dynamic speckle signal from the stationary one. A porcelain plate, which acted as the sample to be imaged, was pushed by a stepping motor with velocities of 0 and . A camera acquired the speckle signal generated by the scattering from the rough surface of the plate. When the plate is nonmoving, the dynamic speckle can almost be ignored; the raw signal corresponds only to the stationary speckle, which includes, of course, the contribution of the system noise [Fig. 2(a)]. If the plate moves, the raw acqusition contains both stationary and dynamic speckle components [Fig. 2(d)]. The averaged intensities of the raw signal under the two conditions are 108.257 and 123.854, and their ratio is 1.14. After the IFM operation, the dynamic speckle signals related to the nonmoving [Fig. 2(b)] and the moving plates [Fig. 2(e)] are extracted, respectively. The averaged intensity of the nonmoving plate is 0.786, approximately toward zero, meaning that the stationary speckle has been effectively filtered out and the averaged intensity of the moving plate is 7.422. The ratio of them after IFM operation reaches 9.44, much higher than that of the raw signal. The results verify that high-frequency dynamic speckle signal is indeed extracted by the IFM method. The averaged values of the stationary speckle signals are 108.257 for the nonmoving plate [Fig. 2(c)] and 123.854 for the moving plate [Fig. 2(f)]. The ratio of MDs is 8.23, which is much higher than the ratio of the raw signal. This indicates indirectly that the imaging with high SNR can be achieved. Fig. 2Analysis of IFM mechanism: acquired raw signal of (a) nonmoving and (d) moving plates; dynamic speckle signal of (b) nonmoving and (e) moving plates; stationary speckle signal of (c) nonmoving and (f) moving plates.  The second experiment was made on the velocity-dependence to illustrate our imaging theory further. In the experiment, the artificial flow phantom, 1% intralipid solution, was used to simulate the blood flow. The solution was pushed into a polyethene tube () by a single-channel syringe pump with the flow velocity varying from 0 to . Figure 3 shows the dependence of MD for LSI-IFM and, as comparison, speckle contrast for tLSCA on the flow velocity. Here the MD curve does not vary dramatically as the function of the velocity, but the contrast curve does as has already been known.14 It means that our imaging method does not take the directional motion of scatterers as the physical basis of its imaging parameter. In fact, the scatterers in the flow make the Brownian motion overlapped with the directional motion. For the LSI-IFM, what is imaged reflects the information of the speckle concentration fluctuation, which is closely related to Brownian motion, and for LSCA, it is the blurring degree that is mainly decided by the directional velocity. Therefore, the imaging mechanisms of the two methods are totally different. It is because MD responds to the flow of high velocity in a big vessel similarly as it responds to the flow of low velocity in a thin vessel, so that microvessels can be imaged if big vessels can. To demonstrate the performance of our imaging method, we imaged the two-dimensional blood flow of the pinna of a three-month-old rabbit with its hair shaved. The rabbit was narcotized by 10% chloral hydrate (0.2 mL) and fixed on the optical platform to minimize its movement. The area of the whole image is (Fig. 4), which was composed of 40 small images. In this figure, abundant microvessels and capillaries are resolved with high clarity. Fig. 4Full-field flow image of in vivo rabbit ear with LSI-IFM. The imaged area is and scale bar is 3 mm.  To see the blood vessels distribution in detail, we present an enlarged view of the area indicated by the dashed-line rectangle in Fig. 4 [Fig. 5(a)], where the microvessels up to the six branches indicated by six arrows and a capillary indicated by the circle can be identified. The contrast ratios of the six branches and capillary are shown in Fig. 5(b), and the corresponding diameters of them are shown in Fig. 5(c). The contrast ratio varies slightly between 2 and 3, which quantitatively verifies the fact that big vessels and thin capillaries can be imaged with almost same clarity. The following discussion is devoted to the determination of the spatial resolution of our method based on the theory of Ref. 15. Figure 5(d) presents the MD curve for the data selected from the dashed line indicated in Fig. 5(a), where the microvessel indicated by the arrow, which also corresponds to the peak in Fig. 5(d), belongs to the third branch. The spatial resolution can be given by , where and are the widths at the half and quarter height of the peak, respectively. The spatial resolution of the system is relatively high. Fig. 5(a) Enlarged flow image with LSI-IFM indicated by the dashline rectangle in Fig. 4; (b) contrast ratio and (c) diameter of six branches of microvessels and capillary indicated by arrows and circle in (a), respectively. (d) MD curve along the dash line in (a), where and are the widths at the half and quarter height of the peak, respectively. The imaged area is and the scale bar is 1 mm.  The experimental results above confirm the remarkable capability of our imaging method in imaging and resolving microvessels and capillaries. We expect it has practical applications in scientific research and clinical diagnosis. Here is an example to show its application in monitoring vascular self-recovering. This experiment was performed on a C57BL/6 male mouse (14 g), about one month old. The mouse was anesthetized by 4% chloral hydrate (0.1 mL) and the imaged ear was depilated with a hair remover lotion. Figure 6 shows the blood flow and its surroundings before and after traumatic injury, where the area indicated by the arrow is the place of traumatic injury. The blood flow image before injury [Fig. 6(a)], where the LSI-IFM capability delineating the dynamic blood flow down to capillary-level resolution can be seen, is used as a control image for later comparison. Thirty minutes after injury [Fig. 6(b)], the blood flow in both microvessels and capillaries cannot be distinguished from its surrounding due to the fact that the clotted blood in the injured area stops not only the directional blood flow but also the Brownian motion of the scatterers as well as the penetration of the light.8 Compared with the control image, the injured tissue will edema; thus the MD value is different from that of the normal tissue. In the later period [Figs. 6(c) and 6(e)], the swelling and clotted blood are absorbed and the wounded flow heals gradually, so the blood flows can be seen again. We note here that the self-recovering process of the wounded blood vessels proceeds very slowly. For instance, seven days after injury, some capillaries can still not be seen, maybe they cannot be seen forever due to pathologic reasons. Figure 7 presents the enlarged view of the injured area where the repair process of the wounded capillaries can be seen in detail. Fig. 6LSI-IFM full-field flow image of mouse ear (a) before and (b)–(e) after traumatic injury at different times. The sites of injury are pointed by arrows. The image size in (a)–(e) is and the scale bar is 1 mm.  Fig. 7False color images (a), (b), and (c) corresponding to the injured regions of Figs. 6(a), 6(c), and 6(e), respectively. The imaged area of (a)–(c) is .  Hemorrhagic stroke is a fatal disease that usually results from the rupture of a blood vessel or an abnormal vascular structure. Computed tomography and magnetic resonance imaging scans are the traditional methods used for this disease diagnosis.16 However, it is not available for using them in imaging the hemorrhagic region in real time. LSI-IFM may be suitable for detecting the hemorrhagic stroke and monitoring the dynamic changes of blood flow, the self-recovering process of brain tissue and vasculature in head-related treatments. 4.ConclusionIn conclusion, we presented the theory of our LSI improved with IFM where the dynamic and stationary speckles can be separated effectively. We illustrated experimentally our imaging mechanism and demonstrated its abilities in achieving microangiography and monitoring vascular self-recovering process, respectively. All results confirm the convincing performance of our imaging method in both structural and functional imaging of blood flow. It may have potential applications in biological research and the diagnosis of diseases related to hemorrhagic stroke, malignant melanoma, and so on. AcknowledgmentsThis work is supported by National Natural Science Foundation of China, Project Nos. 11174039, 11174040, 61008063, and 61275214. ReferencesK. CankarM. Strucl,
“The effect of glibenclamide on cutaneous laser-Doppler flux,”
Microvasc. Res., 75
(1), 97
–103
(2008). http://dx.doi.org/10.1016/j.mvr.2007.06.005 MIVRA6 0026-2862 Google Scholar
G. A. Armitageet al.,
“Laser speckle contrast imaging of collateral blood flow during acute ischemic stroke,”
J. Cereb. Blood Flow Metab., 30 1432
–1436
(2010). http://dx.doi.org/10.1038/jcbfm.2010.73 JCBMDN 0271-678X Google Scholar
S. K. Nadkarniet al.,
“Characterization of atherosclerotic plaques by laser speckle imaging,”
Circulation, 112 885
–892
(2005). http://dx.doi.org/10.1161/CIRCULATIONAHA.104.520098 CIRCAZ 0009-7322 Google Scholar
H. FangK. MaslovL. V. Wang,
“Photoacoustic Doppler flow measurement in optically scattering media,”
Appl. Phys. Lett., 91
(26), 264103
(2007). http://dx.doi.org/10.1063/1.2825569 APPLAB 0003-6951 Google Scholar
M. Simonuttiet al.,
“Holographic laser Doppler ophthalmoscopy,”
Opt. Lett., 35
(12), 1941
–1943
(2010). http://dx.doi.org/10.1364/OL.35.001941 OPLEDP 0146-9592 Google Scholar
F. Calamanteet al.,
“Measuring cerebral blood flow using magnetic resonance imaging techniques,”
J. Cereb. Blood Flow Metab., 19 701
–735
(1999). http://dx.doi.org/10.1097/00004647-199907000-00001 JCBMDN 0271-678X Google Scholar
H. Ishidaet al.,
“Blood flow velocity imaging of malignant melanoma by micro multipoint laser Doppler velocimetry,”
Appl. Phys. Lett., 97
(10), 103702
(2010). http://dx.doi.org/10.1063/1.3486678 APPLAB 0003-6951 Google Scholar
Y. JiaN. AlkayedR. K. Wang,
“Potential of optical microangiography to monitor cerebral blood perfusion and vascular plasticity following traumatic brain injury in mice in vivo,”
J. Biomed. Opt., 14
(4), 040505
(2009). http://dx.doi.org/10.1117/1.3207121 JBOPFO 1083-3668 Google Scholar
Y. K. TaoA. M. DavisJ. A. Izatt,
“Single-pass volumetric bidirectional blood flow imaging spectral domain optical coherence tomography using a modified Hilbert transform,”
Opt. Express, 16
(16), 12350
–12361
(2008). http://dx.doi.org/10.1364/OE.16.012350 OPEXFF 1094-4087 Google Scholar
J. D. BriersS. Webster,
“Laser speckle contrast analysis (LASCA): a nonscanning, full-field technique for monitoring capillary blood flow,”
J. Biomed. Opt., 1
(2), 174
–179
(1996). http://dx.doi.org/10.1117/12.231359 JBOPFO 1083-3668 Google Scholar
P. Liet al.,
“Imaging cerebral blood flow through the intact rat skull with temporal laser speckle imaging,”
Opt. Lett., 31
(12), 1824
–1826
(2006). http://dx.doi.org/10.1364/OL.31.001824 OPLEDP 0146-9592 Google Scholar
T. B. Riceet al.,
“Quantitative determination of dynamical properties using coherent spatial frequency domain imaging,”
J. Opt. Soc. Am. A, 28
(10), 2108
–2114
(2011). http://dx.doi.org/10.1364/JOSAA.28.002108 JOAOD6 0740-3232 Google Scholar
H. Heet al.,
“Lateral laser speckle contrast analysis combined with line beam scanning illumination to improve the sampling depth of blood flow imaging,”
Opt. Lett., 37
(18), 3774
–3776
(2012). http://dx.doi.org/10.1364/OL.37.003774 OPLEDP 0146-9592 Google Scholar
Y. Zenget al.,
“Laser speckle imaging based on intensity fluctuation modulation,”
Opt. Lett., 38
(8), 1313
–1315
(2013). http://dx.doi.org/10.1364/OL.38.001313 OPLEDP 0146-9592 Google Scholar
Y. WangR. K. Wang,
“High-resolution computed tomography of refractive index distribution by transillumination low-coherence interferometry,”
Opt. Lett., 35
(1), 91
–93
(2010). http://dx.doi.org/10.1364/OL.35.000091 OPLEDP 0146-9592 Google Scholar
J. A. Chalelaet al.,
“Magnetic resonance imaging and computed tomography in emergency assessment of patients with suspected acute stroke: a prospective comparison,”
Lancet, 369
(9558), 293
–298
(2007). http://dx.doi.org/10.1016/S0140-6736(07)60151-2 LANCAO 0140-6736 Google Scholar
|


