

|
|
1.IntroductionPeripheral artery disease (PAD) affects approximately 10 million people in the United States.1 The disease is characterized by progressive narrowing of arteries in the extremities, leading to reduction in tissue blood supply and tissue ischemia.2,3 In the most severe cases, critical limb ischemia may manifest as rest pain or limb ulceration. The traditional method to diagnose PAD is the ankle brachial index (ABI), which is simply the ratio of ankle and brachial systolic blood pressures. Generally, a resting is believed to be caused by arterial stenosis and defines patients as having PAD.4 However, while ABI has good sensitivity for identification of patients with PAD, it does not correlate well with degree of exercise impairment5 and is technically limited when supernormal pressures are encountered in patients with medial artery calcification.6 Further, while the ABI method is useful for determination of responses to revascularization, patients with a stent or bypass generally show an increase in ABI independent of claudication symptoms.7 Also, ABI is not an accurate predictor of mild disease.8 Thus development of noninvasive methods for routine and direct measurement of tissue oxygenation and blood flow in the extremities could significantly improve initial and follow-up evaluation of PAD patients. Diffuse optical techniques provide direct, noninvasive, assessment of oxygenation and perfusion processes at the microvasculature level.9–11 These techniques have several attractive features including portability, high temporal resolution, and the ability to probe deep tissues noninvasively. Diffuse optics employs near-infrared photons that diffuse through tissue and can be detected centimeters from the source. In diffuse optical spectroscopy, also known as near-infrared spectroscopy (NIRS), the absorption interactions of light with tissue chromophores, i.e., oxy- () and deoxy-hemoglobin (Hb), provide dynamic information about their concentrations and tissue oxygen saturation ().9 Diffuse correlation spectroscopy (DCS) measures temporal fluctuations in the reflected light intensity. These temporal fluctuations are primarily caused by photons that have been scattered by moving scatterers such as red blood cells. Specifically, the temporal intensity autocorrelation function of detected light is measured, and correlation diffusion theory is employed to fit the measured curve using a tissue blood flow index (BFI) as a fitting parameter.10 The BFI is not a measurement of absolute blood flow. However, the DCS technique has been used to derive relative variation of microvascular blood flow, relative blood flow (rBF), with respect to baseline in a variety of preclinical studies,12–15 and in clinical studies of cerebrovascular diseases,16–19 muscle physiology,20–23 and cancer.24 Further, during some of the studies cited above, DCS was successfully compared with more traditional clinical perfusion measurements such as arterial spin-labeled magnetic resonance imaging,12,21 fluorescent microspheres,14 Xenon-computed tomography,18 and transcranial Doppler ultrasound.19 In the present investigation, the two diffuse optical methods (NIRS and DCS) were employed in a single instrument in order to ascertain and compare muscle exercise blood flow and oxygenation responses in healthy subjects versus patients with two severities of PAD (as determined by ABI). Simultaneous optical measurement of tissue blood flow and tissue oxygenation enables more comprehensive investigation of exercise physiology in patients with PAD and, ultimately, may offer a useful new device for translation to the clinical vascular laboratory. 2.Methods2.1.Subjects and ProtocolSixty adult subjects were recruited, either from the vascular laboratory in the cardiovascular clinic (patients) or using local advertisements (healthy controls). For this clinical trial, 57 subjects contributed data. One subject refused the study post-enrollment, one had corrupted optical data, and one was missing all demographic data. We report results of two tasks requested of each subject: plantar flexion (pedal) and treadmill exercise. Both tasks were performed on the same day and in the same order, for each subject. For pedal, the first exercise, subjects were in the supine position during the test protocol. The resistance of the exercise device remained constant, and the maximal force of each individual was tested prior to the task. Subjects were then instructed to perform up to 30 plantar flexion exercises within 2 min, at 50% of their maximal force. The treadmill exercise was carried out after a short rest, following the completion of the plantar flexion, according to the Gardner protocol.25,26 Subjects walked on the treadmill at a constant speed () for up to 10 min. The platform inclination was raised 2 deg every 2 min. All procedures were approved by the Institutional Review Board at the University of Pennsylvania, where the experiments were carried out. Informed consent was obtained from all subjects prior to enrollment into the study. The optical probe was placed over the calf flexor to make NIRS and DCS measurements. and relative blood flow change from baseline (rBF) were calculated from these measurements as described in the sections below. was obtained before, during, and after exercise, but rBF was obtained only before and after exercise because DCS measurements were susceptible to motion artifacts caused by muscle motion during exercise.23,27 In order to investigate potential differences across different levels of PAD, subjects were separated into three groups according to their ABI: healthy population (; ); mild PAD patients (; ), and moderate/severe PAD patients (; ). 2.2.Optical MeasurementsA hybrid diffuse optical device was built and employed to assess blood flow and oxygenation in muscle.20 The DCS module uses a continuous-wave, long-coherence length 785-nm laser (CrystaLaser Inc., Reno, Nevada). Four photon-counting avalanche photodiodes (PerkinElmer, Canada) feed a four-channel autocorrelator board (Correlator.com, Bridgewater, New Jersey) that computes the temporal intensity autocorrelation function () of collected light. The NIRS module employs three laser diodes in the near-infrared (685, 785, and 830 nm; Thorlabs, Newton, New Jersey). The laser diodes are amplitude modulated at 70 MHz. Light collected from the tissue was delivered to four photomultiplier tubes (PMTs; Hamamatsu Corp., Japan), and the PMT signals were bandpass filtered, amplified, demodulated, and digitized. A laptop computer controlled both DCS and NIRS modules and recorded data. Two optical switches (Dicon Fiberoptics, Richmond, California) were employed to select among the four lasers (three from NIRS and one from DCS) and the three different source positions on the muscle. Optical data were acquired from 2 min prior to the start of the task (baseline period) until 4 min after the task was finished (recovery period). The whole data acquisition cycle of NIRS and DCS took approximately 2.5 s. The optical probe was placed over the calf flexor in a region that covered approximately an area equivalent to a circle of 3.5 cm radius, similar to previous studies involving muscle (Fig. 1).20,21 The source-detector distance ranged from 0.5 to 3.8 cm, so that the depth probed was approximately 1.5 to 2.0 cm into the muscle. Black, rigid, plastic material was used to tightly hold the fibers in place, and elastic straps fixed the probe around the muscle to reduce motion artifacts during exercise. Fig. 1Schematics of the optical probe designed for the study, containing three laser sources, four detectors for tissue oxygen saturation (), and four detectors for relative blood flow (rBF). The probe covers an area of approximately on the calf flexor. The different source-detector distances range from 0.5 to 3.8 cm, and are combined to provide a single measure of and an average measure of rBF. 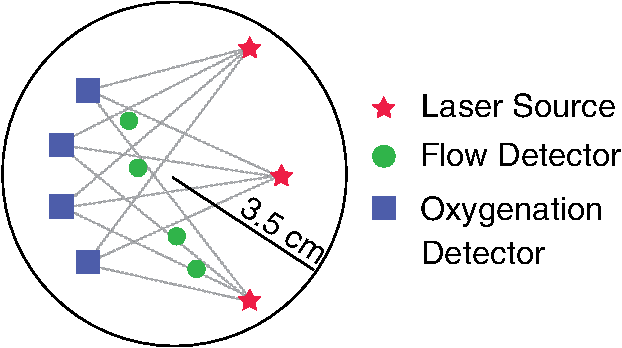 2.3.Optical Data AnalysisFor NIRS, the arrangement of optodes permitted continuous measurement of absolute absorption coefficients by calibrating the source and detector coupling coefficients with a self-calibrating approach.20 Absolute and Hb concentrations were then derived from the absorption coefficients.9 Total hemoglobin concentration (THC) and were estimated as and . For DCS, rBF changes were estimated from DCS data by extracting a BFI for each source-detector separation at each time point. (, where denotes the baseline period.) The BFI was estimated by fitting the measured intensity autocorrelation function to the solution of the photon correlation diffusion equation in the semi-infinite geometry with extrapolated zero boundary conditions.9,10 In this work, the diffusive motion model was used to approximate the mean-square particle displacement of the moving red blood cells in tissue and thus derive the BFI. The changes in the absorption coefficient at 785 nm measured by NIRS were used as input in the correlation diffusion equation. The goodness of fit was evaluated for each source-detector separation at each time point, and the decay curves that failed to fit the model (i.e., curves whose fitting residuals were higher than 75% of the mean residual over the entire time-series) were discarded from the analysis. For statistical analysis, changes in rBF were derived from changes just after exercise relative to the period prior to exercise and averaged over all source-detector separations. Figure 2 shows representative time courses of rBF and for two different subjects (one healthy control and one moderate/severe PAD patient) during both tasks. Although was also obtained during exercise, in order to maintain correspondence with DCS data, we only analyzed changes in the data before and after exercise. Fig. 2Representative time-courses of (top row) and rBF (bottom row) for a moderate/severe peripheral artery disease (PAD) patient and a healthy control for the treadmill (left column) and pedal (right column) exercises. The gray area indicates the duration of the exercise, while the up (down) arrow indicates the start (end) of the exercise. Note, was obtained before, during and after exercise, but rBF was accurately obtained only before and after exercise (due to motion artifacts that arise during exercise). The statistical analysis was performed for the period after cessation of the exercise, taking the period immediately before each exercise as the baseline. 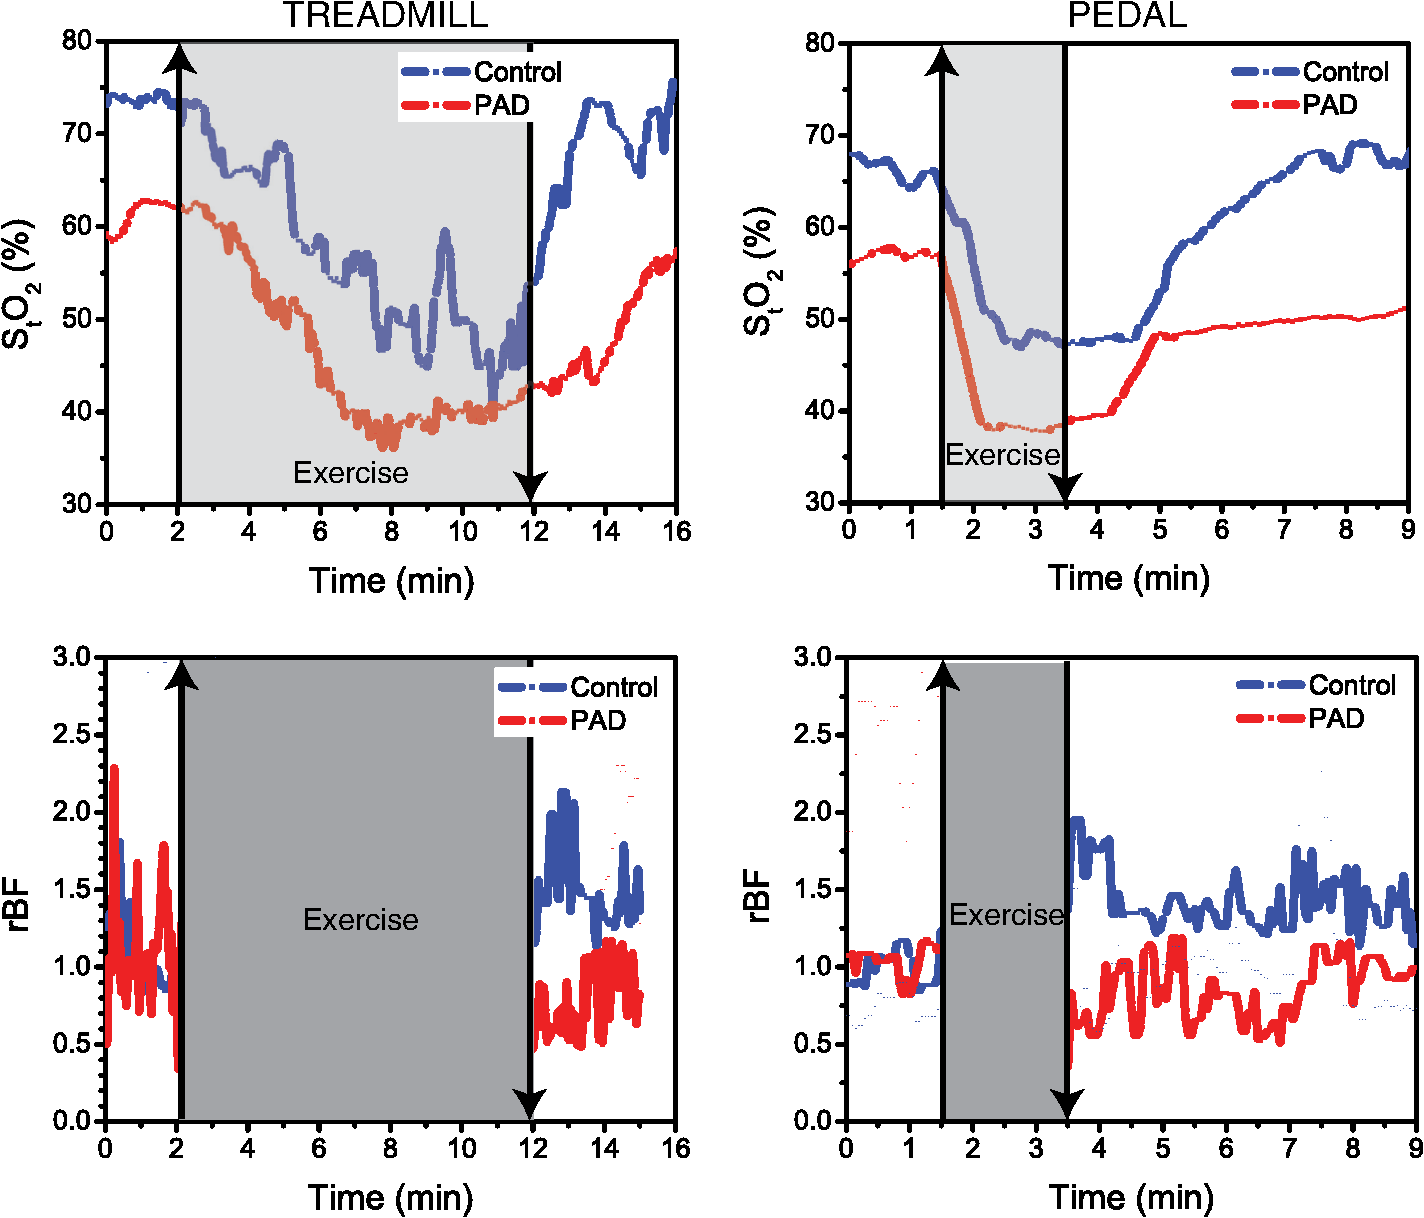 2.4.Statistical AnalysisThe baseline covariate data for each ABI group were summarized using the median and interquartile range (IQR) for continuous variables or counts (proportions) for categorical data. Kruskal-Wallis tests were used to assess differences in exercise times and the amount of power or work, defined as the product of the power and the length of exercise. Spearman’s correlation coefficient, , was used to measure the association between exercise times. To explore differences between healthy and PAD patients, mixed effects models were used as the basic tool to describe both pre-exercise means as well as post-exercise temporal patterns in rBF and (Ref. 28). The models for incorporated baseline mean levels for each individual as a covariate and allowed nonlinear changes over time; the models for rBF allowed either a constant rate or linear changes over time (see Appendix for details on model selection). While the model fits a continuous curve, we illustrate our results with means and 95% confidence intervals (95% CI) at specific time points (immediately post-exercise, 0.5, 1, and 3 min). We note that while data were potentially collected up until about 4 min post exercise, there was substantial missing data for some subjects toward the end of the collection period. Thus we chose to illustrate results for the first 3 min as the dataset is much more complete across subjects for this time period. Overall significance of the model was determined using a likelihood ratio test; contrasts between specific terms were based on Wald tests. -Values for pair-wise comparisons among ABI groups were adjusted using a Bonferroni correction. The mixed effects models explored differences among ABI groups in temporal patterns of and rBF, assuming that all individuals within an ABI group follow the same mean pattern over time. To relax this assumption, we analyzed the data using time to return to baseline as the outcome of interest. Because several individuals did not return to baseline by the end of our monitoring period, we estimated the median time to return to baseline levels using Kaplan-Meir methods, and then used a Cox model to test the hypothesis that differences in the relative risk, or equivalently, rate of returning to baseline are associated with ABI group or actual ABI value. In contrast with , individual traces for rBF often did not return to baseline over the measured post-exercise period, and, for some individuals, outlier values were not uncommon. Here, for each exercise, we used a Kruskal-Wallis test to determine whether there were differences in the extremes of the distribution of rBF among ABI groups. Specifically we examined the median proportion of post-exercise interval that the rBF measurements for an individual were either elevated ( fold baseline) or depressed ( baseline). This was done separately for the first 1.5 min (early) or 1.5 to 3.0 min (late) periods post-exercise. If the global test achieved significance () Bonferroni-adjusted pair-wise tests of significance were constructed using a Wilcoxon rank-sum test. Last we developed two models to explore the association between the three key variables measured in this study: ABI, , and rBF. The first, a linear model, considers an individual’s ABI as a function of mean and percent elevated or depressed post-exercise rBF as described above for the early or late time periods. The second, a Cox model, considers the relative rate of returning to baseline levels, as a function of ABI and these same percent elevated or percent depressed rBF variables. For purposes of brevity, we report only a single two-variable model for each outcome and exercise, with the rBF variable that achieved the highest level of significance in our analyses. All statistical analyses were carried out using either R 2.10 or R 2.15.29 3.Results3.1.Baseline CharacteristicsTable 1 shows baseline characteristics of the subjects. The ABI from healthy subjects ranged from 0.92 to 1.54, while patients with mild impairment presented with . The ABI for the moderate/severe patients ranged from 0.33 to 0.7. The moderate/severe group included 15 subjects whose median ABI of 0.62 corresponds to 56% of the median ABI in the healthy group. Table 1Subject characteristics. Values shown are medians [interquartile range (IQR)], except for race and gender, which show number of subjects [proportion of subjects for each ankle brachial index (ABI) group].
While the protocol specified a target length for the duration of each exercise, the healthy group tended to exercise longer because subjects with PAD often stopped when they felt muscle pain. For treadmill, healthy, mild, and moderate/severe PAD patients exercised for a median of 10.0, 4.0, and 4.2 min, respectively. For pedal, healthy controls exercised for a median of 1.9 min compared with a median of 1.4 and 1.5 min for the mild and moderate/severe PAD groups, respectively. Exercise times for the two tasks were significantly correlated (, ). For the pedal exercise, no significant differences in the distribution of work or power was observed among groups, noting that these variables were missing for five, two, and one subjects in the healthy, mild PAD and moderate/severe PAD groups, respectively ( for work, for power). Mean differed among groups pre-exercise (, Table 2). The mean (95% CI) for treadmill was 2.6% (0.4, 5.6%) higher than for pedal (). Before treadmill, the mean of 66.2% for the healthy group was 10.6% (3.5, 17.7%) and 9.3% (2.8, 15.9%) higher than the mild and moderate/severe PAD groups ( and 0.017, respectively). By contrast, the mild and the moderate/severe PAD patients differed by only 1%. Table 2Hemodynamic parameters (95% CI) pre- and post-exercise. The models for post-exercise tissue oxygen saturation (StO2) were adjusted for the pre-exercise mean for each subject. The values shown here are for a subject with the mean equal to the pre-exercise mean for that group.
3.2.Treadmill Exercise: Individual Trends in and rBFPre-exercise mean was strongly associated with post-exercise (). Figure 3 shows the estimated mean hemodynamic responses for each group. Strong evidence was found for an increase in over time (), but rates of increase did not differ significantly between groups. Fig. 3Model-based estimates of mean (95% CI) (top row) and rBF (bottom row) in healthy, mild, and moderate/severe subjects immediately, 0.5, 1.0, and 3.0 min post-treadmill exercise. For the top row, the dashed line is the pre-exercise mean for each group, and dotted lines are the 95% CI (top row, see Table 2 for values) or a value of 1.0 for rBF (bottom row).  Table 2 shows the estimated means at discrete time points, based on the fit of our model immediately following the treadmill exercise. Immediately post-exercise, mean was depressed to 56.9% (53.2, 60.6%) in the healthy group. Mean in the healthy controls exceeded by 11.7% (6.9, 16.5%, ) that of the mild PAD patients, and 16.6% (12.3, 20.9%, ) that of the moderate/severe PAD patients. The difference of 4.9% (, 10.1%) between the two PAD groups was not significant. Mean values in all groups gradually returned to the baseline mean for that group. Mean pre-exercise appears as a dashed line in Fig. 3, with 95% CI as a dotted line. The post-exercise mean for all three groups recovered to either their pre-exercise mean or near it, with the recovery appearing most rapid in healthy controls. Consistent with the patterns in Fig. 3, Table 3 shows that the median time for an individual to return to his/her pre-exercise level, as determined from the Kaplan-Meier method, ranged from 0.72 min for the healthy subjects to 1.68 min for the moderate/severe PAD patients. While the trend was consistent with that seen for the mean models (Fig. 3), differences in the rate of returning to baseline levels for the PAD and healthy subjects did not achieve statistical significance. Table 3Median time in minutes (95% CI) to return to pre-exercise mean StO2 along with relative rate (the hazard ratio) for returning to pre-exercise mean StO2 based on a Cox model; UD is undetermined based on the length of time followed. p-Values are shown for the Cox model comparing each peripheral artery disease (PAD) groups to healthy.
In contrast to , rBF differed among ABI groups post-exercise (), but temporal changes in blood flow during the 3-min post-exercise observation window were not detected. Healthy subjects and mild PAD patients showed pronounced elevation in rBF post-exercise with means (95% CI) of 1.45 (1.14, 1.84) and 1.78 (1.22, 2.60), respectively, while mean rBF in the moderate/severe PAD group of 0.80 (0.51, 1.11) did not differ from pre-exercise levels. Pairwise comparisons indicated that mean rBF in the moderate/severe PAD patients differed from healthy controls () and mild PAD patients (), but that mean rBF did not differ significantly between the healthy controls and the mild group. Table 4 examines the rBF data in terms of the proportion of the post-exercise period when rBF was reduced to 0.5 of baseline (percent depressed) or exceeded 1.5 of baseline (percent elevated). For treadmill, there were pronounced differences, particularly in percent elevated for both early () and late post-exercise periods (). Both healthy and mild PAD subjects had pronounced elevations in blood flow, with a median percent elevated of at least 45% during early and late post-exercise periods; in contrast, the median percent elevated for the moderate/severe group was 20% in the early post-exercise period and 7% in the late post-exercise period. Differences between groups in percent depressed were also significant in the early post-exercise period (); median percent depressed for healthy and mild subjects were zero compared to 5.9% for the moderate/severe group. Table 4Median (IQR) for percent of time when measurements of rBF for each subject were depressed (below 0.5 of baseline) or elevated (greater than 1.5 of baseline) either early (first 1.5 min) or late (1.5 to 3.0 min post exercise) post-exercise. p-Values are for the overall test of equality among groups; symbols indicate Bonferonni-adjusted pair-wise significance.
3.3.Treadmill Exercise: Associations Between ABI, , and rBFBecause ABI is widely used in the diagnosis and monitoring of PAD patients, we first assessed the extent to which characteristics of the post-exercise distribution of rBF added to the prediction of ABI, beyond what could be achieved with alone. Table 5 shows that mean in the treadmill post-exercise period was strongly correlated with ABI () but with not percent-depressed rBF. Other characteristics of the rBF distribution (e.g., median rBF or percent-elevated rBF) also showed no association (results not shown). We then modeled the relative rate of returning to baseline for as a function of ABI, and the percent-elevated rBF at the early post-exercise interval. In this two-variable model, the rate of return to baseline was not associated with ABI, and it was only marginally associated with percent elevated rBF (). Similar trends occurred for the later, 1.5 to 3.0 min, post-exercise period (not shown). Table 5Joint modeling of ABI and rate of StO2 return to baseline.
3.4.Pedal Exercise: Individual Trends in and rBFPre-exercise mean was strongly associated with post-exercise for pedal exercise (). Over time, increased significantly (), but the rate of increase did not differ among ABI groups. As with treadmill exercise, a pronounced depression in was observed, followed by recovery (Fig. 4 and Table 2). Immediately post-exercise, mean was 51.8% (47.9, 55.8%) in the healthy group. This value was 18.0%, (14.0, 22.2%, ) and 15.6% (10.3, 20.9%, ) higher than for the mild and moderate/severe PAD groups, respectively. The difference of 2.4% (, 8.2%) between mild and moderate/severe PAD groups was not significant. Fig. 4Model-based estimates of mean (95% CI) (top row) and rBF (bottom row) in healthy, mild, and moderate/severe subjects immediately 0.5, 1, and 3 min post pedal exercise. For the top row, the dashed line is the mean pre-exercise for each group (see Table 2 for values) and dotted lines are the 95% CI. For the bottom row (rBF), the dashed line is a value of 1.0.  Mean pre-exercise appears as a dashed line in Fig. 4, with 95% CI as a dotted line. The post-exercise mean for all three groups recovered to either their pre-exercise mean or near it, with the recovery appearing most rapid in healthy controls and slower in the two PAD groups. More formally, Table 3 shows that the median time to return to pre-exercise mean , as determined from the Kaplan-Meier method, was longer than for treadmill, ranging from 1.14 min for the healthy subjects to 3.32 min for the mild PAD patients. The relative risk of returning to baseline was a factor of 0.29 fold lower for mild patients compared with healthy subjects (), and 0.44 fold lower for moderate/severe patients compared with healthy subjects (). In contrast with the treadmill exercise, the mean rBF immediately post-pedal exercise did not differ significantly from 1.0 in any group. The healthy group essentially showed no change in rBF, with a mean of 1.08 (0.83, 1.40); mild and moderate/severe PAD groups showed slight, albeit nonsignificant depressions with means of 0.75 (0.49, 1.14) and 0.83 (0.58, 1.19), respectively. There was evidence of increases in post-pedal exercise mean rBF over time () and a suggestion of differences in post-pedal exercise mean rBF patterns among groups over time, although these differences did not achieve strict statistical significance ( overall). Table 4 shows that, for the pedal exercise, differences in the degree to which subjects displayed elevation or depression in rBF for either the early or late periods were more subtle than for treadmill. There were no differences among groups at either time interval in the percent elevated, with values ranging from 5.3% to 8.9% during the early post-exercise period, and from 7.1% to 17.5% for the later post-exercise period. Differences between groups in the percent depressed differed both in the early () and the late () time period. Notably, the moderate/severe group had median rates of percent depressed of 13.8% in the early post-exercise phase and 10.7% in the late post-exercise phase, in contrast with median rates of 0% for the healthy group. 3.5.Pedal Exercise: Associations Between in ABI, , and rBFTable 5 shows that, as with the treadmill exercise, mean in the pedal post-exercise period was strongly correlated with ABI (), but only marginally associated with rBF (). Other characteristics of the rBF distribution (e.g., median rBF or percent elevated rBF) showed no association with ABI (results not shown). In contrast with the treadmill exercise, the relative rate of return to baseline as the outcome was marginally associated with ABI (), with a 0.10 increase in ABI predicting a 1.10 fold increase in the rate of return to baseline. In the same model, a 10% decrease in percent-depressed rBF was associated with a 1.23 fold increase in the rate of returning to baseline (). Similar trends were found for the later, 1.5 to 3.0 min, post-exercise period (not shown). 4.DiscussionThis study employed diffuse optical methodologies to measure tissue hemodynamics before and after exercise in healthy subjects and patients with PAD. The optical techniques enable measurements of and rBF at the microvasculature level in the extremities. Previously, NIRS alone has been used to evaluate PAD by measurement of ,30–32 but the present study is the first report of optical blood flow measurements in a PAD cohort as well as the first report of all-optical measurements combining perfusion and tissue oxygenation in an exercising PAD cohort. Our results showed that baseline levels between healthy and PAD groups were significantly different, consistent with previous reports.31,32 The healthy group had significantly higher mean levels (64% to 66%), when compared with the PAD groups (53% to 57%). The lower oxygen saturation level likely reflects narrowing of vessels due to the disease and resulting tissue ischemia. NIRS clearly captures these physiological differences between the healthy and PAD groups. Within the PAD groups, however, levels were similar prior to exercise. The levels of immediately post-exercise were reduced but remained highest in the healthy group, and significantly lower in both PAD groups, independent of exercise type. The results showing reduced levels post-exercise in patients with PAD were consistent with observations in graded treadmill tests.31,32 The recovery to pre-exercise or near pre-exercise levels occurred in all groups. The relative rate of returning to baseline across groups was compared using a Cox model. Levels consistently rebounded most rapidly to pre-exercise levels in the healthy group with these trends achieving significance for the pedal exercise. These findings are also consistent with other NIRS studies in PAD patients.32,33 Measurements of rBF revealed differences in post-exercise dynamics for healthy and moderate/severe PAD groups. Over the range of 3 min post-exercise, mean rBF in the healthy group showed evidence of an increase, relative to baseline, at one or more post-exercise time points in both types of exercise. In contrast, for both the pedal and the treadmill exercises, it was impressive that rBF was severely blunted in the moderate/severe group. These results were most evident when considering the mean values, and the proportion of time that individuals spent with either elevated or depressed levels of rBF. For the treadmill exercise, it was most notable that moderate/severe PAD patients displayed no elevation in rBF in contrast to healthy and mild PAD patients. For the pedal exercise, it was most notable that the moderate/severe group was more likely to have depressed rBF. Compared with healthy controls, depressed rBF in the moderate/severe group is consistent with a severe deficit in the ability of these patients to respond to the metabolic demands of exercise. Last, for pedal exercise, an association was demonstrated between the rate of return to baseline in and depression in rBF. Reduced time with depressed rBF in the first 1.5 min post-exercise was associated with improved rates of return to baseline . This association was present after adjustment for ABI level, suggesting that rBF as measured through our DCS system adds information to our understanding of oxygenation rates in the PAD patients. This suggests that rBF measurements reflect important elements of PAD physiology that may be useful in monitoring PAD in future studies. A similar pattern was observed for treadmill, although in this case the association occurred with elevated rBF, and did not achieve strict statistical significance. The measured rBF changes from baseline ranged from to 250%. One might be tempted to compare these observations with those by ultrasound measurements of blood flow reserve (i.e., ultrasound measurements which compare flow during-exercise to flow at rest) of approximately 5 to 10 (Ref. 34), for example; the observed changes in our study appear generally lower. However, the blood flow reserve measured with ultrasound was calculated during exercise, while here we report rBF values measured at time-points 30 s and longer post-exercise. Within this post-exercise time window, the lower values we observe are quite consistent with an expected rapid decay in blood flow (e.g., with time constant of ) after cessation of exercise.35,36 Thus the optical flow measurements are not in disagreement with previous ultrasound flow reserve observations. While differences between healthy and moderate/severe PAD groups were evident in most cases, the mild group demonstrated intermediate behavior, showing similarities to healthy controls for treadmill, and similarities to the moderate/severe group for pedal. The relatively poor precision of the estimates for the mild group, as evidenced by wide confidence intervals, may reflect heterogeneity in the functionality of an intermediate group, with some patients behaving like healthy controls and others appearing more like serious PAD patients. Additionally, since the two PAD groups had fewer subjects than the control group, the precision of the estimates for the mean rBF value was reduced. The data reported here provide important information for guiding the design of further studies. This includes estimates of the precision of between-subject estimates of mean and rBF, the rates of return to baseline for and the rates of elevated and depressed rBF values. Since the present investigation is primarily a feasibility study, it employed the standard semi-infinite homogeneous medium approximation for analysis of the optical data,9 thus ignoring different tissue layers within muscle. In particular, differences in adipose tissue thickness may introduce inaccuracies that might also account for some of the variability within each group.37 We did not, however, find that the effect of body mass index (BMI), age and gender (all of which are related to adipose tissue thickness) altered the associations and results between ABI groups for either or rBF. Claudication often limited completion of exercise protocols in the mild and moderate/severe groups, particularly during the pedal exercise. For the analysis of mean and rBF post-exercise, we carried out sensitivity analyses to determine how our results might have been affected by exercise, work, age, BMI, and gender. No covariate achieved strict statistical significance, and our main conclusions were not altered by including these covariates. Nevertheless we acknowledge that we may have been underpowered to detect effects of these covariates. In particular the healthy group exercised longer than the PAD group so that the effects of longer exercise cannot be completely disentangled from PAD diagnosis in this study. Future studies should be designed to more carefully ensure that exercise regimens are consistent across subjects. The present study protocol did not include measurement of diffuse optical parameters during exercise due to possible artifacts generated from muscle movement. Further advancement in technology may allow for flow measurements during exercise, which could have significant diagnostic value. For example, demonstrated improvements in DCS data acquisition speed38,39 and in measurement gating during data acquisition at specific time points when muscle motion is minimal27 are two methodologies that could be employed for quasi-continuous measurements during exercise. Speedier acquisition can be achieved with use of a faster acquisition correlator board and averaging of signals from multiple detectors at the same position. In addition, future studies could also obtain absolute blood flow values by employing venous occlusion calibration of DCS measurements.27 The present study represents a first step toward this long-range goal by measuring the effects of two types of exercise with DCS flow measurements, albeit pre- and post-exercise. In summary, this study demonstrated the capability of diffuse optics to discriminate between moderate/severe PAD patients and healthy controls and demonstrated an association between rBF and levels following pedal exercise in subjects with large variation in ABI. The combined information obtained from DCS/NIRS may ultimately assist with diagnosis, prognosis, and optimization of treatment in patients with PAD. One potential application of the instrument is to evaluate interventions to treat PAD; the present study suggests that an intervention resulting in shortened time-to-return-to-baseline along with an increase in rBF are desirable for PAD patients. Furthermore, while the present study focuses on mean differences in response among groups, it may be possible in the future to monitor individual responses to therapy, providing personalized assessment of tailored therapies for this debilitating condition. AppendicesAppendix:Statistical Models forFor the baseline data, we fit a single mixed effects model to the combined treadmill and pedal data and compared means between ABI groups and between exercises. The assessment of change over time is more complex as the ABI groups potentially change in different ways. Here a separate model was fit for each exercise. The first step selected one of three models: Model 1 allowed differences among groups but no change over time; Model 2 allowed differences in ABI groups immediately post-exercise but then fit a common change over time; Model 3 allowed differences over time that varied among ABI groups. Nonlinear changes over time were incorporated using a regression spline; we explored different degrees of freedom, allowing different levels of curvature in the changes over time. Based on information criteria, we used a model with 2 deg of freedom for the data and a linear model for the rBF data. A random error term was allowed to vary among ABI groups, and an autoregressive (AR1) correlation structure allowed the correlation among repeated measurements to decay over time. Likelihood ratio tests were used to choose a model and to determine the global significance of differences among ABI groups. Significance was defined as a -value less than 0.05 and marginal significance of between 0.05 and 0.10 was noted. AcknowledgmentsThe authors thank Ms. Xingmei Wang for assistance with statistical analysis, and Regine Choe for helpful discussions and feedback. This work was supported by the National Institutes of Health (NIH) through R01-NS060653 (AGY), P41-RR002305 (AGY), and R21-HL083225 (GY), by the American Heart Association through BGIA #0665446U (GY), by the FundacioCellex Barcelona (TD) and by the São Paulo Research Foundation (FAPESP) through 2012/02500-8 (RCM). A portion of ERM’s salary was supported via NIH National Heart, Lung and Blood Institute grant K12 HL083772-01. Disclosures: Patent (USA Patent #8082015, “Optical measurement of tissue blood flow hemodynamics and oxygenation”) granted on diffuse correlation spectroscopy (Yodh, Yu, Durduran, Mohler). ReferencesE. Selvin and T. P. Erlinger,
“Prevalence of and risk factors for peripheral arterial disease in the United States: results from the National Health and Nutrition Examination Survey, 1999-2000,”
Circulation, 110
(6), 738
–743
(2004). http://dx.doi.org/10.1161/01.CIR.0000137913.26087.F0 CIRCAZ 0009-7322 Google Scholar
K. Ouriel,
“Peripheral arterial disease,”
Lancet, 358
(9289), 1257
–1264
(2001). http://dx.doi.org/10.1016/S0140-6736(01)06351-6 LANCAO 0140-6736 Google Scholar
M. T. Alzamora et al.,
“The peripheral arterial disease study (PERART/ARTPER): prevalence and risk factors in the general population,”
BMC Public Health, 10 38
(2010). http://dx.doi.org/10.1186/1471-2458-10-38 BPHMAJ 1471-2458 Google Scholar
L. Norgren et al.,
“Inter-society consensus for the management of peripheral arterial disease (TASC II),”
J. Vasc. Surg., 45
(Suppl.), S5A
–S67A
(2007). http://dx.doi.org/10.1016/j.jvs.2006.12.037 0741-5214 Google Scholar
A. W. Gardner et al.,
“Prediction of claudication pain from clinical measurements obtained at rest,”
Med. Sci. Sports Exerc., 24
(2), 163
–170
(1992). http://dx.doi.org/10.1249/00005768-199202000-00002 MSPEDA 0195-9131 Google Scholar
“Randomized placebo-controlled, double-blind trial of ketanserin in claudicants; changes in claudication distance and ankle systolic pressure,”
Circulation, 80
(6), 1544
–1548
(1989). http://dx.doi.org/10.1161/01.CIR.80.6.1544 CIRCAZ 0009-7322 Google Scholar
V. Aboyans et al.,
“Measurement and interpretation of the ankle-brachial index: a scientific statement from the American Heart Association,”
Circulation, 126
(24), 2890
–2909
(2012). http://dx.doi.org/10.1161/CIR.0b013e318276fbcb CIRCAZ 0009-7322 Google Scholar
W. Applegate,
“Ankle/arm blood pressure index: a useful test for clinical practice?,”
J. Am. Med. Assoc., 270
(4), 497
–498
(1993). http://dx.doi.org/10.1001/jama.1993.03510040101039 JAMAAP 0098-7484 Google Scholar
T. Durduran et al.,
“Diffuse optics for tissue monitoring and tomography,”
Rep. Prog. Phys., 73
(7), 076701
(2010). http://dx.doi.org/10.1088/0034-4885/73/7/076701 RPPHAG 0034-4885 Google Scholar
R. C. Mesquita et al.,
“Direct measurement of tissue blood flow & metabolism with diffuse optics,”
Philos. Trans. R. Soc. A, 369
(1955), 4390
–4406
(2011). http://dx.doi.org/10.1098/rsta.2011.0232 PTRMAD 1364-503X Google Scholar
M. Ferrari, M. Muthalib and V. Quaresma,
“The use of near-infrared spectroscopy in understanding skeletal muscle physiology: recent developments,”
Philos. Trans. R. Soc. A, 369
(1955), 4577
–4590
(2011). http://dx.doi.org/10.1098/rsta.2011.0230 PTRMAD 1364-503X Google Scholar
S. A. Carp et al.,
“Validation of diffuse correlation spectroscopy measurements of rodent cerebral blood flow with simultaneous arterial spin labeling MRI; towards MRI-optical continuous cerebral metabolic monitoring,”
Biomed. Opt. Express, 1
(2), 553
–565
(2010). http://dx.doi.org/10.1364/BOE.1.000553 BOEICL 2156-7085 Google Scholar
R. C. Mesquita et al.,
“Hemodynamic and metabolic diffuse optical monitoring in a mouse model of hindlimb ischemia,”
Biomed. Opt. Express, 1
(4), 1173
–1187
(2010). http://dx.doi.org/10.1364/BOE.1.001173 BOEICL 2156-7085 Google Scholar
C. Zhou et al.,
“Diffuse optical monitoring of hemodynamic changes in piglet brain with closed head injury,”
J. Biomed. Opt., 14
(3), 034015
(2009). http://dx.doi.org/10.1117/1.3146814 JBOPFO 1083-3668 Google Scholar
R. C. Mesquita et al.,
“Tumor blood flow differs between mouse strains: consequences for vasoresponse to photodynamic therapy,”
PLoS ONE, 7
(5), e37322
(2012). http://dx.doi.org/10.1371/journal.pone.0037322 1932-6203 Google Scholar
T. Durduran et al.,
“Transcranial optical monitoring of cerebrovascular hemodynamics in acute stroke patients,”
Opt. Express, 17
(5), 3384
–3902
(2009). http://dx.doi.org/10.1364/OE.17.003884 OPEXFF 1094-4087 Google Scholar
Y. Shang et al.,
“Cerebral monitoring during carotid endarterectomy using near-infrared diffuse optical spectroscopies and electroencephalogram,”
Phys. Med. Biol., 56
(10), 3015
–3032
(2011). http://dx.doi.org/10.1088/0031-9155/56/10/008 PHMBA7 0031-9155 Google Scholar
M. N. Kim et al.,
“Noninvasive measurement of cerebral blood flow and blood oxygenation using near-infrared and diffuse correlation spectroscopies in critically brain-injured adults,”
Neurocrit. Care, 12
(2), 173
–180
(2010). http://dx.doi.org/10.1007/s12028-009-9305-x NCEACB 1541-6933 Google Scholar
E. M. Buckley et al.,
“Cerebral hemodynamics in preterm infants during positional intervention measured with diffuse correlation spectroscopy and transcranial Doppler ultrasound,”
Opt. Express, 17
(15), 12571
–12581
(2009). http://dx.doi.org/10.1364/OE.17.012571 OPEXFF 1094-4087 Google Scholar
G. Yu et al.,
“Time dependent blood flow and oxygenation in human skeletal muscle measured with noninvasive near-infrared diffuse optical spectroscopies,”
J. Biomed. Opt., 10
(2), 024027
(2005). http://dx.doi.org/10.1117/1.1884603 JBOPFO 1083-3668 Google Scholar
G. Yu et al.,
“Validation of diffuse correlation spectroscopy for muscle blood flow with concurrent arterial spin labeled perfusion MRI,”
Opt. Express, 15
(3), 1064
–1075
(2007). http://dx.doi.org/10.1364/OE.15.001064 OPEXFF 1094-4087 Google Scholar
G. Yu et al.,
“Intraoperative evaluation of revascularization effect on ischemic muscle hemodynamics using near-infrared diffuse optical spectroscopies,”
J. Biomed. Opt., 16
(2), 027004
(2011). http://dx.doi.org/10.1117/1.3533320 JBOPFO 1083-3668 Google Scholar
Y. Shang et al.,
“Effects of muscle fiber motion on diffuse correlation spectroscopy blood flow measurements during exercise,”
Biomed. Opt. Express, 1
(2), 500
–511
(2010). http://dx.doi.org/10.1364/BOE.1.000500 BOEICL 2156-7085 Google Scholar
T. Durduran et al.,
“Diffuse optical measurement of blood flow in breast tumors,”
Opt. Lett., 30
(21), 2915
–2917
(2005). http://dx.doi.org/10.1364/OL.30.002915 OPLEDP 0146-9592 Google Scholar
W. R. Hiatt et al.,
“Clinical trials for claudication; assessment of exercise performance, functional status, and clinical end points,”
Circulation, 92
(3), 614
–621
(1995). http://dx.doi.org/10.1161/01.CIR.92.3.614 CIRCAZ 0009-7322 Google Scholar
R. B. Rutherford et al.,
“Recommended standards for reports dealing with lower extremity ischemia: revised version,”
J. Vasc. Surg., 26
(3), 517
–538
(1997). http://dx.doi.org/10.1016/S0741-5214(97)70045-4 0741-5214 Google Scholar
K. Gurley, Y. Shang and G. Yu,
“Noninvasive optical quantification of absolute blood flow, blood oxygenation, and oxygen consumption rate in exercising skeletal muscle,”
J. Biomed. Opt., 17
(7), 075010
(2012). http://dx.doi.org/10.1117/1.JBO.17.7.075010 JBOPFO 1083-3668 Google Scholar
J. C. Pinheiro and D. M. Bates, Mixed-Effects Models in S and S-Plus, 1st ed.Springer Verlag, New York, NY
(2000). Google Scholar
R. Core Team,
“R: a language and environment for statistical computing,”
(2013) http://www.R-project.org April ). 2013). Google Scholar
D. J. Wallace et al.,
“Results of a 95-subject human clinical trial for the diagnosis of peripheral vascular disease using a near-infrared frequency domain hemoglobin spectrometer,”
Proc. SPIE, 3597 300
–316
(1999). http://dx.doi.org/10.1117/12.356821 PSISDG 0277-786X Google Scholar
A. W. Gardner et al.,
“Calf muscle hemoglobin oxygen saturation characteristics and exercise performance in patients with intermittent claudication,”
J. Vasc. Surg., 48
(3), 644
–649
(2008). http://dx.doi.org/10.1016/j.jvs.2008.04.005 0741-5214 Google Scholar
M. Vardi and A. Nini,
“Near-infrared spectroscopy for evaluation of peripheral vascular disease: a systematic review of literature,”
Eur. J. Endovasc. Surg., 35
(1), 68
–74
(2008). http://dx.doi.org/10.1016/j.ejvs.2007.07.015 1078-5884 Google Scholar
T. Hamaoka et al.,
“Near-infrared spectroscopy/imaging for monitoring muscle oxygenation and oxidative metabolism in healthy and diseased humans,”
J. Biomed. Opt., 12
(6), 062105
(2007). http://dx.doi.org/10.1117/1.2805437 JBOPFO 1083-3668 Google Scholar
J. R. Lindner et al.,
“Limb stress-rest perfusion imaging with contrast ultrasound for the assessment of peripheral arterial disease severity,”
J. Am. Coll. Cardiol. Imag., 1
(3), 343
–350
(2008). http://dx.doi.org/10.1016/j.jcmg.2008.04.001 1936-878X Google Scholar
J. W. VanTeeffelen and S. S. Segal,
“Rapid dilation of arterioles with single contraction of hamster skeletal muscle,”
Am. J. Physiol. Heart Circ. Physiol., 290
(1), H119
–H127
(2005). http://dx.doi.org/10.1152/ajpheart.00197.2005 0363-6135 Google Scholar
L. F. Ferreira et al.,
“Temporal profile of rat skeletal muscle capillary haemodynamics during recovery from contractions,”
J. Physiol., 573
(3), 787
–797
(2006). http://dx.doi.org/10.1113/jphysiol.2006.104802 JPHYA7 0022-3751 Google Scholar
U. Wolf et al.,
“Mapping of hemodynamics on the human calf with near infrared spectroscopy and the influence of the adipose tissue thickness,”
Adv. Exp. Med. Biol., 510 225
–230
(2003). http://dx.doi.org/10.1007/978-1-4615-0205-0 AEMBAP 0065-2598 Google Scholar
G. Dietsche et al.,
“Fiber-based multispeckle detection for time-resolved diffusing-wave spectroscopy: characterization and application to blood flow detection in deep tissue,”
Appl. Opt., 46
(35), 8506
–8514
(2007). http://dx.doi.org/10.1364/AO.46.008506 APOPAI 0003-6935 Google Scholar
M. Belau et al.,
“Noninvasive observation of skeletal muscle contraction using near-infrared time-resolved reflectance and diffusing-wave spectroscopy,”
J. Biomed. Opt., 15
(5), 057007
(2010). http://dx.doi.org/10.1117/1.3503398 JBOPFO 1083-3668 Google Scholar
|
||||||||||||||||||||||||||||||||||||||||||||||||||||||||||||||||||||||||||||||||||||||||||||||||||||||||||||||||||||||||||||||||||||||||||||||||||||||||||||||||||||||||||||||||||||||||||||||||||||||||||||||||||||||||||||||||||||||||||||||||||||||||||||||


