
|
|
|
Laser speckle contrast imaging (LSCI) is a wide-field two-dimensional imaging technique capable of rapid mapping of dynamic blood flow within tissue beds in vivo.1 Due to its simple and cost-effective system setup, it has become a popular choice for preclinical and clinical applications in the monitoring of, for example, cerebral blood flow (e.g., Ref. 2), and skin tissue perfusion during wound healing (e.g., Ref. 3). In LSCI, a digital camera is often used to record the speckle (i.e., coherent interference) patterns formed by the coherent addition of scattered laser light propagating within tissue. The statistical properties of the speckle pattern are dependent on the coherence of the incident light and the tissue optical properties. For a perfused tissue, the motion of red blood cell (RBC) causes localized intensity fluctuations in the speckle pattern that can be analyzed with spatial,4 temporal,5 or combined spatiotemporal6 contrast algorithms to provide a dynamic blood perfusion map, indicating blood supply to the living tissue of interest. Although many great progresses have been made in recent years, the basic LSCI technique for imaging the dynamic blood perfusion has been largely unchanged from its original treatment.1,7 Consequently, many of its limitations still remain. One of the limitations has been its inability to optimally account for scattering from static tissue elements, leading to a difficulty in delineating the functional capillary flow within microcirculatory tissue beds in vivo. In this paper, we introduce a new motion enhanced LSCI (mLSCI) method for noninvasive imaging of blood flows, including capillary flows. Upon a laser beam shining into a static tissue, speckle pattern remains constant over time. However, dynamic speckle results when there are scattering particles that are in motion, e.g., RBC moving in patent blood vessels, leading to time-varying fluctuations in light intensity. Provided that the camera has sufficient temporal response to record the time-varying speckle, the spatial or temporal speckle contrast can be used to visualize the dynamic blood flow.1 In the case of temporal contrast method in which a series of frames are recorded over a time period of , the speckle contrast at pixel is calculated by5 to contrast the blood flow, where is the temporal standard deviation, is the mean intensity of pixel over frames, is the light intensity recorded by the camera at the ’th frame (). While efficient, this method (including spatial contrast approach) does not provide optimal treatment to suppress the background scattering signals from the static elements, leading to reduced visibility of small blood vessels, in particular the capillaries.In this study, we propose an alternative analysis method to contrast the blood flows. In this method, we first perform a division operation on adjacent images, i.e., . Because the diffuse reflectance of background static tissue recorded by the camera remains relatively constant, this operation of division emphasizes the scattering particles in motion. Then, we calculate the differences between two consecutive division images, , which eliminate or suppress the background signals due to static tissue elements on one hand and increase highlighting of fine changes between adjacent frames on the other. Finally, we use standard deviation to provide the blood flow contrast in the resulting mLSCI images where is the mean of difference images, .The schematic of experimental setup is shown in Fig. 1. A collimated beam from a diode laser is expanded and then uniformly illuminates the sample at an incident angle of from the tissue normal direction.8 The backscattered light from the sample is transmitted to a zoom lens (Zuiko, 75 to 150 mm, , Olympus, Japan) and then received by a fast complementary metal-oxide semiconductor camera (Basler A504k, Germany). The magnification of the system is carefully adjusted to meet the requirement of sampling the speckles for faithful LSCI analysis,9 providing a field of view of and a calibrated spatial resolution of . Fig. 1Schematic of mLSCI imaging system where LD is the 780 nm laser diode, EL is the beam expanding lens and ZL is the zoom lens.  To demonstrate the enhanced capability of the proposed method to visualize the dynamic blood flow, particularly the functioning capillaries, we imaged the blood perfusion within the ear flap of a mouse aged weeks. A photograph of the mouse ear is provided in the inset of Fig. 1 where the imaged area was near the ear edge. During experiments, the animal was anesthetized, and its external ear was gently attached to a plastic platform under the mLSCI system. The animal handling was in accordance with protocols approved by the University of Washington Institutional Animal Care and Use Committee. To investigate how the camera exposure time has an effect on the final mLSCI results, we captured the laser speckle images of the mouse ear at 250, 100, and 25 frames per second (fps), corresponding to the camera exposure times of 4, 10, and 40 ms, respectively. Temporal contrast [Eq. (1)] and motion enhanced contrast [Eq. (2)] in each case were then evaluated from 100 successive frames. The results are shown in Fig. 2. Fig. 2Resulting images from temporal contrast (top row) and the corresponding motion enhanced contrast (bottom row) for the exposure time of (a, d) 4 ms, (b, e) 10 ms, and (c, f) 40 ms, respectively. 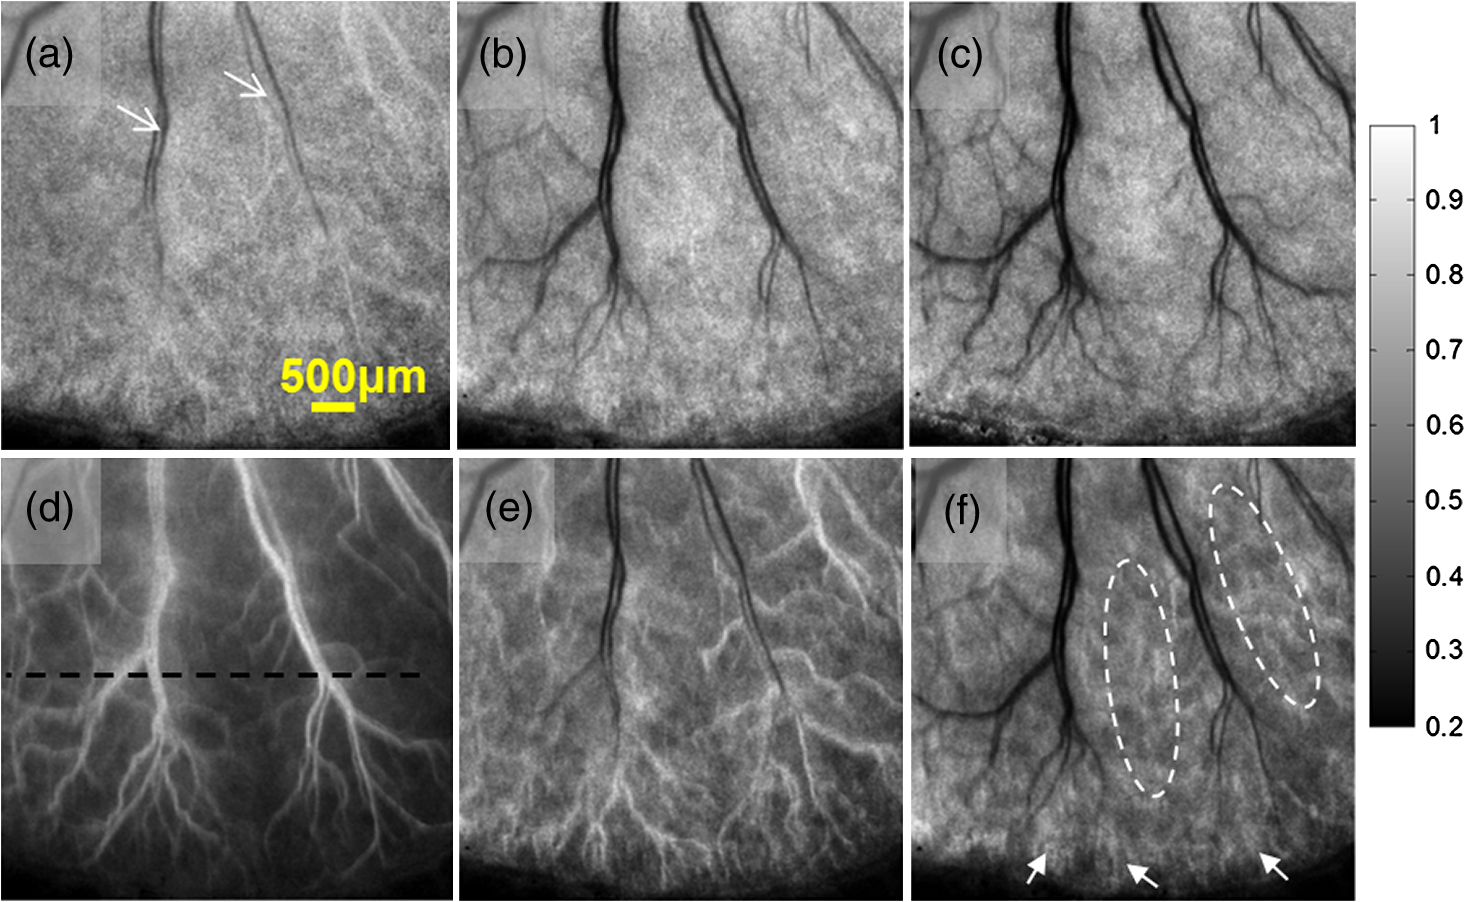 The images in the top row of Fig. 2 are the LSCI results of temporal contrast using the camera exposure time of (a) 4 ms, (b) 10 ms, and (c) 40 ms, respectively. At , it is difficult for LSCI to visualize the functional blood vessels apart from a few large vessels [shown by arrows in (a)] that are, however, seen with low imaging contrast. The visibility of the functioning vessels increases with the increase in the exposure time. At , the performance of LSCI imaging becomes the best. This observation is consistent with the prior LSCI conclusions where a long is required image blood flow within small vessels5,8 and even to visualize lymph flows.10 The images shown in the bottom row of Fig. 2 are the mLSCI results under the exposure time of (d) 4 ms, (e) 10 ms, and (f) 40 ms, respectively. Compared to the corresponding LSCI images, the enhanced capability of mLSCI to visualize the small blood vessels is clear because we now see more blood vessels being delineated. First, the contrast for functional blood vessels in mLSCI, appearing “white,” is opposite to that of LSCI. Second, it is observed that the sensitivity of mLSCI to the blood flow is highly dependent upon and therefore the velocity of the blood flow. Similar to LSCI, mLSCI has an increased sensitivity to the capillary flows with the increase in . At , the true capillary beds [arrows and circles in (f)] are accessible in mLSCI, albeit with a relatively low visibility. The low visibility is due to the spatial resolution of the system , while the average diameter of capillary vessels is μm. Theoretically, the sensitivity of LSCI to changes in blood flow depends on the exposure time and speckle correlation time.4,11–14 A higher sensitivity can be achieved with a longer exposure time to sense the slower blood flows that give rise to an increased decorrelation time. Under the conditions of single scattering from moving particles, small scattering angles, and strong tissue scattering, the correlation time is shown to be inversely proportional to the mean translational velocity of the scatters.13 Thus, scattering particles with slow motion correspond to longer correlation time , which explains why the temporal contrast can obtain the blood flow in small vessels under longer exposure time.10 However, a longer exposure time is equivalent to more temporal averaging, leading to a blurred speckle pattern, which in turn reduces the imaging contrast for the fine and fast dynamic changes in the blood vessels. However, for mLSCI, it emphasizes the motion discontinuity and sparseness of scattering particles. The “whiter” the blood vessel, the higher the degree of the motion discontinuity in the corresponding functional vessel. The main scattering particles in the vessels are RBCs, which are sparse when compared to the light wavelength used. When one RBC moves from one pixel to another pixel, the strength of the signal recorded in the previous pixel will gradually reduce until the next RBC that comes to fill in again. This filling time interval depends on the moving velocity and the density of RBCs within vessels. If the sampling rate is fast enough, this kind of motion discontinuity can be revealed, giving higher imaging contrast for functional vessels as seen in Fig. 2. With the increase in the camera exposure time, the “white” vessels are observed gradually shifting to the branch vessels downstream from the large ones. This phenomenon can be explained from the point of view of the moving velocity of scattering particles. The maximum speed that mLSCI can track is at the situation when one particle travels from one pixel to another within the exposure time and its previous position is filled by another particle at next moment. For example, if the spatial resolution of one pixel is 10 μm and the exposure time is 4 ms, the maximum moving velocity of scattering particle that can be tracked is then under the assumption of single scattering. However, the blood flow within the capillaries in the mouse ear is much slower than . Such slow motion would be frozen at the sampling rate of 250 Hz. Consequently, would only be sensitive to the fast blood flows in the large blood vessels as seen in Fig. 2(d). When the increases to 40 ms, the maximum velocity of moving particles which can be tracked becomes . This would be sufficient to contrast the capillary flows as shown in Fig. 2(f) where the true capillary beds, e.g., those indicated by the arrows and circles, are visualized. However, under this circumstance, the fast flows would cause signal washout in the camera, giving the darker contrast in the resulting mLSCI image. The intermittent exposure time gives the contrast of the blood flow in functional vessels in between those delineated by and 40 ms [see Fig. 2(e)]. To compare further, one horizontal line was chosen [the black line in Fig. 2(d)] to plot, in Fig. 3, the resulted contrast curves, where the comparison was made between the motion contrast under and the temporal contrast under . It is most interesting to observe that the peaks in exactly correspond to the valleys of , and the curves are opposite to each other, indicating that the motion enhanced contrast maximally suppresses the static scattering effect thanks to its subtraction operation between adjacent division frames. Although opposite, the similarity between the two curves implies that the sensitivity of the motion contrast under is comparable with that of temporal contrast under , demonstrating the dramatically improved capability of mLSCI to image the functional blood flows within microcirculatory tissue beds in vivo. The repeatability of this observation, and thus the conclusion, was validated on a number of mice in vivo (). Fig. 3Comparison of motion-enhanced contrast ) with the temporal contrast () along the horizontal dashed line in Fig. 2(d).  In summary, we have introduced a speckle motion enhanced contrast analysis method to visualize the dynamic blood flows, including capillary beds in vivo, where simple division and subtraction are applied in the adjacent frames. The sensitivity of the proposed method to the blood flow is highly dependent upon the exposure time of the digital camera. Further refinement of the technology is required to optimize the camera exposure time with which to monitor the hemodynamics within a selective group of blood vessels, down to true capillary beds. AcknowledgmentsThis work was supported in part by research grants from the National Institutes of Health (Grant Nos. R01HL093140, R01HL093140S, R01EB009682, and R01DC01201) and China Scholarship Council. ReferencesD. A. BoasA. K. Dunn,
“Laser speckle contrast imaging in biomedical optics,”
J. Biomed. Opt., 15
(1), 011109
(2010). http://dx.doi.org/10.1117/1.3285504 JBOPFO 1083-3668 Google Scholar
A. B. Parthasarathyet al.,
“Laser speckle contrast imaging of cerebral blood flow in humans during neurosurgery: a pilot clinical study,”
J. Biomed. Opt., 15
(6), 066030
(2010). http://dx.doi.org/10.1117/1.3526368 JBOPFO 1083-3668 Google Scholar
J. Qinet al.,
“Fast synchronized dual-wavelength laser speckle imaging system for monitoring hemodynamic changes in a stroke mouse model,”
Opt. Lett., 37
(19), 4005
–4007
(2012). http://dx.doi.org/10.1364/OL.37.004005 OPLEDP 0146-9592 Google Scholar
J. D. BriersS. Webster,
“Quasi real-time digital version of single-exposure speckle photography for full-field monitoring of velocity or flow fields,”
Opt. Commun., 116
(1–3), 36
–42
(1995). http://dx.doi.org/10.1016/0030-4018(95)00042-7 OPCOB8 0030-4018 Google Scholar
H. Chenget al.,
“Modified laser speckle imaging method with improved spatial resolution,”
J. Biomed. Opt., 8
(3), 559
–564
(2003). http://dx.doi.org/10.1117/1.1578089 JBOPFO 1083-3668 Google Scholar
K.R. Forresteret al.,
“Comparison of laser speckle and laser Doppler perfusion imaging: measurement in human skin and rabbit articular tissue,”
Med. Biol. Eng. Comput., 40
(6), 687
–697
(2002). http://dx.doi.org/10.1007/BF02345307 MBECDY 0140-0118 Google Scholar
J. D. BriersG. RichardsX. W. He,
“Capillary blood flow monitoring using laser speckle contrast analysis (LASCA),”
J. Biomed. Opt., 4
(1), 164
–175
(1999). http://dx.doi.org/10.1117/1.429903 JBOPFO 1083-3668 Google Scholar
A. K. Dunnet al.,
“Simultaneous imaging of total cerebral hemoglobin concentration, oxygenation, and blood flow during functional activation,”
Opt. Lett., 28
(1), 28
–30
(2003). http://dx.doi.org/10.1364/OL.28.000028 OPLEDP 0146-9592 Google Scholar
S. J. KirkpatrickD. D. DuncanE. M. Wells-Gray,
“Detrimental effects of speckle-pixel size matching in laser speckle contrast imaging,”
Opt. Lett., 33
(24), 2886
–2888
(2008). http://dx.doi.org/10.1364/OL.33.002886 OPLEDP 0146-9592 Google Scholar
V. Kalchenkoet al.,
“In vivo dynamic light scattering imaging of blood coagulation,”
J. Biomed. Opt., 12
(5), 052002
(2007). http://dx.doi.org/10.1117/1.2778695 JBOPFO 1083-3668 Google Scholar
A. B. Parthasarathyet al.,
“Robust flow measurement with multi-exposure speckle imaging,”
Opt. Express, 16
(3), 1975
–1989
(2008). http://dx.doi.org/10.1364/OE.16.001975 OPEXFF 1094-4087 Google Scholar
S. Yuanet al.,
“Determination of optimal exposure time for imaging of blood flow changes with laser speckle contrast imaging,”
Appl. Opt., 44
(10), 1823
–1830
(2005). http://dx.doi.org/10.1364/AO.44.001823 APOPAI 0003-6935 Google Scholar
R. BonnerP. Nossal,
“Model for laser Doppler measurements of blood flow in tissue,”
Appl. Opt., 20
(12), 2097
–2107
(1981). http://dx.doi.org/10.1364/AO.20.002097 APOPAI 0003-6935 Google Scholar
P. Liet al.,
“Imaging cerebral blood flow through the intact rat skull with temporal laser speckle imaging,”
Opt. Lett., 31
(12), 1824
–1826
(2006). http://dx.doi.org/10.1364/OL.31.001824 OPLEDP 0146-9592 Google Scholar
|


