|
|
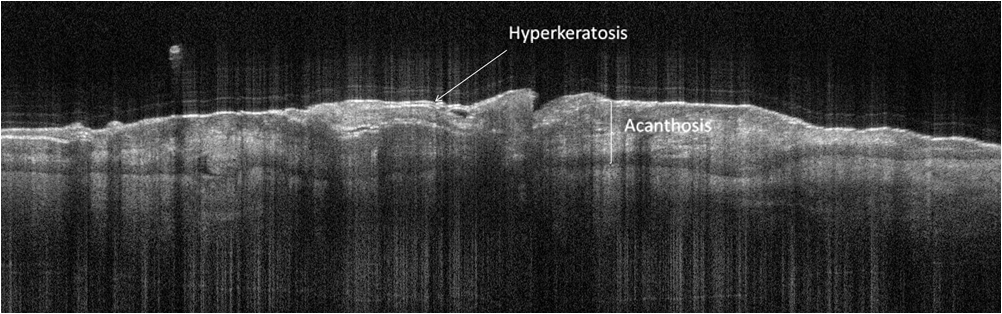
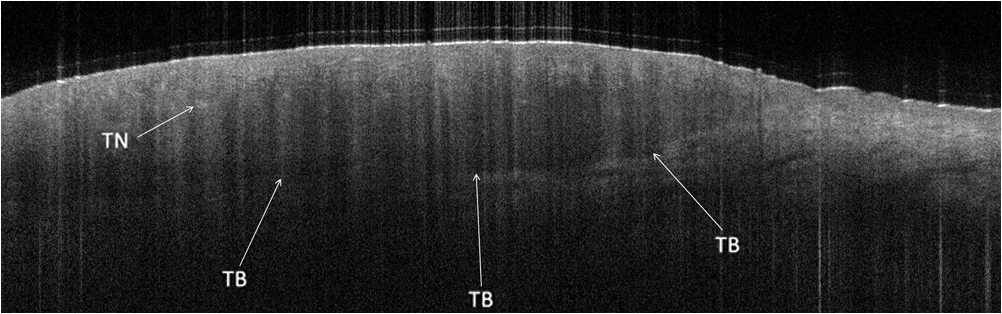
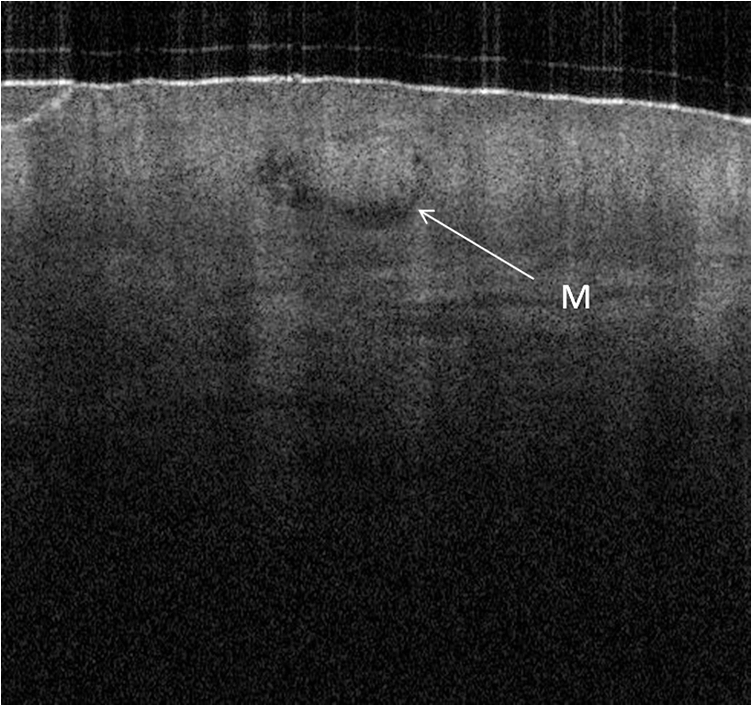
1.IntroductionAlthough histopathology is still considered the gold standard for the morphological evaluation of the skin, noninvasive imaging techniques such as optical coherence tomography (OCT), confocal laser scan microscopy, high-frequency ultrasound, and multiphoton spectrometry are increasingly becoming a focus of interest. Compared with histopathologic investigation, they share several advantages: (1) they are noninvasive, allowing a view of the unaltered morphology of structures in vivo without iatrogenic trauma; (2) they are quick, providing results for the doctor and patient in real-time; (3) they are repeatable, allowing follow-up evaluations of precisely the same site over time, as well as quantification of skin changes and enabling the study of therapeutic effects. Due to continuous technical improvements, OCT is now able to offer a view into the superficial layers of the skin with a lateral resolution of 3 to 7.5 μm, which has led to a broadened spectrum of useful applications. In dermatology, OCT can be used for the investigation of skin tumors and inflammatory diseases, for quantification of skin changes and for evaluation of treatment effects.1–7 This review will give an overview of both the technology and indications for OCT and then provide a comparison against other imaging modalities. 2.PrincipleOCT is an interferometric imaging method. Often implemented using fiber optics, light is split into a probe and a reference beam. The probe beam—focusing on the area of interest in the skin—is backscattered and then remixed with the reference beam. If both beams match within the coherence length of the light, interference will occur; therefore the axial resolution depends on the bandwidth and coherence length of the light, while the lateral resolution is determined by the focusing objective. To optimize the axial resolution, broadband light sources are used, as the spectral bandwidth is indirectly proportional to the depth resolution. In tissue, light can generally penetrate further at longer wavelengths, dependent on the scattering and absorption properties of the sample. For example, a wavelength of 1300 nm allows a deeper penetration depth compared to one of 930 nm, but at the expense of a lower axial resolution.8 The signal-to-noise ratio, describing the weakest signal backscattered that can be distinguished from noise, gives a measure for the sensitivity of an OCT system. Values above 100 dB can be reached. As known from ultrasound, a single depth profile is called an a-scan. These can be combined by laterally scanning the beam to form two-dimensional (2-D) -scans, and three-dimensional (3-D) blocks of the tissue can be achieved by lateral and depth scanning within seconds.9 In addition to the morphologic features, information on dynamic changes can be gained from the effects of mechanical compression on the formation of OCT images.10 By applying different methods for processing of the OCT images, such as calculation of scattering or attenuation coefficients11 or image analysis of signal distribution, more information can be extracted from the native OCT images. All this can help to differentiate between healthy and pathologic tissue or can be used for other indications like monitoring of drug delivery.11 3.TechniqueTo measure the interference, two different techniques are available: the time domain technique and the frequency or spectral domain technique. While time domain technique uses a scanning reference mirror to detect the reflectivity profile along the -axis in depth, in the frequency or spectral domain technique the entire spectrum, and therefore the entire depth, is analyzed simultaneously with respect to a static reference mirror, leading to an increased sensitivity and a higher image acquisition speed. To reconstruct the sample depth scattering profile, an inverse Fourier transformation is applied to the signal. In so called swept-source OCT systems, scanning is performed with a narrow line width swept laser, with the spectral component encoded in time rather than spatially, with the width of the sweep analogous to the bandwidth of the light source.12,13 3.1.SpeedThe image acquisition time with respect to the a-scan rate is a function of the variation speed of the reference mirror in the time domain technique, while in frequency domain OCT, it depends on the camera speed in the detection spectrometer or on the rate of sweep of the laser. According to the design of scanning and focusing, the field of view of OCT reaches a lateral image dimension of up to 10 mm and a depth of about 1 to 2 mm into the skin, depending on the light source and detector system. This way OCT allows the detection of architectural details within the tissue, but lacks the resolution of single cells in skin. 3.2.OCT Systems3.2.1.Several different OCT systems are availableThe OCT system Callisto by Thorlabs AG (Lübeck, Germany) is a frequency domain OCT and works at 930 nm. It offers a lateral scan length of 10 mm; the detection depth is about 1.6 mm measured from the skin surface, and the axial resolution lies below 7 μm in skin, while the lateral resolution lies around 8 μm at focus. The swept-source frequency domain OCT system VivoSight by Michelson Diagnostics Ltd. (Orpinton, United Kingdom) holds a medical CE mark and works at 1305 nm. The field of view is , and the depth is about 1.5 to 2 mm. The lateral resolution is enhanced to smaller than 7.5 μm due to simultaneous multiple beams focusing at different depths within the sample. The axial resolution is better than 10 μm. The time domain OCT system SKINTELL by AGFA HealthCare (Mortsel, Belgium) also holds a medical CE mark and provides 2-D images of and a penetration depth of less than 0.5 mm. This system natively collects en face images, which can be reconstructed into conventional -mode images. It offers a high axial resolution of about 3 μm and a just as high lateral resolution of about 3 μm, which is provided by continuous focus tracking. This is achieved by moving the optics synchronously with the reference arm, which keeps the coherence plane and the focal plane always in the same depth position. For this technique, application of a gel for index matching is recommended. Another time domain OCT system was developed in the Institute of Applied Physics RAS and is commercially available from BioMed-Tech Ltd. It operates at a central wavelength of 910 nm with a spectral width of 50 nm and corresponding axial and transversal spatial resolutions of 15 and 25 μm in air, respectively.10 4.IndicationsAs in all imaging techniques, in order to be able to appreciate changes in diseased skin, the knowledge of the appearance of healthy skin is indispensable. 4.1.Normal Human SkinOCT demonstrates clearly the layered structure of healthy skin (Fig. 1). The stratum corneum manifests as a split entrance signal visible as two thin lines. On the palms and soles, where the stratum corneum is much thicker, it presents as the first wavy, signal intense layer. The epidermis is slightly less signal-intense. The dermo-epidermal junction and the stratum papillare of the upper dermis are again more signal intense, while the reticular dermis offers a less intense signal. Fig. 1OCT image of healthy skin of the forearm imaged by the VivoSight device (). The entrance signal of the Stratum corneum presents as two thin lines (center arrow), the epidermis (E) below offers a little less intense signal. The right arrow shows the level of the dermo-epidermal junction (DEJ), and further in the depths the dermis (D) gives a more intense signal again. Also vessels in the papillary dermis (V) and hair follicles (HF) are visible.  The nail unit can also be investigated by OCT. The healthy nail plate appears as well demarcated structure, presenting mostly with signal rich parallel layers, in some cases with a granular pattern.14 Differences in scattering caused by different structures and components within the tissue, and differences in thicknesses of layers and scattering can be used to quantify acanthosis, atrophy, or oedema.15–19 4.2.Skin Tumors4.2.1.Nonmelanoma skin cancerEpithelial skin tumors such as basal cell carcinoma (BCC) and actinic keratoses (AK) are the prime examples of indications for OCT. BCC show characteristic tumor conglomerates with a signal-intensity similar to the one of the epidermis. Superficial tumor nests derive from the epidermis, while deeper parts of the BCC are sharply demarcated from the dermis by a dark line, correlating to the surrounding fibrous stroma (Figs. 2Fig. 3Fig. 4 to 5).20 Typically the tumor is accompanied by enlarged blood vessels.21–25 Fig. 2OCT image of a BCC with superficial and deeper tumor islands (arrow) captured with the Callisto device ().  Fig. 5OCT image of the same BCC (arrow) imaged by the SKINTELL system, in the en face section mode (horizontal section, ). 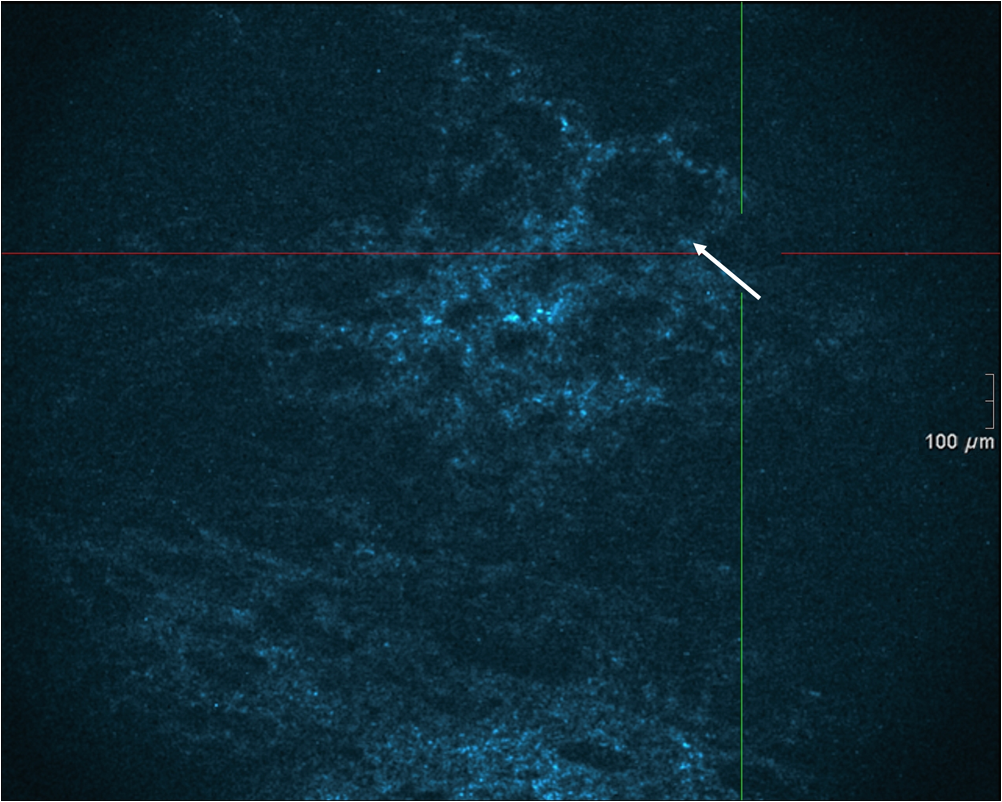 Actinic keratoses are characterized by a thickening and a stronger scattering of the stratum corneum due to parakeratosis (Fig. 6).26 The entire epidermis appears thicker, but the demarcation to the dermis is still detectable.27 In contrast, in invasive squamous cell carcinoma (SCC), the infiltration of tumor cells into the dermis leads to a loss of the dark line normally representing the dermo-epidermal junction. In cases of severe hyperkeratosis in AK and SCC, a signal shadow is produced that can disguise the tumor below. 4.2.2.Melanoma and Benign Pigmented TumorsDue to the melanin within, pigmented lesions show an irregular scattering in OCT. The dermo-epidermal junction is visible in junctional nevi, together with an acantopapillomatosis, but can disappear in compound nevi. The dermo-epidermal junction is also not detectable in malignant melanoma, because of the infiltrative tumor growth (Fig. 7). As currently there are no firm specific features or characteristics to differentiate between benign pigmented nevi and malignant melanoma, OCT is not a suitable technique for a clear-cut diagnosis of pigmented lesions at this time.28 Yet in thin melanomas, OCT can be used to measure the tumor thickness, as the scattering within the tumors differs from the surrounding collagen fibers, and therefore the lower border in thin tumors is detectable.29,30 5.Other Indications5.1.Inflammatory DiseasesPsoriasis as well as eczema show a thickening of the stratum corneum and the epidermis. Inflammatory infiltration and oedema in the dermis lead to a lower scattering and blood vessels are dilated.31,32 In Darier’s disease, OCT can detect the acantholytic papules. In bullous autoimmune disease, such as pemphigus or bullous pemphigoid, the location of the depth of blistering—intra- or subepidermal—can be differentiated by OCT.33 In porokeratosis, the cornoid lamellae show typical features in OCT images. Also the changes in inflammatory skin diseases during treatment can be appreciated by OCT by measuring the thickness of layers and the signal attenuation coefficient. 5.2.Parasite InfestationParasites such as scabies mites, larva migrans, and hookworms can be detected by OCT.34 Scabies mites impress as signal strong structures below the stratum corneum with a burrow behind (Figs. 8 and 9). 5.3.NailsIn the investigation of diseased nails by OCT, leukonychia and onychomycosis lead to signal rich artifacts. Although the exhibition of several white lines and longish structures in onychomycosis shows a high sensitivity, specificity of this method is too low to replace other diagnostic methods.14,35 5.4.Quantification of Changes and Therapy MonitoringAdditionally, OCT offers a valuable tool for monitoring of therapeutical effects and quantification of skin changes, as shown in several studies of UV radiation therapy, steroid atrophy, wound healing, or nail hydration over time.36–38 Especially, when using nonsurgical treatment options such as imiquimod or photodynamic therapy, OCT can help to keep the chosen noninvasive approach, to avoid repetitive biopsies and to control the therapeutic efficacy.39 5.5.Comparison with Other Imaging MethodsAs with all imaging techniques, the principle of “the longer wave length offers deeper penetration, but always correlates with a lower resolution” still holds true. OCT is able to fill the gap between the other established methods, especially the gap between dermoscopy and ultrasound on one side and confocal laser scanning microscopy on the other end. Dermoscopy offers a 2-D image of the skin surface with a tenfold magnification, where diagnosis is based on specific patterns, depending on colors, differential structures, asymmetry of the lesion etc. It is well established for the differentiation of melanocytic tumors, but offers also specific patterns for most other skin tumors, which is useful for fast screening for melanoma and other skin cancers in everyday practice. High-frequency ultrasound—usually used around 20 MHz but available up to 100 MHz—is mainly used for the estimation of tumor thickness in melanoma to plan one-step excisions with guideline conform safety margins and helps to decide whether sentinel node excision should be performed at the same time. It can also be used for the evaluation of scleroderma and other indications. Its penetration depth lies around 8 mm for the 20 MHz sonography but of course resolution is much lower compared with OCT. OCT’s penetration depth lies around 1 to 2 mm depending on the device, but with the higher resolution as stated above, offering the wide range of indications described in this review. The confocal laser scanning microscopy offers the highest resolution comparable with histopathology (almost 1 μm), but at the expense of a limited penetration depth of only about 250 μm, allowing the evaluation of structures within the epidermis and down to the papillary dermis in great detail. Confocal laser scanning microscopy is especially helpful in the differentiation between benign melanocytic nevus or malignant melanoma, but helps also in nonmelanoma skin cancers and their precursor lesions and in several inflammatory skin diseases. Due to their different technical parameters and the consequently differing range of ideal indications, that of course do overlap, there is no wonder technique best for all indications. Rather the experience of the doctor to choose the ideal imaging device for each specific clinical question will help to profit by the complementation of the different techniques available. For comparison and to show how well the different methods complement each other, the following images (epiluminescence microscopy, confocal laser microscopy, and OCT) show the case of a 78-year-old man with a BCC on the neck (Figs. 10Fig. 11 to 12). Fig. 10Dermatoscopic image of a BCC, showing a typical vascular pattern for BCC with arborizing vessels and teleangiectasias (VivaCam, ). 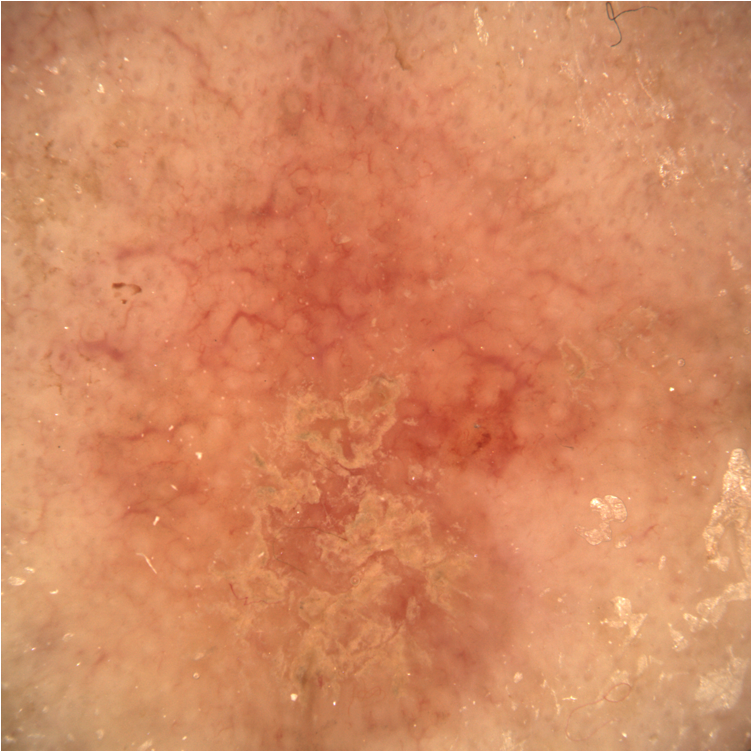 Fig. 11OCT image of the same BCC (arrow) as in Fig. 10. Typical tumor nest formation of the BCC can be seen (arrow) in whole and their location in correlation to other skin structures can be appreciated allowing more like an overview of the tumor (VivoSight, ).  Fig. 12CLSM image of the same BCC (arrows) as in Figs. 10 and 11 giving details on the tumor formations and offering the discrimination of tumor cells and surrounding fibrous stroma around the tumor nests (VivaScope, Mavig, ).  Therefore a combination of OCT with other imaging modalities—such as dermoscopy, confocal laser microscopy, or in the future perhaps multiphoton tomography or Raman spectroscopy—will lead to greater knowledge and better understanding of pathological and maybe even pathogenetic principles, will offer new diagnostic approaches, and will sustain the trend toward nonsurgical diagnostic methods and therapies.40–42 6.ConclusionThe prime indications for OCT are epithelial nonmelanoma skin cancers, especially BCC. Due to the typical features of this tumor entity, OCT allows a reliable differentiation of BCC from other clinical similar appearing lesions. The technique enables a fast detection of the tumor and the assessment of the infiltration depths as well as the lateral dimensions of the tumor. The usage of OCT is especially reasonable, if noninvasive therapies are applied, to avoid repetitive biopsies and to control the therapeutic efficacy. The same is true for actinic keratoses and SCC, where OCT can allow an estimation of infiltrative growth. Additionally, in inflammatory diseases quantification and monitoring can be performed over time. OCT nicely complements other established imaging techniques and fills a gap by offering images with a good balance between a sufficient depth and a high axial and lateral resolution. ReferencesT. GambichlerV. JaedickeS. Terras,
“Optical coherence tomography in dermatology: technical and clinical aspects,”
Arch. Dermatol. Res., 303
(7), 457
–473
(2011). http://dx.doi.org/10.1007/s00403-011-1152-x ADMFAU 0003-9187 Google Scholar
T. Gambichleret al.,
“Applications of optical coherence tomography in dermatology,”
J. Dermatol. Sci., 40
(2), 85
–94
(2005). http://dx.doi.org/10.1016/j.jdermsci.2005.07.006 JDSCEI 0923-1811 Google Scholar
D. Huanget al.,
“Optical coherence tomography,”
Science, 254
(5035), 1178
–1181
(1991). http://dx.doi.org/10.1126/science.1957169 SCIEAS 0036-8075 Google Scholar
M. C. Pierceet al.,
“Advances in optical coherence tomography imaging for dermatology,”
J. Invest. Dermatol., 123
(3), 458
–463
(2004). http://dx.doi.org/10.1111/jid.2004.123.issue-3 JIDEAE 0022-202X Google Scholar
A. M. Schmitt,
“Principles and application of optical coherent tomography in dermatology,”
Dermatology, 217
(1), 12
–13
(2008). http://dx.doi.org/10.1159/000118507 DERMEI 0742-3217 Google Scholar
J. Welzel,
“Optical coherence tomography in dermatology: a review,”
Skin Res. Technol., 7
(1), 1
–9
(2001). http://dx.doi.org/10.1034/j.1600-0846.2001.007001001.x 0909-752X Google Scholar
J. Welzelet al.,
“Optical coherence tomography of the human skin,”
J. Am. Acad. Dermatol., 37
(6), 958
–963
(1997). http://dx.doi.org/10.1016/S0190-9622(97)70072-0 JAADDB 0190-9622 Google Scholar
W. Drexler,
“Ultrahigh-resolution optical coherence tomography,”
J. Biomed. Opt., 9
(1), 47
–74
(2004). http://dx.doi.org/10.1117/1.1629679 JBOPFO 1083-3668 Google Scholar
A. Alexet al.,
“Multispectral in vivo three-dimensional optical coherence tomography of human skin,”
J. Biomed. Opt., 15
(2), 026025
(2010). http://dx.doi.org/10.1117/1.3400665 JBOPFO 1083-3668 Google Scholar
M. Y. KirillinP. D. AgrbaV. A. Kamensky,
“In vivo study of the effect of mechanical compression on formation of OCT images of human skin,”
J. Biophoton., 3
(12), 752
–758
(2010). http://dx.doi.org/10.1002/jbio.v3.12 JBOIBX 1864-063X Google Scholar
K. V. Larinet al.,
“Optical clearing for OCT image enhancement and in-depth monitoring of molecular diffusion,”
IEEE J. Sel. Top. Quant. Electron., 18
(3), 1244
–1259
(2012). http://dx.doi.org/10.1109/JSTQE.2011.2181991 IJSQEN 1077-260X Google Scholar
J. F. de Boeret al.,
“Improved signal-to-noise ratio in spectral-domain compared with time-domain optical coherence tomography,”
Opt. Lett., 28
(21), 2067
–2069
(2003). http://dx.doi.org/10.1364/OL.28.002067 OPLEDP 0146-9592 Google Scholar
R. LeitgebC. HitzenbergerA. Fercher,
“Performance of fourier domain vs. time domain optical coherence tomography,”
Opt. Express, 11
(8), 889
–894
(2003). http://dx.doi.org/10.1364/OE.11.000889 OPEXFF 1094-4087 Google Scholar
E. Sattleret al.,
“Confocal laser scanning microscopy, optical coherence tomography and transonychial water loss for in vivo investigation of nails,”
Br. J. Dermatol., 166
(4), 740
–746
(2012). http://dx.doi.org/10.1111/bjd.2012.166.issue-4 BJDEAZ 1365-2133 Google Scholar
F. G. Becharaet al.,
“Histomorphologic correlation with routine histology and optical coherence tomography,”
Skin Res. Technol., 10
(3), 169
–173
(2004). http://dx.doi.org/10.1111/j.1600-0846.2004.00038.x 0909-752X Google Scholar
M. CossmannJ. Welzel,
“Evaluation of the atrophogenic potential of different glucocorticoids using optical coherence tomography, 20-MHz ultrasound and profilometry; a double-blind, placebo-controlled trial,”
Br. J. Dermatol., 155
(4), 700
–706
(2006). http://dx.doi.org/10.1111/bjd.2006.155.issue-4 BJDEAZ 1365-2133 Google Scholar
T. Gambichleret al.,
“In vivo data of epidermal thickness evaluated by optical coherence tomography: effects of age, gender, skin type, and anatomic site,”
J. Dermatol. Sci., 44
(3), 145
–152
(2006). http://dx.doi.org/10.1016/j.jdermsci.2006.09.008 JDSCEI 0923-1811 Google Scholar
M. Mogensenet al.,
“Morphology and epidermal thickness of normal skin imaged by optical coherence tomography,”
Dermatology, 217
(1), 14
–20
(2008). http://dx.doi.org/10.1159/000118508 DERMEI 0742-3217 Google Scholar
J. Welzelet al.,
“Changes in function and morphology of normal human skin: evaluation using optical coherence tomography,”
Br. J. Dermatol., 150
(2), 220
–225
(2004). http://dx.doi.org/10.1111/bjd.2004.150.issue-2 BJDEAZ 1365-2133 Google Scholar
T. Hinzet al.,
“Preoperative characterization of basal cell carcinoma comparing tumor thickness measurement by optical coherence tomography, 20-MHz ultrasound and histopathology,”
Acta Derm. Venereol., 92
(2), 132
–137
(2012). http://dx.doi.org/10.2340/00015555-1231 ADVEA4 0001-5555 Google Scholar
T. Gambichleret al.,
“In vivo optical coherence tomography of basal cell carcinoma,”
J. Dermatol. Sci., 45
(3), 167
–173
(2007). http://dx.doi.org/10.1016/j.jdermsci.2006.11.012 JDSCEI 0923-1811 Google Scholar
M. Mogensenet al.,
“Assessment of optical coherence tomography imaging in the diagnosis of non-melanoma skin cancer and benign lesions versus normal skin: observer-blinded evaluation by dermatologists and pathologist,”
Dermatol. Surg., 35
(6), 965
–972
(2009). http://dx.doi.org/10.1111/j.1524-4725.2009.01164.x DESUFE 1076-0512 Google Scholar
M. Mogensenet al.,
“In vivo thickness measurement of basal cell carcinoma and actinic keratosis with optical coherence tomography and 20-MHz ultrasound,”
Br. J. Dermatol., 160
(5), 1026
–1033
(2009). http://dx.doi.org/10.1111/bjd.2009.160.issue-5 BJDEAZ 1365-2133 Google Scholar
J. M. Olmedoet al.,
“Correlation of thickness of basal cell carcinoma by optical coherence tomography in vivo and routine histologic findings: a pilot study,”
Dermatol. Surg., 33
(4), 421425
–425426
(2007). http://dx.doi.org/10.1111/dsu.2007.33.issue-4 DESUFE 1076-0512 Google Scholar
T. Maieret al.,
“Morphology of basal cell carcinoma in high definition optical coherence tomography: en-face and slice imaging mode, and comparison with histology,”
J. Eur. Acad. Dermatol. Venereol., 27
(1), e97
–e104
(2013). http://dx.doi.org/10.1111/j.1468-3083.2012.04551.x JEAVEQ 0926-9959 Google Scholar
M. Ulrichet al.,
“Noninvasive diagnostic tools for nonmelanoma skin cancer,”
Br J. Dermatol.,
(Suppl. 2), 56
–58
(2007). http://dx.doi.org/10.1111/j.1365-2133.2007.08275.x BJDEAZ 0007-0963 Google Scholar
V. R. Kordeet al.,
“Using optical coherence tomography to evaluate skin sun damage and precancer,”
Lasers Surg. Med., 39
(9), 687
–695
(2007). http://dx.doi.org/10.1002/(ISSN)1096-9101 LSMEDI 0196-8092 Google Scholar
T. Gambichleret al.,
“Characterization of benign and malignant melanocytic skin lesions using optical coherence tomography in vivo,”
J. Am. Acad. Dermatol., 57
(4), 629
–637
(2007). http://dx.doi.org/10.1016/j.jaad.2007.05.029 JAADDB 0190-9622 Google Scholar
T. Hinzet al.,
“Assessment of tumor thickness in melanocytic skin lesions: comparison of optical coherence tomography, 20-MHz ultrasound and histopathology,”
Dermatology, 223
(2), 161
–168
(2011). http://dx.doi.org/10.1159/000332845 DERMEI 0742-3217 Google Scholar
A. A. Marghoobet al.,
“Instruments and new technologies for the in vivo diagnosis of melanoma,”
J. Am. Acad. Dermatol., 49
(5), 777798
–797779
(2003). http://dx.doi.org/10.1016/S0190-9622(03)02470-8 JAADDB 0190-9622 Google Scholar
H. Morsyet al.,
“Optical coherence tomography imaging of psoriasis vulgaris: correlation with histology and disease severity,”
Arch. Dermatol. Res., 302
(2), 105
–111
(2010). http://dx.doi.org/10.1007/s00403-009-1000-4 ADMFAU 0003-9187 Google Scholar
J. WelzelM. BruhnsH. H. Wolff,
“Optical coherence tomography in contact dermatitis and psoriasis,”
Arch. Dermatol. Res., 295
(2), 50
–55
(2003). http://dx.doi.org/10.1007/s00403-003-0390-y ADMFAU 0003-9187 Google Scholar
M. Mogensenet al.,
“Optical coherence tomography imaging of bullous diseases,”
J. Eur. Acad. Dermatol. Venereol., 22
(12), 1458
–1464
(2008). http://dx.doi.org/10.1111/jdv.2008.22.issue-12 JEAVEQ 0926-9959 Google Scholar
H. Morsyet al.,
“Imaging of cutaneous larva migrans by optical coherence tomography,”
Travel Med. Infect. Dis., 5
(4), 243
–246
(2007). http://dx.doi.org/10.1016/j.tmaid.2006.12.004 1477-8939 Google Scholar
G. Rothmundet al.,
“Confocal laser scanning microscopy as a new valuable tool in the diagnosis of onychomycosis—comparison of six diagnostic methods,”
Mycoses, 56
(1), 47
–55
(2013). http://dx.doi.org/10.1111/j.1439-0507.2012.02198.x MYCSEU 1439-0507 Google Scholar
M. J. Cobbet al.,
“Noninvasive assessment of cutaneous wound healing using ultrahigh-resolution optical coherence tomography,”
J. Biomed. Opt., 11
(6), 064002
(2006). http://dx.doi.org/10.1117/1.2388152 JBOPFO 1083-3668 Google Scholar
T. Gambichleret al.,
“Acute skin alterations following ultraviolet radiation investigated by optical coherence tomography and histology,”
Arch. Dermatol. Res., 297
(5), 218
–225
(2005). http://dx.doi.org/10.1007/s00403-005-0604-6 ADMFAU 0003-9187 Google Scholar
S. Neerkenet al.,
“Characterization of age-related effects in human skin: A comparative study that applies confocal laser scanning microscopy and optical coherence tomography,”
J. Biomed. Opt., 9
(2), 274
–281
(2004). http://dx.doi.org/10.1117/1.1645795 JBOPFO 1083-3668 Google Scholar
L. ThemstrupM. MogensenG. B. E. Jemec,
“Optical coherence tomography used for monitoring of PDT treatment of superficial basal cell carcinomas,”
in 22nd World Congress of Dermatology,
(2011). Google Scholar
K. Königet al.,
“Clinical optical coherence tomography combined with multiphoton tomography of patients with skin diseases,”
J. Biophoton., 2
(6–7), 389
–397
(2009). http://dx.doi.org/10.1002/jbio.200910013 Google Scholar
C. A. Patilet al.,
“Combined Raman spectroscopy and optical coherence tomography device for tissue characterization,”
Opt. Lett., 33
(10), 1135
–1137
(2008). http://dx.doi.org/10.1364/OL.33.001135 OPLEDP 0146-9592 Google Scholar
J. Lademannet al.,
“Application of optical noninvasive methods in skin physiology: a comparison of laser scanning microscopy and optical coherent tomography with histological analysis,”
Skin Res. Technol., 13
(2), 119
–132
(2007). http://dx.doi.org/10.1111/srt.2007.13.issue-2 0909-752X Google Scholar
|