
|
|
1.IntroductionDiscrimination between healthy and pathological tissue is at the heart of medical diagnostics, where optical imaging can offer noninvasive affordable solutions for accessible organs, such as the skin and hollow organs.1,2 For example, diffuse optical tomography makes use of the modified light scattering and absorption properties of a pathological lesion to report on its location and abnormal physiological condition (manifested through, e.g., blood oxygenation, bilirubin concentration, etc.) at the centimeter-range depth from the surface.1 This technique also boasts enviable patient compliance. However, the poor spatial resolution and nonspecificity represent shortfalls of this technique.3 Labeling pathological lesions with molecular probes permits one to counter these shortfalls by rendering these lesions conspicuous, as has been recently demonstrated in a number of studies.4,5 Such a molecular probe comprises two functional modules: a targeting vector and a contrast agent. The targeting vector’s functionality requires high affinity and specificity for the targeted tissue site, such as cell receptors in the case of a cancerous lesion, and often employs peptide ligands or antibodies.3 One of the accepted targets for cancer diagnostics is the human epidermal growth factor receptor 2 (HER2/neu), which is overexpressed in a number of cancers and often accompanied by high drug resistance.6 Identification and precise localization of a cancerous lesion, which is characterized by a high density of HER2/neu using patient-compliant optical means, can aid diagnostic and therapeutic decisions. A recombinant scFv4D5 mini-antibody is an example of such a high-efficiency HER2/neu-targeting vector that represents a single chain variable fragment of immunoglobulin (Ig) and exhibits lower cross-reactivity and immunogenicity in comparison with the corresponding full-size antibody.7 The use of contrast agents, exploiting their fluorescent or, more generally, luminescent properties, is widespread in biomedical optical imaging. These luminescent molecular probes allow high-sensitivity and high-resolution imaging, since the absorbed excitation light is re-emitted as luminescence in a different spectral band, which can be spectrally discriminated from the excitation light and also from intrinsic tissue fluorescence termed autofluorescence. Despite a number of successful applications of these molecular probes in many areas of the life sciences, several challenges limit their application scope in, e.g., in vivo biomedical optical imaging. First, the vast majority of luminescent molecular probes is excited by light in the ultraviolet (UV) or visible spectral ranges, while the emitted luminescence signal is detectable in the visible spectral range, where both excitation and emission light are strongly absorbed and scattered by biological tissues. Second, the exposure of live biological tissue to light in this spectral range induces autofluorescence due to its constituent endogenous (intrinsic) fluorophores. Both the luminescence of the exogenous (extraneously introduced) molecular probes and biotissue autofluorescence are shifted to longer wavelength (Stokes shift). Although signals generated by the luminescent molecular probe and the autofluorescence background are separable using spectral methods, the practical efficiency of these approaches is limited.8 Several other shortfalls that impede the widespread implementation of the luminescent agents include toxic effects (quantum dots) and poor thermal and photochemical stability (green fluorescent protein, red fluorescent protein, luciferase-mediated bioluminescence).9,10 Moreover, long-term excitation radiation of the luminescent probes in UV or visible spectral ranges can cause tissue photodamage.9 A recent breakthrough in synthetic chemistry has resulted in a highly efficient luminescent nanomaterial termed upconversion nanoparticles (UCNPs).11 The most popular type of UCNPs is an nanocrystal codoped with ytterbium (Yb) and erbium (Er) lanthanide ions (short-hand notation, , Er). The absorbed photon energy conversion in UCNPs occurs through complex multistage processes that include conversion of two or more near-infrared (near-IR) excitation photons (typically, at wavelength 980 nm) to higher-energy emission in the visible and near-IR spectral range. The dominant absorber in the nanocrystal matrix is Yb.12 An Yb ion effectively absorbs near-IR optical radiation and transfers the excitation energy nonradiatively to neighboring Yb, which in turn passes the excitation to the next Yb, until this energy is absorbed by an Er ion accompanied by its excitation to a metastable state. The excited Er and Yb coalesce to redistribute their total excitation energy, transferring the Er ion to a higher-energy level at the expense of the Yb ion returning to the ground energy level: this process is called upconversion. Thus, the Er ion is able to emit photons at higher energy than the near-IR excitation photons. The main advantages of the UCNPs in the context of optical biomedical imaging applications are as follows. The spectral bands of the excitation light (980 nm) and, partly, excited luminescence response, fall into the so-called biological tissue “transparency window” (650 to 1300 nm), where light penetration in tissue takes place with minimal absorption and scattering. The autofluorescence response of live biological tissue at this excitation wavelength is insignificant and very often undetectable. Furthermore, UCNP emission is spectrally shifted toward shorter wavelength (anti-Stokes shift), making spectral separation of the luminescence and autofluorescence signals easy and efficient.13 Moreover, the exceptionally long luminescence lifetime of UCNPs, measured in submilliseconds, lends itself to the implementation of an optical time-gated scheme that is capable of completely suppressing the short-lifetime autofluorescence background and scattered excitation light.14 The promise of UCNPs has recently been demonstrated by imaging UCNP-based biocomplexes in cell cultures and small animal models, which showed that the autofluorescence background was suppressed.15–19 For example, Zhan et al. have demonstrated labeling a HeLa cancer cell line with noncovalent conjugates of UCNP and anti-carcinoembryonic antigen (CEA)8 antibody followed by in vitro cell imaging. The anti-CEA8 is commonly used to immunologically detect the CEA, a cancer biomarker expressed on the surface of HeLa cells.18 In vivo optical imaging of U87MG human glioblastoma tumors in living nude mice was also reported by Xiong et al., where an arginine–glycine–asparatic peptide served as the targeting vector capable of specifically bind to integrin receptor overexpressed in the case of tumor angiogenesis.17 However, the feasibility of optical imaging in live human tissue assisted by UCNP-based molecular probes under the biologically safe laser excitation conditions remains largely unexplored. The evaluation of the possibility of UCNP-assisted optical imaging in the context of early-stage cancer diagnostics is the key goal of this study. To this end, we report on UCNP synthesis and characterization in-house, followed by surface polymer coating, which renders the particles stable in aqueous buffer colloids. A flexible modular design using a high-affinity molecular linker barstar:barnase (Bs:Bn) was instrumental to achieve bioconjugation of the UCNP to the targeting vector, resulting in a complex assembly of UCNP with scFv4D5 mini-antibody.6,20 Human breast adenocarcinoma cells SK-BR-3 overexpressing HER2/neu were target-labeled with the UCNP biocomplexes and imaged using epi-luminescence microscopy. Optical imaging of a compact cancer cell cluster (pertinent to cancer stage I) was simulated using our breast cancer cell model covered with an optical phantom that reproduced live breast tissue properties. The experimental imaging data enabled the theoretical evaluation of the feasibility of UCNP-assisted optical diagnostic imaging of a cancerous site in human breast tissue. The key advance of our work is quantitative modeling of the optical imaging of early-stage breast cancer, where all integral parts of our model, including nanoparticle specific immobilization on the cancer cells, optical tissue phantom, and optical imaging system, are well-controlled and characterized. This allows realistic evaluation of the feasibility of the optical imaging of an UCNP-labeled cancer lesion in vivo, albeit not in clinical, but in laboratory settings. 2.Materials and Methods2.1.Synthesis of UCNPsAll chemicals were purchased from Sigma–Aldrich (Germany). Nanoparticles of programmable size and crystal phase were grown from a solution of sodium metal salts and oleic acid in an oxygen-free atmosphere at elevated temperatures. The mixture of (0.78 mmol), (0.2 mmol), and (0.02 mmol) was refluxed in 70% trifluoroacetic acid (20 ml) for ca. 6 h. The resulting clear solution was cooled to room temperature and the solvent was evaporated. The obtained residue was dried under vacuum at 0.1 torr for 3 h and thoroughly ground in an agate mortar until a fine homogeneous powder was produced. This powder was mixed with sodium trifluoroacetate (2 mmol), oleic acid (6 ml), and 1-octadecene (6 ml) in a three-necked flask equipped with a thermometer and magnetic stirrer, and stirred at 100°C under vacuum for 30 min. The degased and water-free mixture was gradually heated to 290°C at a rate of and kept at this temperature for 45 min under an argon atmosphere. The temperature was then raised to 310°C for 70 min. Next, the solution was cooled, suspended in propanol-2 (130 ml), and centrifuged at 6000 rpm for 30 min (Z206A centrifuge, Hermle, Germany). The as-synthesized particles were washed with absolute ethanol four times and dried. The particles were then dissolved in chloroform (10 ml), precipitated with propanol-2 (50 ml), and centrifuged at 4000 rpm for 10 min twice. The final product was dried at room temperature.11 2.2.Protein Production and CharacterizationWe isolated and purified the Bn-scFv4D5 fusion protein, as described by Deyev et al.20 with slight modifications. Escherichia coli strain SB536 [, WG1, fhuA (ton ), hhoAB (SacII), shh] was transformed with the plasmid with the inserted Bs-coding moiety protecting bacterial cells from Bn cytotoxic effect. The transformants were then grown in YTPS broth (1% yeast extract, 1% trypton, 150 mM NaCl, 40 mM , 10 mM , 2 mM , , pH 7.5) at 37°C until the optical density at 560 nm wavelength () reached 0.6, and supplied with isopropyl -d-1-thiogalactopyranoside (1 mM) for 5-h lac promoter induction. The obtained biomass was harvested by centrifugation (Allegra 21R Centrifuge, Beckman Coulter, USA) and disintegrated on ice by sonication in a lysis buffer [5 mM tris(hydroxymethyl)aminomethane–hydrochloride (Tris–HCl), 40 mM , 500 mM NaCl, pH 8.2]. The extract was clarified by centrifugation and filtration through a membrane filter (220-nm pore size) and loaded onto a HiTrap nickel-nitrilotriacetic acid 1-ml column (GE Healthcare Worldwide). In order to remove the Bs inhibitor, the column was washed with urea solution (8 M), with subsequent refolding of the fusion protein by a linear urea concentration gradient (8–0 M). The refolded protein was then eluted by a 225-mM imidazole solution and transferred to a phosphate buffer (20 mM NaCl, 6.5 mM , 41 mM , pH 6.5) using a PD-10 desalting column (GE Healthcare Worldwide), and finally purified in a HiTrap SP-Sepharose Fast Flow 1-ml column (GE Healthcare Worldwide). Electrophoretic analysis of eluted fractions in polyacrylamide gel (12.5%) showed the Bn-scFv4D5 elution at 275 mM NaCl. The Bs C40A protein was produced using E. coli strain HB101 [ (gpt-proA)62 leu B6 glnV44 ara-14 galK2 lacY1 (mcrC-mrr) rpsL20 () xyl-5 mtl-1recA13], carrying pMT641 plasmid.6 The cells were cultivated in YTPS broth until the stationary growth phase, and then centrifuged, followed by re-suspension in cold lysis buffer [0.05 M Tris–HCl, 0.1 M NaCl, 10 mM ethylenediaminetetraacetic acid (EDTA), 10 mM dithiothreitol (DTT), pH 8.0]. The obtained solution was sonicated on ice with a 30% ammonium sulfate saturation for cell disruption followed by nucleic acid precipitation with poly(ethyleneimine). Further, the cell extract was clarified by centrifugation and Bs content was precipitated by 70% ammonium sulfate saturation. The resulting precipitate was dissolved in TD buffer (0.1 M Tris–HCl, 10 mM EDTA, 10 mM DTT, pH 8.0) and fractionated according to protein size in a Sephadex G-100 SuperFine column () equilibrated with TSDT buffer (0.02 M Tris–HCl, 0.02 M NaCl, 2 mM EDTA, 2 mM DTT, 0.05% Tween-20, pH 8.0). Finally, Bs was purified in a HiTrap Q-Sepharose Fast Flow 1-ml column (GE Healthcare Worldwide) equilibrated with TDG buffer (0.2 M Tris–HCl, 2 mM DTT, 10% glycerol, pH 8.0). Elution was performed with a NaCl concentration gradient. The Bs was identified by polyacrylamide gel (17%) electrophoresis. Ribonucleic activity of the recombinant protein, Bn-scFv4D5 was determined by the acid-insoluble ribonucleic acid (RNA) precipitation assay.21 40-μl dilutions (from 30 to 0.015 nM) of the analyzed protein in Tris–HCl buffer (0.125 M Tris–HCl, pH 8.5) were mixed with 160 μl yeast RNA aliquots () and allowed enzymatic RNA splitting at 37°C. After 15 min, the reaction was stopped by adding 6% chloric acid (200 μl) to the mixture at for 15 min. Nonreacted RNA substrate was removed by centrifugation (Eppendorf 5415D Centrifuge, Germany) and supernatants were analyzed for released nucleotide concentrations, which determine the . To estimate the Bs:Bn affinity, different Bs dilutions were added to a solution of Bn at a constant saturation concentration followed by the same measurements. In the last case, Bs concentration was inversely proportional to the . ScFv4D5-HER2/neu affinity was evaluated by using anti-human polyclonal antibodies. A 96-well flat-bottomed polystyrene plate was coated with a recombinant antigen prepared in coating buffer (0.1 M , 0.1 M , pH 9.2) at amounts of 8 and . After 1-h antigen absorption, the plate was washed with phosphate-buffered saline (PBS) and unsaturated surface-binding sites were blocked with a blocking solution [5% milk (Tesco, UK) in PBS, pH 7.4]. The Bn-scFv4D5 solved in PBS with Tween-20 (0.1%) was then added at different dilutions with a starting concentration of 5 nM. After 1 h of incubation with constant shaking in a rocker shaker, the plate was washed. To detect the immobilized Bn-scFv4D5, first, polyclonal rabbit-anti-human antibody and second, peroxidase-conjugated goat-anti-rabbit IgG were used with washing between the steps. For subsequent colorimetrical measurement 1,2-diaminobenzene (Sigma–Aldrich, Germany) (0.04%) with hydrogen peroxide (0.06%) in citric buffer ( citric acid, ·, pH 5) were added to the wells. The reaction was stopped by adding 2 M sulfuric acid (50 μl). The was read using a plate spectrophotometer (StatFax-2100, Awareness Technology, USA). The affinity constant () was calculated, as described by Beatty et al.22 with consideration of antibody monovalency using the following equation: where and are the total antibody concentrations, in the wells at OD-50′ and OD-50 for plates coated with total antigen concentrations of (8 ng) and (16 ng), respectively, and2.3.Bioconjugation of UCNPsThe as-synthesized UCNPs were coated with poly(maleic anhydride-alt-1-octadecene) amphiphilic polymer [PMAO (Sigma–Aldrich, Germany)], as described by Pellegrino et al.23 with slight modifications. 1,6-Diaminohexane (Serva, Germany) was added to cross-link the PMAO chains around the particles. In order to link the biomolecules to the UCNPs, the surface carboxylic groups of the PMAO shell were activated in a cold buffered aqueous solution with an excess of 1-ethyl-3-(3-dimethylaminopropyl)carbodiimide (EDC) and N-hydroxysulfosuccinimide (sulfo-NHS) cross-linkers (Sigma–Aldrich, Germany) under sonication. The nanoparticles were then washed from unreacted cross-linkers by centrifugation at 4°C, re-dispersed in cold Bs solution, and allowed to bind to Bs overnight. The unbound Bs molecules were removed from the solution by three centrifugation–re-suspension cycles, and the resultant product was stored in PBS. 2.4.Transmission Electron Microscopy (TEM)The UCNP and PMAO–UCNP solutions were diluted by -hexane and water, respectively, then sonicated and drop-casted onto a thin bar 300-mesh copper TEM grids, coated with 0.3% pioloform. After overnight drying in a desiccator at room temperature, the grids were imaged using a Philips CM10 TEM (Philips, Eindhoven, The Netherlands). ImageJ freeware was used for UCNP size distribution analysis. 2.5.Fourier Transform Infrared (FTIR) SpectroscopyPure PMAO was thoroughly ground and then pressed with KBr to form a tablet. The UCNP modified with PMAO was dried using a Savant SpeedVac Concentrator (France), then ground and pressed with KBr to form a tablet. FTIR spectra were recorded using an FTIR spectrophotometer (Varian 3100, USA). 2.6.PMAO–UCNP Emission SpectraThe PMAO–UCNP powder was placed in a custom-designed sample holder and illuminated with a 978-nm laser coupled to a multimode fiber that was butted against the sample. The emitted signal was recorded in transmission by a calibrated spectrometer (Ocean Optics, USA) prefiltered with a short-pass emission filter, wavelength cut-off 842 nm (Semrock, USA). 2.7.PMAO–UCNP Absolute Conversion Efficiency () MeasurementsThe measurements were performed in a calibrated integrating sphere setup as described previously.24 In short, an integrating sphere spatially integrates all radiant flux, thus absolute absorption and emission can be measured independent of scattering by the particles. The PMAO–UCNP in powder form was placed in a custom-made sample holder at one exit port of the integrating sphere and excited by 978-nm laser light delivered by a multimode optical fiber. Using appropriate filters and a photodiode placed at the perpendicular exit port of the sphere, both emitted power () and absorbed power () were measured over a large range of excitation intensities. was calculated according to the definition, [W/W]. 2.8.Cell LabelingHuman breast adenocarcinoma cells SK-BR-3 and Chinese hamster ovary cells CHO-K1 were purchased from American Type Culture Collection and cultured in RPMI 1640 medium (HyClone, USA) supplied with l-glutamine and 10% fetal bovine serum (HyClone, USA). The cells were seeded on 8-well glass slides at a concentration of ca. . After 24-h cultivation at in a -incubator (with 5% ), the cells were inactivated by 1% formaldehyde to prevent nonspecific UCNP internalization. Nonspecific binding of the particles to the glass slide was also eliminated by incubating the sample with a blocking agent [1% bovine serum albumin (Bio-Rad, USA) in PBS] for 1 h. The Bn-scFv4D5 solution (in PBS with 0.1% bovine serum albumin and 0.1% Tween-20) was then applied for targeting Bn through the scFv4D5-HER2/neu interaction. After 1 h of the incubation, the cells were rinsed with PBS and treated with the UCNP-Bs () colloid for 20 min. This time was considered to be sufficient to complete the formation of the UCNP-Bs:Bn-scFv4D5 complexes due to extremely high Bs:Bn affinity (). Next, the cells were washed several times to remove unbound UCNP-Bs. Finally, the cells were fixed in 4% formaldehyde in PBS and mounted between a microscope slide and a coverslip. The negative control cell line was used to prove that the binding of UCNPs to the cancer cells was not a result of physical adsorption of the Bn-scFv4D5. 2.9.Laser-Illuminated Inverted Epi-Luminescence MicroscopyA 978 nm diode laser (LD980-01CW, CXCH-Photonics, China) excitation was delivered to the sample plane of a wide-field inverted epi-luminescence microscope (Olympus IX70, Japan) via a Koehler illumination scheme. An oil-immersion objective (, NA 1.30, Olympus, Japan) was used for bright-field cell imaging. A long-working distance dry objective (, NA 0.45, Olympus, Japan) was employed for UCNP-assisted imaging through the phantom layers to simulate an in vivo imaging procedure. The sample plane was imaged using an electron-multiplying CCD [EMCCD (iXon DU-885, Andor, Northern Ireland)] camera. 2.10.Phantom FabricationMelted agarose–water solution (1.5%) (Promega, Spain) was mixed with absorbing dyes [Magenta (Royal Talens, Holland) and black Indian ink (Winsor & Newton, UK)] and submicron particles [ (Sigma–Aldrich, Germany)] to model the scattering properties of breast tissue.25 Uniformly thin and flat phantom layers were prepared by setting the warm agarose mixture between two glass plates spaced 0.4, 0.8, and 1.4 mm apart. 3.Results and Discussion3.1.Synthesis and Characterization of UCNP-Based Molecular ProbeWe designed, synthesized, and characterized a new molecular probe for cancer cell imaging. This comprised a contrast agent—an UCNP coated with an amphiphilic polymer—and a targeting vector—a mini-antibody raised against HER2/neu receptors. 3.1.1.UCNP synthesis and surface functionalizationThe UCNPs composed of were synthesized by performing a modified coordinate stabilization reaction, as described in Sec. 2. As-synthesized UCNPs were re-dispersed in -hexane by sonication and then imaged by TEM. The results of TEM imaging showed particles in size and predominantly hexagonal in shape, as presented in Fig. 1(a), left panel. The hexagonal shape of the particles indicates the beta-phase of the host crystallite , which is the most favorable for the energy transfer upconversion process and hence for improved , as demonstrated below.26 Fig. 1Characterization of upconversion nanoparticles surface-capped with amphiphilic polymer, PMAO. (a) Transmission electron microscopy imaging of as-synthesized (left panel) and PMAO-capped (right panel) UCNPs. Scale bar, 200 nm. Zoomed-in images of the UCNPs are shown in insets in the left top corners. Scale bar, 50 nm. Right panel, a PMAO polymer layer on an UCNP crystal is visualized as a granular structure that represents a supramolecular network of amphiphilic molecules. (b) Histogram of the hydrodynamic size distribution of PMAO–UCNP obtained by dynamic light scattering measurements. This distribution remained unchanged for at least 2 months. (c) Fourier-transform infrared spectra of PMAO–UCNP and pure PMAO. The peak analysis points to the formation of the PMAO shell around the particles. See text for more details.  The as-synthesized UCNPs coordinated with oleic acid hydrophobic moieties were surface-capped with PMAO (see Sec. 2 for details).23 Carboxylic groups of the PMAO that appeared as a result of the hydrolysis of anhydride functional groups became exposed outwards rendering UCNPs hydrophilic, i.e., stable in aqueous solutions. In addition, the hydrophilic terminals allowed covalent binding to biomolecules through the carboxylic groups. PMAO surface-capped nanoparticles were dispersed in water, sonicated, and imaged by TEM. As seen in Fig. 1(a), right panel, there was negligible change in the particle size during the surface capping procedure, as expected. At the same time, the polymer coating is seen as a supramolecular network of amphiphilic molecules juxtaposed on the core material and as thin layer fragments of low electron density [Fig. 1(a), right panel]. We also determined the mean hydrodynamic diameters of the PMAO–UCNP particles by means of dynamic light scattering (DLS), yielding [Fig. 1(b)], which corroborated the TEM size measurement, considering a size overestimation by DLS measurements. The produced aqueous colloid remained stable for at least 2 months, as confirmed by DLS measurements. The PMAO surface capping of UCNP altered its surface charge. Its zeta-potential was measured in water as in comparison to that of for the as-synthesized particles. The abundant surface carboxyl groups of the polymer layer were believed to build up this highly negative surface charge. FTIR spectroscopy of the PMAO surface-capped particles further confirmed the successful surface modification of the UCNP sample. The results of the comparative analysis of PMAO–UCNP and pure PMAO are presented in Fig. 1(c). C–H stretching of polymer groups at 2919 and appeared in both UCNP and PMAO–UCNP samples. The maleic anhydride ring spectral signature is of particular note. It featured two peaks at 1858 and in pure PMAO, which disappeared as a result of the hydrolysis upon the PMAO–UCNP transfer to water, with the corresponding anhydride ring opening and production of free carboxylic groups manifesting themselves at 1734 and .27,28 The hydrolysis of a certain number of anhydride groups in pure PMAO is known to display an FTIR peak at , which is present in Fig. 1(c).28 3.1.2.Photophysical properties of PMAO–UCNPOptical characterization of the excitation and emission properties of UCNP and, in particular, PMAO–UCNP was performed. The choice of PMAO–UCNP was primarily dictated by its improved in comparison with the as-synthesized UCNP. Additionally, the PMAO–UCNP exhibited excellent immunity to environmental and surface conditions, so that its emission properties measured in powder form remained the same both in solution and after bioconjugation. The emission spectrum of PMAO–UCNP powder was acquired using a calibrated spectrometer with excitation by a 978-nm laser [excitation intensity (), ], and is shown in Fig. 2(a). The spectrum featured three emission bands, which are known to result from the Er emission multiplets.11 These multiplets can be grouped into two (green and red) wavelength bands, as respectively color-coded in Fig. 2(a). Fig. 2Photophysical characteristics of the PMAO–UCNP. (a) Emission spectrum of the PMAO–UCNP powder featuring three (unresolved) emission multiplets grouped in green and red wavelength regions. Inset, left panel, a cuvette with UCNP aqueous colloid exhibiting high transparency; right panel, green-color emission along the 978-nm laser beam path captured under low ambient light condition. (b) Absolute conversion efficiency of PMAO–UCNP as a function of the excitation intensity at 978 nm, measured using a calibrated integrating sphere setup. The orange line is a guide to the eye, and saturation is reached at .  The optical absorption of the near-IR excitation light at 978 nm and the of UCNP determine the intensity of the emitted signal. The is defined as the ratio of the emitted power to the absorbed power measured in W/W. The emitted power depends nonlinearly on the since each emitted photon is a result of the absorption of two or more photons followed by nonradiative relaxation processes. At high values of approaching saturation, reaches a plateau. Measurement of the versus the is essential for the evaluation of UCNP-assisted imaging performance. In Fig. 2(b), the of PMAO–UCNP integrated over the entire emission spectrum is plotted versus . We note that the green-to-red emission ratio decreases as the is increased. of the PMAO–UCNP sample saturates at and reaches a maximum value of 1.2%. It is clear that the UCNP surface passivation coating affects and makes the coated UCNP much less susceptible to the environment and additional surface coating.29 Hence, bioconjugation of PMAO–UCNP, as described in the next section, was of only minor influence to the of the polymer-coated UCNPs. 3.2.Design, Production and Target Delivery of UCNP-Bioconjugates3.2.1.BioconjugationThe PMAO–UCNP was grafted with mini-antibodies, scFv4D5, designed for target delivery to cancer cells that overexpress specific receptors HER2/neu. PMAO–UCNP and scFv4D5 were linked using a high-affinity molecular pair .20,30 Bacterial ribonuclease Bn, and its inhibitor Bs, are small (12.4 and 10.2 kDa, respectively) proteins that are stable over a wide range of pH (from 2 to 12) and temperatures (50°C and 70°C, respectively), and have terminal groups accessible for covalent modifications and genetic fusion. A PMAO–UCNP bioconjugate was realized by its surface coating with Bs, thus forming the first submodule, while Bn was a part of the other submodule, which included an anti-HER2/neu scFv4D5 mini-antibody [Fig. 3(a) and 3(b)]. Fig. 3Cell labeling with UCNP-Bs:Bn-scFv4D5 biocomplexes. (a) Targeting vector, Bn-scFv4D5 gene construction. The gene is under the control of a lac promoter (lac p/o) and the ompA signal peptide, and includes the N-terminal FLAG tag (F), -linker- oriented scFv4D5 mini-antibody, hinge linker (16 amino acids), Bn, short spacer S (Gly-Ala-Pro), and C-terminal -tag, localized sequentially. Bs coexpression is under the control of its own constitutive promoter (p) and required to suppress the Bn cytotoxicity. (b) The concept of cell labeling with self-assembled UCNP biocomplexes UCNP-Bs:Bn-scFv4D5. (c) Epi-luminescence microscopy of the HER2/neu overexpressing SK-BR-3 cells labeled with UCNP-Bs:Bn-scFv4D5. Scale bar, 20 μm. (d) Three-dimensional surface plot of the luminescence signal acquired from the CHO-K1 and SK-BR-3 cells incubated with UCNP-Bs:Bn-scFv4D5. Although the labeled SK-BR-3 cells exhibited several discrete peaks due to UCNP biocomplex clusters, many more single and small clustered UCNP biocomplexes were also attached to these cells, resulting in higher overall signal level in between these peaks. 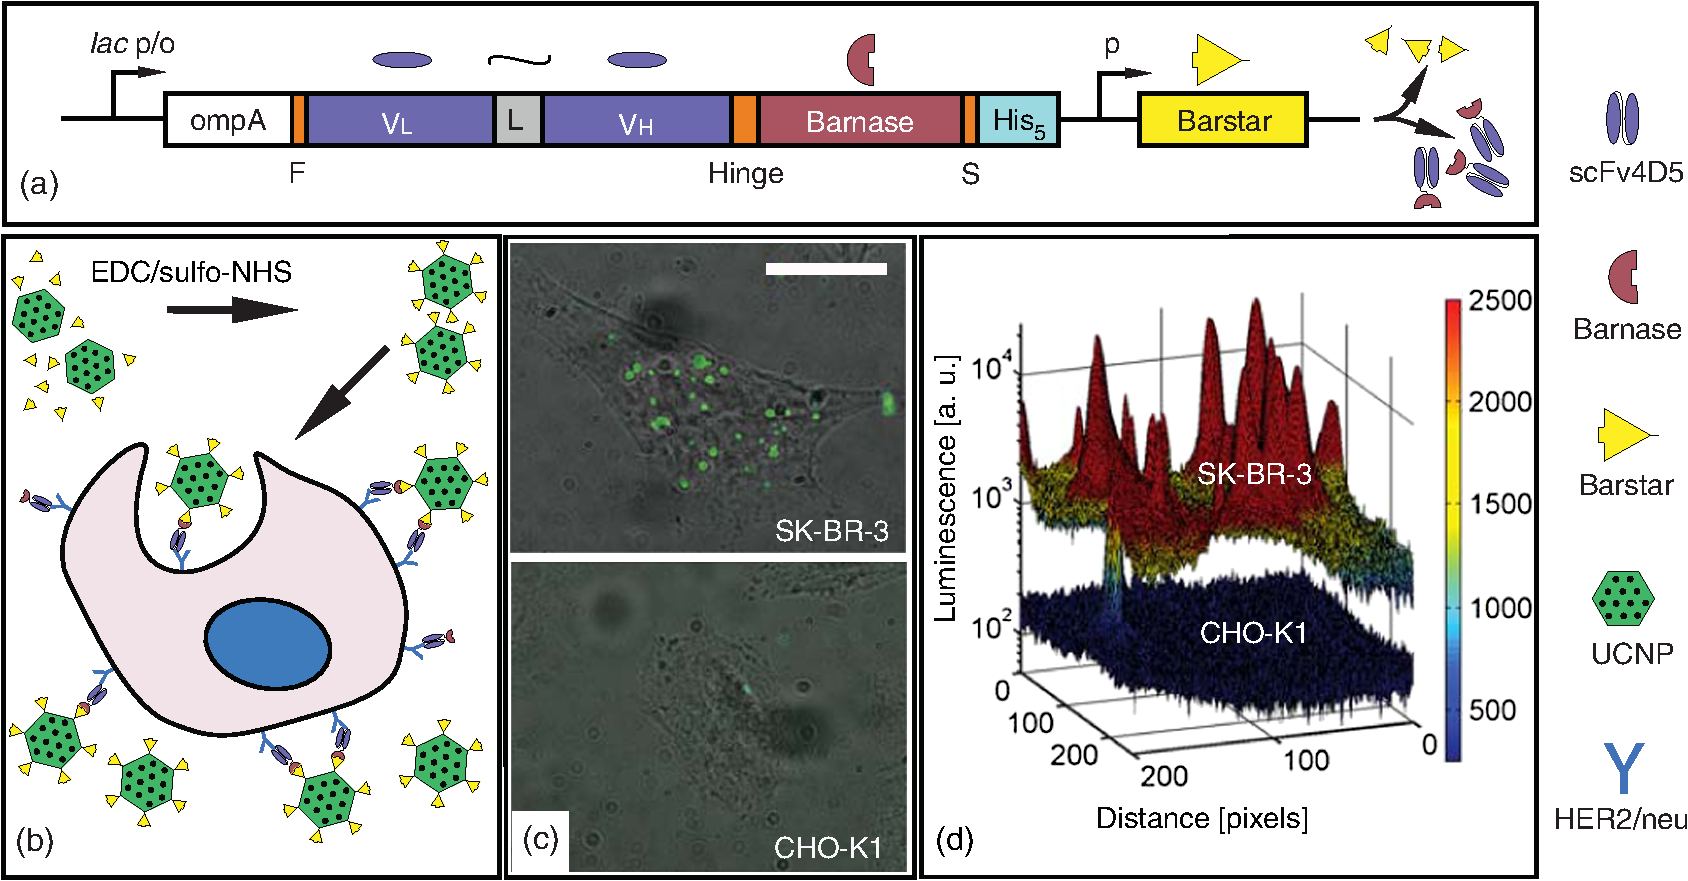 The Bs and Bn-scFv4D5 proteins were produced and characterized as described in Sec. 2. The Bs-binding ability of the Bn-scFv4D5 was proved by measurement of the Bn ribonucleic activity inhibition by Bs [Fig. 4(a)] and the Bn-scFv4D5-HER2/neu affinity constant was calculated from Fig. 4(b) to be [Eqs. (1) and (2)]. Fig. 4Functional characterization of the scFv4D5-Bn protein. (a) Assaying of Bn-scFv4D5 affinity to Bs through measurements of ribonucleic activity inhibition. (b) Determination of the Bn-scFv4D5 recombinant protein affinity to HER2/neu by enzyme-linked immunoassay (). Inset, electrophoresis gel profile of the Bn-scFv4D5 after two steps of the purification procedure: , protein marker; 1, affinity chromatography; and 2, ion-exchange chromatography. 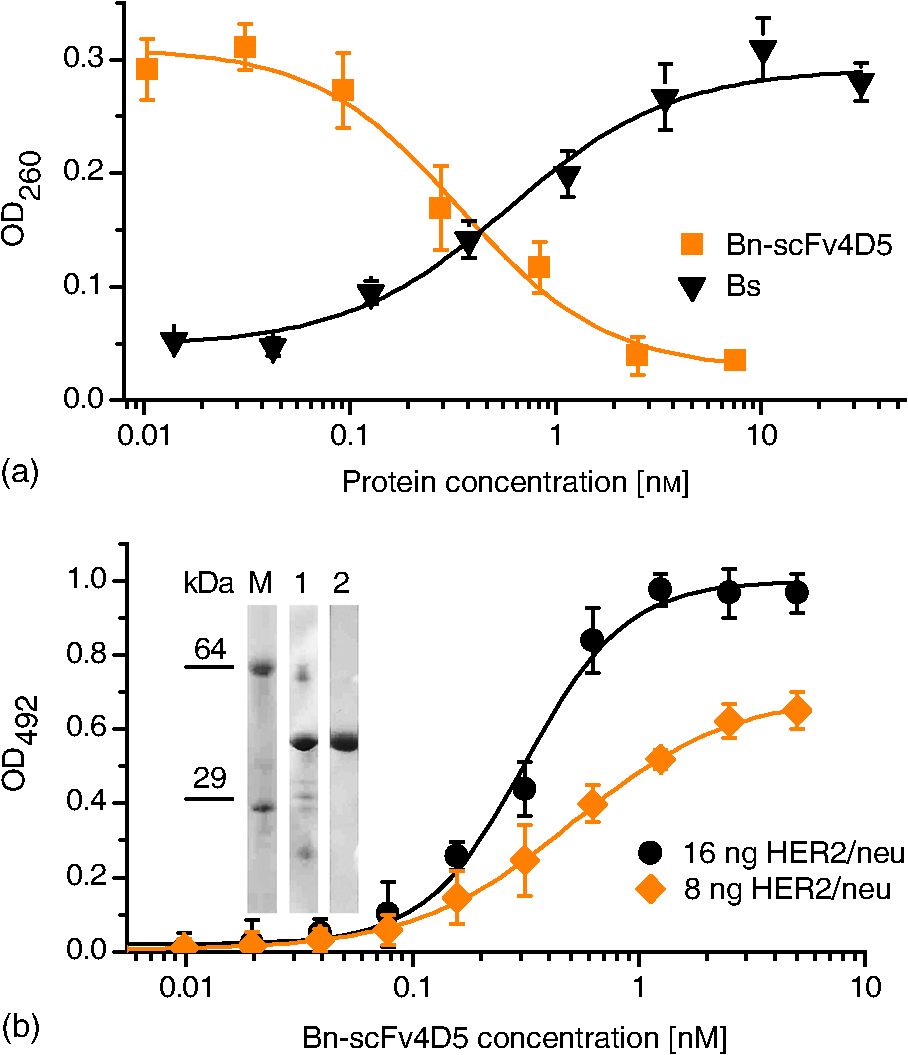 The PMAO–UCNP conjugation with Bs was implemented using a reaction with EDC and sulfo-NHS relying on the covalent linkage of the PMAO–UCNP carboxyl groups and Bs amino groups [Fig. 3(b)]. The negatively charged Bs (pI 4.6) was favored over the positively charged Bn (pI 8.9) for the conjugation reaction to avoid undesirable electrostatic adsorption due to the negative zeta-potential of the PMAO–UCNP.30 3.2.2.Specific Labeling of Cancer Cells with the UCNP-Bs:Bn-scFv4D5 ComplexesExperimental confirmation of the bioconjugation reaction and the functionality of the UCNP-Bs:Bn-scFv4D5 biocomplexes was performed by specific immobilization of these biocomplexes on cancer cells, more specifically, human breast adenocarcinoma cells SK-BR-3 known to overexpress HER2/neu, and fixed in 1% paraformaldehyde.31 Chinese hamster ovary cells CHO-K1 devoid of HER2/neu were used as a negative control. Both cell lines were incubated with recombinant mini-antibody submodules Bn-scFv4D5 to bind to HER2/neu through the antibody–receptor interaction, so that Bn was immobilized on the targeted cells. At the second incubation stage, UCNP-Bs was attached to the cell-immobilized Bn via high-affinity binding to Bs [Fig. 3(b)]. Imaging of the UCNP biocomplex-treated cells using modified epi-luminescence microscopy (see Sec. 2) under the 978-nm excitation showed that UCNP-Bs:Bn-scFv4D5 biocomplexes were immobilized on the SK-BR-3 cells with a 10-fold higher signal compared to the control CHO-K1 cells [Fig. 3(c)]. The UCNP labeling level was estimated by image analysis of the luminescent signal integrated over the cell surface area using matlab software [Fig. 3(d)]. The SK-BR-3 cells exhibited high overall UCNP labeling level with several discrete signals from UCNP clusters. 3.3.Evaluation of the Feasibility of UCNP-Assisted Optical Imaging in Human Breast Tissue3.3.1.Breast tissue phantomThe integral luminescence signal level from the labeled cells was high enough to motivate the application of UCNP in more challenging imaging scenarios, such as UCNP-assisted imaging in tissue. Since adenocarcinoma cells are hosted in human breast tissue, an imaging contrast of these cells can be modeled experimentally, provided a human breast tissue model is available. To this aim, we designed an agarose-based phantom that mimicked the optical absorption properties of live human breast tissue in the spectral ranges of the UCNP excitation and emission [Fig. 5(a)], and scattering in near-IR region. The absorption of breast tissue was calculated, considering absorption of hemoglobin (0.002 mM) and oxy-hemoglobin (0.011 mM) in the green range and near-IR light absorption of water.32 The spectrum of breast tissue absorption in the red spectral range was obtained from in vivo measurements.33 Agarose was chosen as the matrix, as its water content (about 99%) is commensurable with that of live breast tissue (10% to 60%), and resulted in slightly higher absorption of the excitation light compared to live tissue, i.e., by . The phantom and breast tissue absorption coefficients () integrated over the relevant wavelength bands were similar (green: , , red: , and 978 nm: , ), see Fig. 5(a). The reduced scattering coefficient of breast tissue in vivo was simulated by adding submicron particles to the phantom.34 The scattering coefficient and average cosine of scattering (-value) in our phantom were defined by Mie calculations of particles in water. Matching the reduced scattering coefficient at 978 nm with values recorded in vivo (978 nm: , ) resulted in a decreased scattering coefficient of the phantom compared to live tissue for the green and red wavelength bands (red: to , and green: to , ).33 Matching the scattering in live tissue and phantom at 978 nm was crucial and hence employed in our modeling, since the scattering of 978-nm light primarily determined the luminescence signal decay with the depth due to the nonlinear UCNP . Thin layers of the phantom material (0.4 to 1.4 mm) were prepared (see Sec. 2) and individually stacked between the sample plane and epi-luminescence microscope objective lens, as shown in Fig. 5(b). Fig. 5Experimental modeling of UCNP-assisted optical imaging. (a) Optical absorption spectrum of the tissue simulating phantom designed to reproduce the key optical properties of breast tissue in the UCNP excitation and emission spectral ranges (solid line). The tissue absorption spectrum (dashed line) is obtained from the literature. The UCNP emission in green and red bands and excitation in near-IR region are shown as shaded areas. (b) Schematic diagram of the optical imaging setup; UCNP-labeled cancer cells are imaged through the phantom mimicking absorption and scattering properties of breast tissue.  As is seen from Fig. 5(a), UCNP excitation at 980 nm is suboptimal for bioimaging due to the onset of the water absorption, and the use of the excitation at 915 nm is sometimes preferable, although the excitation efficiency is lower. The use of a commercially available 915-nm semiconductor laser as an excitation source for an UCNP luminescence can considerably increase the imaging depth as was reported by Zhan et al.18 Also, the use of thulium doped UCNPs, such as is preferable for imaging applications demanding maximum imaging penetration depth due to the dominant emission peak at 800 nm18 (corresponding to nonlinear two-photon absorption upconversion process), although the absolute conversion efficiency is lower than that of UCNP , . 3.3.2.Experimental modeling of UCNP-assisted cancerous lesion imagingAn optical phantom simulating breast tissue optical properties provides an excellent model to assess the prospects of in vivo UCNP-targeted imaging of breast cancer lesions. The cancer cells labeled with UCNP-Bs:Bn-scFv4D5 biocomplexes were covered with a stack of the phantom layers and imaged using a modified epi-luminescence microscope [see Fig. 5(b)]. A long-working distance objective lens allowed stacking thin phantom layers on top of the sample, while re-adjusting the objective lens distance to the sample. The signal-to-noise ratio (SNR) was defined as a ratio of the luminescence signal to the standard deviation of the signal, where the signal was estimated as a sum of the pixel values over the sample area with the background subtracted. The sample area was a cellular region outlined as inferred from the bright-field microscopy [Fig. 5(b), dashed lines]. The background level was estimated as a mean pixel value outside the illumination spot in the same image. The total noise level () was defined as where , , , and are signal shot noise multiplied by the EM-characteristic multiplicative noise factor, 1.4, dark noise, read noise, and rest noise, respectively, all measured in number of electrons [].35,36 For the experimental image data, the dark, read, and rest noises were estimated as the standard deviation of the dark background. The signal shot noise was derived from the acquired upconversion signal (signal):The SNR of the same sample area is plotted versus phantom thickness in Fig. 6. According to the SNR estimation and observed image contrast, the signals from the UCNP-labeled SK-BR-3 cells were clearly observable through the phantom up to 1.6-mm thick (, Fig. 6). Fig. 6UCNP-labeled SK-BR-3 cell imaging through a breast tissue simulating phantom at the excitation intensity of . The signal-to-noise ratio was estimated as the total signal from one SK-BR-3 cell divided by the total noise (see text for details), and plotted versus the phantom thickness. Inset shows a false color image of the UCNP-labeled SK-BR-3 cells through 0.8 and 1.6-mm phantom layers, arrows point to the corresponding data points in the graph; left panel, color bar.  We note that the excitation intensity at 978 nm, , decreases with the phantom thickness, and at a depth greater than 0.4 mm it is below as found using the Lambert–Beer law: where is the transport attenuation coefficient () defined as a sum of the attenuation, and reduced scattering coefficients, , being the scattering coefficient, and is the anisotropy factor.24 The decrease in below yields lower that contributes to SNR loss, in addition to increased attenuation of the emitted light with the phantom thickness.The quantitative imaging of the UCNP-labeled SK-BR-3 cells allowed estimation of the total number of UCNP biocomplexes per cell, using the following equation: where is the detected luminescent signal (); is the number of UCNP biocomplexes per cell; is the total number of Yb ions per a UCNP crystal; is the Yb absorption cross section (); is the excitation intensity; is the conversion efficiency found using the data plotted in Fig. 2(b); and is the spectral calibration coefficient of the detection path in the microscope system calculated as described by Nadort et al.24 where is the throughput of the imaging optics, is the Planck’s constant, is the light frequency, is the number of photons per wavelength per UCNP emission power, is the exposure time (), and is the camera sensitivity ( per count).The total number of UCNP biocomplexes per SK-BR-3 cell in vitro was calculated to be using Eq. (6). In order to put this estimation in the context of an in vivo imaging scenario, we made use of the cross-comparison between in vivo and in vitro labeling efficiency reported to be ca. 10-fold less for in vivo case.37,38 Therefore, the number of UCNPs in one breast cancer cell in vivo was estimated to be . 3.3.3.Theoretical modeling of in vivo imagingThe experimental data of the UCNP-assisted imaging sets the framework for the estimation of limits of in vivo detection of UCNP-labeled breast cancer lesions versus depth in breast tissue. Equation (5) was used to calculate the attenuation of the excitation and emission power, at depth due to absorption and scattering in tissue. This power relationship holds for both the excitation light travelling into the tissue toward the UCNP sample and the emitted light travelling backward. Initially, we calculated the UCNP signal versus the phantom thickness and compared it with that acquired experimentally (cf. Figure 6). The experimental data were obtained by adding up all pixels from the area occupied by the SK-BR-3 cells, subtracting the background, and normalizing for the EM gain, exposure time, microscope throughput, and camera sensitivity. The UCNP signal in vitro for one SK-BR-3 cell versus the phantom thickness is shown in Fig. 7 plotted as separate data points (triangles). The UCNP signal in vitro was also modeled using Eqs. (5) and (6), with the optical properties of the phantom and as parameters. As is shown in Fig. 7 (orange solid line), the modeled signal dependency on phantom thickness fits the data points very well for the entire depth range down to 2 mm. Therefore, extrapolation of the signal to the greater depths pertinent for in vivo optical imaging is straightforward. The UCNP-assisted imaging limit was theoretically estimated considering early-stage cancer tumor diagnostics under the maximum permissible laser exposure condition. A total number of breast cancer cells localized in the imaging volume were estimated, considering the EMCCD sensor optically conjugated with the imaging plane via a objective lens. A pulse energy of of the excitation beam for a 1 ms pulse duration was calculated as the maximum permissible exposure.39 The camera acquisition parameters were exposure time 1 ms and EM gain . We assumed an optimized imaging system with the background completely suppressed.14 The calculated UCNP signal intensity versus depth in tissue is shown in Fig. 7 (black solid line). As can be seen, the modeled in vivo signal of a tumor cluster is higher than that of the experimental in vitro signal. This is attributed to the higher number of cells in the sample volume, normalized to the reduced scattering coefficient in the green and red regions and the increased , even though the lower labeling efficiency was taken into account [Eqs. (5) and (6)]. The slope change of this curve at ca. 2 mm is explained by noting that is above the saturation intensity level within 2 mm from the surface in tissue yielding a nearly constant [cf. Figure 2(b)]. As the depth increases, and, consequently, decrease, thus contributing to the negative slope. The standard deviation of the signal was estimated to be less than 20%, with the main components due to the labeling variation from cell to cell, and noise. Fig. 7Theoretical estimation of UCNP-assisted in vivo optical imaging sensitivity: signal intensity and noise level versus the depth in tissue. The theoretically modeled UCNP signal in vitro from one cell (orange solid line) is plotted as a function of the phantom thickness, which fits the experimental SK-BR-3 cell imaging data (triangles). In vivo UCNP signal (–, black solid line), in vitro (×, orange crosses) and in vivo (--, black dashed line) noise levels are plotted versus depth in tissue/phantom. (SK-BR-3) breast cancer cells localized within an imaging volume of were modeled, considering UCNP-Bs:Bn-scFv4D5 biocomplexes immobilized on each cell by HER2/neu, as schematically drawn in the right panel.  The UCNP-signal can be reliably measured only when it is well above the noise level. The in vitro noise was estimated as described above, and plotted in Fig. 7 as data points (). The relatively high noise level due to the excitation light at 978 nm bleeding through the filters can be completely suppressed, e.g., by employing time-gated detection14 as plotted in Fig. 7 (black dashed line), where the dark and read noise were specified by the manufacturer, and the rest noise was zero. As one can see, the UCNP signal approaches the noise level beyond 4-mm depth in tissue, which represents a significant range for a number of applications, including early-stage breast cancer tumor diagnostics and image-guided surgery. 4.ConclusionThe optical imaging of an early-stage human breast cancer lesion labeled with emerging luminescent UCNPs was modeled using cell cultures and optical phantoms. Human breast adenocarcinoma cells SK-BR-3 that overexpress epidermal growth factor receptor HER2/neu were targeted by polymer-capped UCNPs grafted with an anti-HER2/neu targeting vector via a high-affinity molecular pair Bs:Bn. Selective binding of the UCNP-Bs:Bn-scFv4D5 biocomplexes to the SK-BR-3 cells (the ratio 10:1 as compared to a negative control) was demonstrated. The luminescence signal of the UCNPs was detectable even through a 1.6-mm thick agarose phantom mimicking breast tissue optical properties. A theoretical model based on the experimental data predicted the feasibility of in vivo optical imaging at a depth of up to 4 mm in live breast tissue, under a reasonable assumption of the complete suppression of background signals due to excitation light scattering and biological tissue autofluorescence that is afforded by the UCNP luminescence properties. We believe this study demonstrates considerable potential of an UCNP-assisted optical imaging for early-stage cancer diagnostic and image-guided surgery applications. AcknowledgmentsWe would like to thank Dr. A.N. Bykov for stimulating discussion on the theoretical aspects of modeling biological tissue phantoms. We wish to acknowledge support of the Russian Foundation of Basic Research, Grant Nos. 11-04-12113, 12-04-01258-a, and 13-02-01138. ReferencesH. Solimanet al.,
“Functional imaging using diffuse optical spectroscopy of neoadjuvant chemotherapy response in women with locally advanced breast cancer,”
Clin. Cancer Res., 16
(9), 2605
–2614
(2010). http://dx.doi.org/10.1158/1078-0432.CCR-09-1510 CCREF4 1078-0432 Google Scholar
L. V. Wang,
“Multiscale photoacoustic microscopy and computed tomography,”
Nat. Photonics, 3
(9), 503
–509
(2009). http://dx.doi.org/10.1038/nphoton.2009.157 1749-4885 Google Scholar
R. Weissleder,
“A clearer vision for in vivo imaging,”
Nat. Biotechnol., 19
(4), 316
–317
(2001). http://dx.doi.org/10.1038/86684 NABIF9 1087-0156 Google Scholar
S. Achilefu,
“Lighting up tumors with receptor-specific optical molecular probes,”
Technol. Cancer Res. Treat., 3
(4), 393
–409
(2004). TCRTBS 1533-0346 Google Scholar
Y. Yeet al.,
“Design, synthesis, and evaluation of near infrared fluorescent multimeric RGD peptides for targeting tumors,”
J. Med. Chem., 49
(7), 2268
–2275
(2006). http://dx.doi.org/10.1021/jm050947h JMCMAR 0022-2623 Google Scholar
T. A. Zdobnovaet al.,
“Fluorescent immunolabeling of cancer cells by quantum dots and antibody scFv fragment,”
J. Biomed. Opt., 14
(2), 021004
(2009). http://dx.doi.org/10.1117/1.3122775 JBOPFO 1083-3668 Google Scholar
S. M. DeyevE. N. Lebedenko,
“Multivalency: the hallmark of antibodies used for optimization of tumor targeting by design,”
Bioessays, 30
(9), 904
–918
(2008). http://dx.doi.org/10.1002/bies.v30:9 BIOEEJ 0265-9247 Google Scholar
F. Leblondet al.,
“Pre-clinical whole-body fluorescence imaging: review of instruments, methods and applications,”
J. Photochem. Photobiol. B, 98
(1), 77
–94
(2010). http://dx.doi.org/10.1016/j.jphotobiol.2009.11.007 JPPBEG 1011-1344 Google Scholar
N. M. Idriset al.,
“Tracking transplanted cells in live animal using upconversion fluorescent nanoparticles,”
Biomaterials, 30
(28), 5104
–5113
(2009). http://dx.doi.org/10.1016/j.biomaterials.2009.05.062 BIMADU 0142-9612 Google Scholar
T. W. Prowet al.,
“Quantum dot penetration into viable human skin,”
Nanotoxicology, 6
(2), 173
–185
(2012). http://dx.doi.org/10.3109/17435390.2011.569092 1743-5390 Google Scholar
H. X. Maiet al.,
“Highly efficient multicolor up-conversion emissions and their mechanisms of monodisperse , Er core and core/shell-structured nanocrystals,”
J. Phys. Chem. C, 111
(37), 13721
–13729
(2007). http://dx.doi.org/10.1021/jp073920d 1932-7447 Google Scholar
R. H. Pageet al.,
“Upconversion-pumped luminescence efficiency of rare-earth-doped hosts sensitized with trivalent ytterbium,”
J. Opt. Soc. Am. B, 15
(3), 996
–1008
(1998). http://dx.doi.org/10.1364/JOSAB.15.000996 JOBPDE 0740-3224 Google Scholar
C. Vinegoniet al.,
“Transillumination fluorescence imaging in mice using biocompatible upconverting nanoparticles,”
Opt. Lett., 34
(17), 2566
–2568
(2009). http://dx.doi.org/10.1364/OL.34.002566 OPLEDP 0146-9592 Google Scholar
K. Hanaokaet al.,
“Time-resolved long-lived luminescence imaging method employing luminescent lanthanide probes with a new microscopy system,”
J. Am. Chem. Soc., 129
(44), 13502
–13509
(2007). http://dx.doi.org/10.1021/ja073392j JACSAT 0002-7863 Google Scholar
T. Caoet al.,
“High-quality water-soluble and surface-functionalized upconversion nanocrystals as luminescent probes for bioimaging,”
Biomaterials, 32
(11), 2959
–2968
(2011). http://dx.doi.org/10.1016/j.biomaterials.2010.12.050 BIMADU 0142-9612 Google Scholar
Q. Liuet al.,
“Sub-10 nm hexagonal lanthanide-doped upconversion nanocyrstals for sensitive bioimaging in vivo,”
J. Am. Chem. Soc., 133
(43), 17122
–17125
(2011). http://dx.doi.org/10.1021/ja207078s JACSAT 0002-7863 Google Scholar
L. Xionget al.,
“High contrast upconversion luminescence targeted imaging in vivo using peptide-labeled nanophosphors,”
Anal. Chem., 81
(21), 8687
–8694
(2009). http://dx.doi.org/10.1021/ac901960d ANCHAM 0003-2700 Google Scholar
Q. Q. Zhanet al.,
“Using 915-nm laser excited doped upconversion nanoparticles for in vitro and deeper in vivo bioimaging without overheating irradiation,”
ACS Nano, 5
(5), 3744
–3757
(2011). http://dx.doi.org/10.1021/nn200110j 1936-0851 Google Scholar
C. WangL. ChengZ. Liu,
“Research spotlight: upconversion nanoparticles for potential cancer theranostics,”
Ther. Delivery, 2
(10), 1235
–1239
(2011). http://dx.doi.org/10.4155/tde.11.93 TDHEA7 2041-5990 Google Scholar
S. M. Deyevet al.,
“Design of multivalent complexes using the barnase·barstar module,”
Nat. Biotechnol., 21
(12), 1486
–1492
(2003). http://dx.doi.org/10.1038/nbt916 NABIF9 1087-0156 Google Scholar
G. W. Rushizkyet al.,
“Studies on B. subtilis ribonuclease. I. Characterization of enzymatic specificity,”
Biochemistry, 2
(4), 787
–793
(1963). http://dx.doi.org/10.1021/bi00904a028 MIRBD9 0144-0578 Google Scholar
J. D. BeattyB. G. BeattyW. G. Vlahos,
“Measurement of monoclonal antibody affinity by non-competitive enzyme immunoassay,”
J. Immunol. Methods, 100
(1–2), 173
–179
(1987). http://dx.doi.org/10.1016/0022-1759(87)90187-6 JIMMBG 0022-1759 Google Scholar
T. Pellegrinoet al.,
“Hydrophobic nanocrystals coated with an amphiphilic polymer shell: a general route to water soluble nanocrystals,”
Nano Lett., 4
(4), 703
–707
(2004). http://dx.doi.org/10.1021/nl035172j NALEFD 1530-6984 Google Scholar
A. Nadortet al.,
“Quantitative imaging of single upconversion nanoparticles in biological tissue,”
PLoS One, 8
(5), e63292
(2013). http://dx.doi.org/10.1371/journal.pone.0063292 1932-6203 Google Scholar
A. V. Bykovet al.,
“Skin phantoms with realistic vessel structure for OCT measurements,”
Proc. SPIE, 7376 73760F
(2010). http://dx.doi.org/10.1117/12.872000 Google Scholar
F. Wanget al.,
“Synthesis of polyethylenimine/ nanoparticles with upconversion fluorescence,”
Nanotechnology, 17
(23), 5786
–5791
(2006). http://dx.doi.org/10.1088/0957-4484/17/23/013 NNOTER 0957-4484 Google Scholar
L. S. Liet al.,
“Studies of nanoparticulate cadmium sulfide in amphiphilic polymaleic acid octadecanol ester Langmuir–Blodgett films,”
Supramol. Sci., 5
(5–6), 475
–478
(1998). http://dx.doi.org/10.1016/S0968-5677(98)00054-6 SUSCFX 0968-5677 Google Scholar
S. SongL. LiuJ. Zhang,
“Annealing improves tribological property of poly (octadecene-alt-maleic anhydride) self-assembled film,”
Appl. Surf. Sci., 257
(23), 10254
–10260
(2011). http://dx.doi.org/10.1016/j.apsusc.2011.07.035 ASUSEE 0169-4332 Google Scholar
G. S. YiG. M. Chow,
“Water-soluble (Tm)//polymer core/shell/shell nanoparticles with significant enhancement of upconversion fluorescence,”
Chem. Mater., 19
(3), 341
–343
(2007). http://dx.doi.org/10.1021/cm062447y CMATEX 0897-4756 Google Scholar
V. K. A. Sreenivasanet al.,
“Barstar:barnase—a versatile platform for colloidal diamond bioconjugation,”
J. Mater. Chem., 21
(1), 65
–68
(2011). http://dx.doi.org/10.1039/c0jm02819c JMACEP 0959-9428 Google Scholar
N. E. Hyneset al.,
“Overexpression of the c-erbB-2 protein in human breast tumor cell lines,”
J. Cell. Biochem., 39
(2), 167
–173
(1989). http://dx.doi.org/10.1002/(ISSN)1097-4644 JCEBD5 0730-2312 Google Scholar
H. HeusmannJ. G. KoelzerG. Mitic,
“Characterization of female breasts in vivo by time-resolved and spectroscopic measurements in the near infrared spectroscopy,”
J. Biomed. Opt., 1
(4), 425
–434
(1996). http://dx.doi.org/10.1117/12.250669 JBOPFO 1083-3668 Google Scholar
A. Pifferiet al.,
“Spectroscopic time-resolved diffuse reflectance and transmittance measurements of the female breast at different interfiber distances,”
J. Biomed. Opt., 9
(6), 1143
–1151
(2004). http://dx.doi.org/10.1117/1.1802171 JBOPFO 1083-3668 Google Scholar
A. V. Bykovet al.,
“Multilayer tissue phantoms with embedded capillary system for OCT and DOCT imaging,”
Proc. SPIE, 8091 80911R
(2011). http://dx.doi.org/10.1117/12.889923 Google Scholar
M. S. RobbinsB. J. Hadwen,
“The noise performance of electron multiplying charge-coupled devices,”
IEEE Trans. Electron. Devices, 50
(5), 1227
–1232
(2003). http://dx.doi.org/10.1109/TED.2003.813462 IETDAI 0018-9383 Google Scholar
J. C. Waters,
“Accuracy and precision in quantitative fluorescence microscopy,”
J. Cell Biol., 185
(7), 1135
–1148
(2009). http://dx.doi.org/10.1083/jcb.200903097 JCLBA3 0021-9525 Google Scholar
S. R. Benhabbouret al.,
“In vitro and in vivo assessment of targeting lipid-based nanoparticles to the epidermal growth factor-receptor (EGFR) using a novel heptameric domain,”
J. Controlled Release, 158
(1), 63
–71
(2011). http://dx.doi.org/10.1016/j.jconrel.2011.10.013 JCREEC 0168-3659 Google Scholar
J. A. Khanet al.,
“Designing nanoconjugates to effectively target pancreatic cancer cells in vitro and in vivo,”
PLoS One, 6
(6), e20347
(2011). http://dx.doi.org/10.1371/journal.pone.0020347 1932-6203 Google Scholar
1
–48 Sydney, AU and Wellington, NZ
(2012). Google Scholar
|


