
|
|
1.IntroductionRestorative dentistry has been revolutionized with the introduction of resin-based dental adhesives, enabling bonding of biomaterials (mainly composites) to the dental hard tissues. The adhesives have evolved in the past decades toward complex formulations with simplified clinical procedures. Reduced technique sensitivity and short period of application procedure have made one-step self-etch adhesives (1-SEAs) more popular among dentists in recent years. Although the problem of postoperative sensitivity can be remarkably reduced as the smear plugs remain when 1-SEAs are applied, in vitro and clinical reports on bonding performances of 1-SEAs have indicated controversial results.1–3 Furthermore, 1-SEAs act as a permeable membrane, facilitating water movement across the polymerized resin and leading to bond degradation over time.4 Besides hydrophilicity, there are other important factors that contribute to the marginal integrity of 1-SEAs, for instance, operator’s variability, composition of dental substrate, size and shape of the cavity,5 and type of composite material used for restoration.6,7 The majority of recent adhesives show quite high immediate bonding performance in the laboratory; however, the clinical bonding effectiveness of some have been found to be not as satisfactory as their initial bond strength values.8,9 Several groups of researchers pointed out that for a single adhesive, there was variation in bond strength data dependent on the bond tests employed.10 The application of stress at the interface may not be uniform, and there are variations in specimen preparations, shape, loading, and properties of the materials as well.11,12 The eventual goal of adhesion is to provide a good seal at the interface of the restorative material and the dental tissue. It seems that evaluation of the adaptation of adhesives can be a useful means of assessing the performance of restorations.2,9,13,14 From this point of view, one can consider that solely mechanical testing cannot indicate the capacity of an adhesive to maintain hermetic seal between tooth and restoration. Conventional microscopic techniques require physical sectioning of the samples usually followed by polishing and processing, and, occasionally, application of a labeling or staining agent. These procedures are time-consuming and provide data on a single cross-section. Therefore, for the analysis of sealed tooth–adhesive interfaces, nondestructive and validated laboratory testing methods are desirable.15–18 In this context, optical coherence tomography (OCT) can be employed as a nondestructive imaging technology that produces high-resolution, cross-sectional images of the biological tissue at micron scale. Since its introduction in the early 1990s as a time-domain OCT (TD-OCT) for biological tissue imaging, there has been huge development in the field of OCT.19,20 The principles of OCT are based on low-coherence interferometry; light backscattered from inside the specimen is measured by correlating with light that has traveled a known reference path. Imaging depth of OCT in most tissues is limited to to 3 mm due to optical attenuation (absorption, scattering) from the tissue. In spite of its depth limitation, the image resolution of OCT is 10 to 100 times finer than ultrasound imaging. OCT is a real-time noninvasive imaging methodology that does not produce ionizing radiation. It has a great advantage over conventional microscopy, which requires destructive cross-sectioning of the specimens for biological analysis.16,17 A more recent implementation of OCT technology, swept-source OCT (SS-OCT), has improved sensitivity, higher scanning speed, and increased signal-to-noise ratio and has gained much attention in recent years, and has advantages over TD-OCT.21,22 While OCT has become an increasingly popular imaging technique in various fields of medicine, such as ophthalmology, dermatology, and cardiology, only a few studies have so far employed SS-OCT for characterization of synthetic biomaterials. In the dental field, OCT has been applied for nondestructive and label-free assessment of gaps at the composite–dentine interfaces in two-dimensional (2-D) and three-dimensional (3-D) tomograms,5–18 along with evaluation of voids and defects in restorations,23 thus suggesting its potential applications in clinical dentistry for monitoring of restorations. The basic concept of defect detection through biomaterials by OCT is the optical contrast between the media filling the defect and the body of the material, resulting in detectable changes in the backscatter signal.16,17,24 There are no reports on the quantitative assessment of a large variety of commercially available 1-SEAs using OCT. Therefore, the objective of the present study was to nondestructively assess the sealing performances of 1-SEAs. The null hypothesis tested was that there is no significant difference in sealing performance among current 1-SEAs. 2.Materials and Methods2.1.SS-OCT SystemThe SS-OCT system (IVS-2000, Santec, Komaki, Japan) used in this study was a frequency-domain OCT. The system is incorporated with a low-coherence near-infrared light source and has the configuration of Mach–Zehnder type of interferometer. The near-infrared light is a fast sweeping laser that repetitively sweeps the wavelength from 1260 to 1360 nm (centered at 1310 nm) at the rate of 20 kHz. The axial resolution of this SS-OCT system in air is 11 μm, which corresponds to 7 μm within dental tissue having a refractive index of about 1.5 (Ref. 25). The lateral resolution of the system is , which is determined by the objective lens at the probe. The probe that is connected with the interferometer has a power of 5 mW, which is within the safety limit of American Standard Institute. Laser source emitted from the probe is directed onto the sample at the desired location in and dimensions. The backscattered light carrying information from each single scan point of the sample is returned to the system, digitized in time scale, and then analyzed in the Fourier domain to disclose the depth information (A-scan) of the sample. By combining the series of A-scans in a linear fashion across the sample, a cross-section (B-scan) is obtained. Finally, cross-sectional images can be created by converting the B-scan raw data into a grayscale image with . 2.2.Specimen PreparationForty-five freshly extracted, sound bovine maxillary incisors were selected for this study. The labial enamel was slightly polished with 800-grit silicon carbide (SiC) paper to remove the superficial layer and expose enamel. Class I cavities () were prepared with round margins located in the labial enamel and cavity floor located in dentine. A flattened tapered diamond bur (# 0814 Robot FG Diamond, Shofu, Kyoto, Japan) attached to a high-speed turbine hand piece was used under water coolant to prepare cavities. According to the study design, the teeth were divided into nine groups () corresponding to the materials used: a two-step self-etching adhesive (2-SEA) as a control [Clearfil SE Bond (CSE), Kuraray Noritake Dental, Tokyo, Japan] and eight all-in-one adhesives [G-Bond Plus (GBP), GC, Tokyo, Japan; Adper Easy Bond (AEB), 3M ESPE, St. Paul, Minnesota; Bond Force (BF), Tokuyama Dental, Tokyo, Japan; Clearfil Tri-S Bond Plus (CTP) and Clearfil Tri-S Bond (CTS), Kuraray Noritake Dental; iBond (IB), Hereaus-Kulzer, Hanau, Germany; Fluoro Bond Shake One (FBS), Shofu Inc., Kyoto, Japan; Xeno V (XV), Dentsply, Konstanz, Germany]. The cavity was treated with the material in accordance with the instructions supplied by the manufacturers as listed in Table 1. The cavity was then restored with a flowable resin composite (Estelite Flow Quick, Tokuyama Dental) and cured for 20 s with a halogen light curing unit (Optilux 501, Kerr, Orange, California) with a power density of . After 24 h storage in normal water at 37°C, each sample was fixed on a micrometer head stage and scanning laser beam was oriented at 90 deg to the surface of restoration. Cross-sectional B-scan images of the restored samples were taken at every 200-μm interval by moving the sample across the laser beam at mesio-distal direction. Altogether 20 images were obtained from each sample, i.e., 100 images for each group. A schematic illustration of the sample preparation and observation under OCT and confocal laser scanning microscope (CLSM) are shown in Fig. 1. Table 1Composition of materials used in this study with manufacturers’ instructions.
Note: Abbreviations: MDP: 10-methacryloyloxydecyl dihydrogenphosphate; HEMA: 2-hydroxyethyl methacrylate; Bis-GMA: bisphenol A diglycidyl methacrylate; 4-MET: 4-methacryloyloxyethyl trimellitic acid; HDDMA: 1,6-hexanediol dimethacrylate; CQ: camphorquinone; 3-D SR: three-dimensional self-reinforcing; TEGDMA: triethylene glycol dimethacrylate; NaF: sodium fluoride; UDMA: urethane dimethacrylate or 1,6-bis(methacrylethyloxycarbonylamino) trimethyl hexane; PI: photoinitiators; S-PRG filler: surface reaction type prereacted glass-ionomer filler; FASG filler: fluoro aluminosilicate glass filler; 6-MHPA: 6-methacryl-oxyhexyl phosphonoacetate; 4-AET: 4-acryloyloxyethyl trimellitic acid; 4-AETA: 4-ethyloyloxyethyl trimellitic anhydride; Bis-MPEPP: Bisphenol A polyethoxy methacrylate. Fig. 1Schematic diagram of sample preparation and observation under swept-source optical coherence tomography (SS-OCT) and confocal laser scanning microscope (CLSM). The bovine incisors were 3-D scanned by OCT at each stage to generate this schematic diagram. (I) Bovine maxillary incisors were selected and facial enamel surface was flattened by polishing. (II) Round class-I cavity () was prepared. (III) In each prepared cavity, composite was bulk filled and light-cured after application of the bonding agent according to manufacturers’ instructions. (IV) Each specimen was subjected to SS-OCT scanning at 200-μm interval. (V) Each obtained 2-D OCT scan was analyzed by the software. (VI) OCT scanned samples were sectioned and polished. (VII) The cross-sections were observed under CLSM for confirmation of OCT findings. 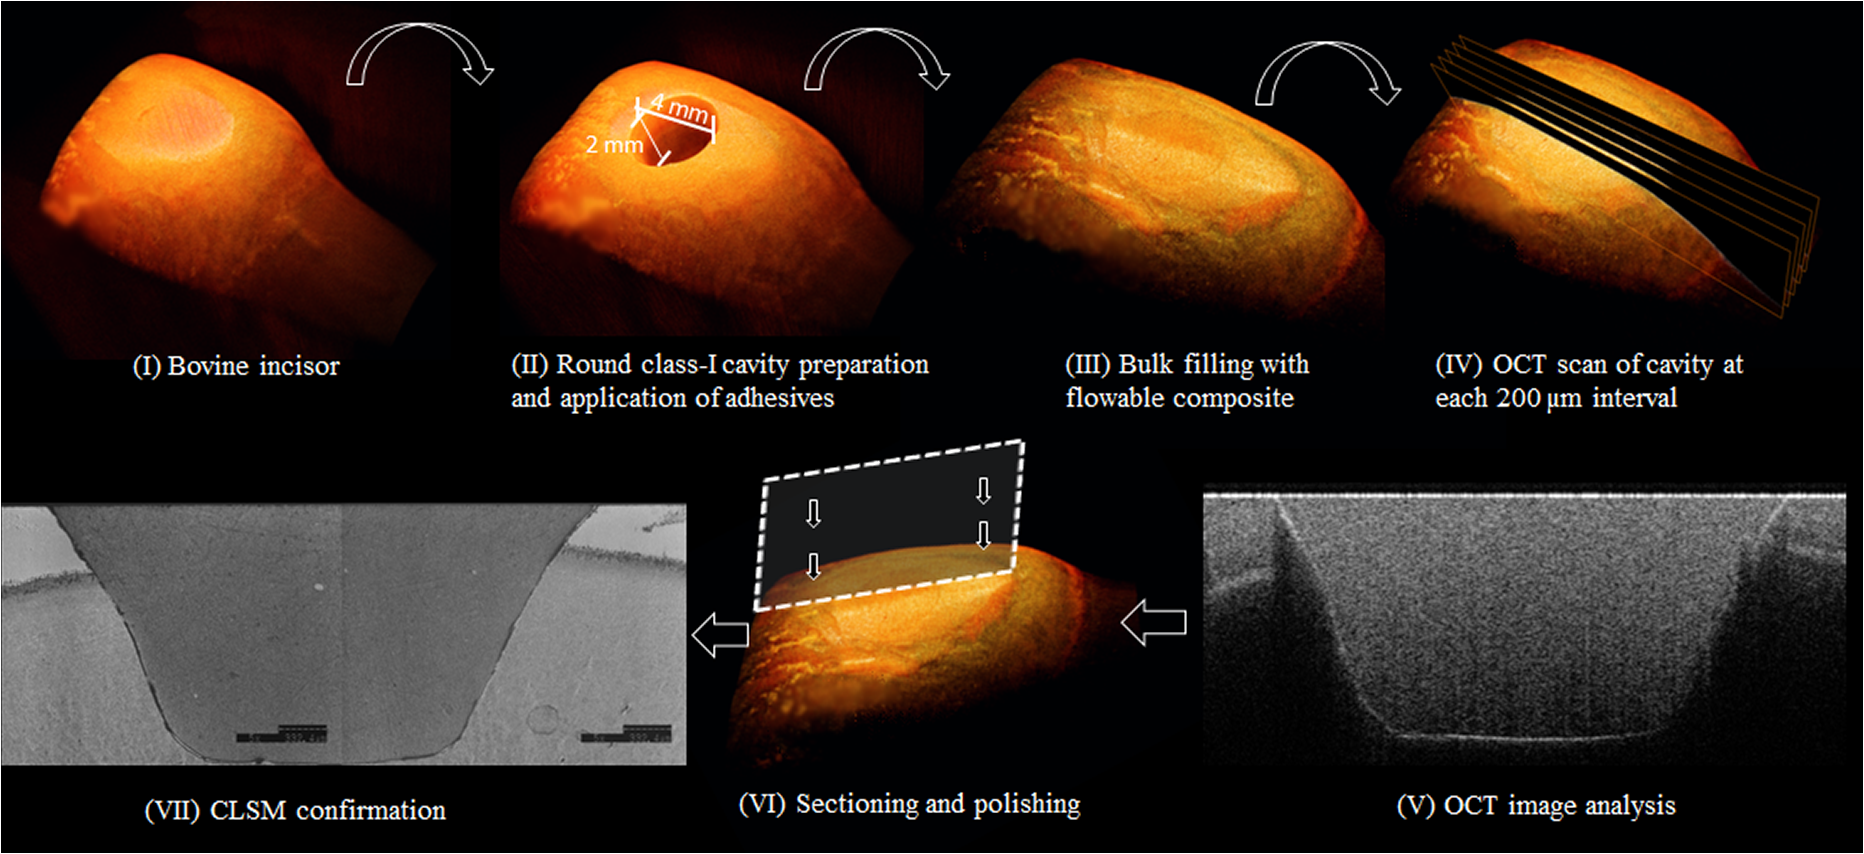 2.3.Analysis of SS-OCT DataIn this study, for the analysis of image, we have adopted percentage values of sealed interfaces (SI%) parameter to calculate and evaluate the bonding performance of the adhesives. 2-D SS-OCT raw tomograms were imported to image analysis software (ImageJ version 1.45) and a median filter was applied to decrease background noise.16 An experimental threshold determination algorithm developed as a plugin for ImageJ under JAVA was used for image analysis. As shown in Fig. 2, the region of interest (ROI) was selected as a polygon selection using around the whole length of the restoration interface, excluding the specimen surface. The ROI width was pixels with the interface around at the center of the ROI. The pixel values on each vertical line (A-scan corresponding to 2 pixels in width) within the ROI were ranked by the software plugin. The pixels that ranked higher than 90% of the pixels on the same line (i.e., the top 10%) were selected. Among them, the pixels bearing higher intensity values equal to or greater than the sum of background noise and the median values were designated as target pixels (white) and all other pixels were designated as null (black). The measurement of the total percentage of these white pixels (gap) over the ROI length was automatically done by the plugin. In order to get the total SI% value, the obtained total gap percentage was subtracted from 100%. SI% value was calculated from each 2-D image as shown in Fig. 2, taken at 200-μm intervals. Fig. 2(a) The region of interest (ROI) was selected along the interface to highlight the defects (gap) with increased signal value and calculate sealed interface percentage (SI%). The specimen surface was excluded. (b) The area demarcated in (a) as a transparent white patch to demonstrate the process of gap percentage calculation by software; signal intensity profile was drawn and averaged over 2 pixels in width. (c) Signal profile drawn in (b); after ranking all intensity values, the top 10% pixels were designated as the peak. (d) The resulting binary image; peak pixels whose intensity values were similar to or greater than sum of (background values) are displayed as white. These white pixels indicate gap at the interface. (e) The output binary image; simple arrows showed interface with increased signal intensity at the wall and floors of the cavity (corresponding to gap), in contrast to the sealed interface with no increase in signal intensity indicated by blank arrows. The measurement of the total percentage of these white pixels (gap) over the total ROI length was automatically done by the ImageJ plugin. The total gap percentage was subtracted from 100% to obtain total SI% value for each 2-D OCT image.  Finally, the mean SI% value for each specimen was calculated. The data were subjected to analysis of normality to select a parametric test. Average SI% values for each adhesive were then statistically analyzed using one-way analysis of variance (ANOVA) followed by multiple comparisons using Bonferroni correction. All the analyses were performed using the Statistical Package for Social Science (SPSS for Windows, Version 16.0, SPSS, Chicago, Illinois) with the significance level set at . 2.4.Confocal Laser Scanning Microscope Observation and Image AnalysisFor the confirmation of sealed and debonded interfaces under CLSM, representative specimens in each group were cut across the restoration after OCT scanning using low-speed diamond saw (Isomet, Buehler, Lake Bluff, Illinois). The cut samples were reduced up to the OCT cross-section of interest by polishing with 2000-grit SiC paper followed by a series of diamond paste down to a particle size of 0.25 μm in circular motion.16 Samples were ultrasonicated at the end of each polishing step and finally examined under CLSM at magnification. For the calculation of SI% on CLSM images, the following steps were carried out: series of images were opened with ImageJ software and the total length of the restoration interface along with sealed interface was measured manually. SI% value for each representative CLSM image was calculated from sum of gap length and total interface length in a similar manner as for the OCT. 3.ResultsFigure 3 shows representative 2-D OCT image of the control 2-SEA adhesive with no increase in signal intensity at most of the cavity interface, demonstrating a good seal at the bonded dentin–resin complex in confirmatory CLSM images. However, increased signal intensities at the interfaces of 2-D OCT cross-sections in Figs. 4 and 5 correspond to gaps in confirmatory CLSM images. In addition, defects such as voids or bubbles, essentially formed by entrapment of air within the composite material, were clearly observed. Fig. 3OCT B-scan and corresponding CLSM confirmatory images obtained for CSE group specimen. E, enamel; D, dentin; C, composite. Increase in signal intensity as pointed by arrows at the composite outer surface and at the upper border of the void was observed in OCT B-scan. Almost no increase in signal intensity was observed at the interface, which indicated tight seal of the restoration. Blank arrow heads are pointed toward the thicker adhesive layer, which corresponds to 60 μm in CLSM images.  Fig. 4OCT B-scan and corresponding CLSM confirmatory images obtained for Clearfil Tri-S Bond Plus (CTP) group specimen. E, enamel; D, dentine; C, composite. High signal intensity as pointed by arrows at the surface of composite, upper and lower borders of void, and at the cavity interface with gap confirmed by CLSM images. Due to loss in signal intensity underneath the void (blank arrows), part of interface (with gap in CLSM images) was masked.  Fig. 5OCT B-scan and corresponding CLSM confirmatory images obtained for G-Bond Plus (GBP) group specimen. E, enamel; D, dentine; C, composite. High signal intensity as pointed by arrows at the surface of composite, upper and lower borders of void, and at the cavity interface with gap. Bold arrow heads are pointing toward the interface with no increase in signal intensity, indicating absence of gap as can be observed in corresponding CLSM images. Loss in signal intensity beneath the void is pointed by blank arrow.  The null hypothesis of the present study was rejected since one-way ANOVA analysis of the OCT data revealed significantly different SI% values among different adhesives (). The average SI% values for all groups with their standard deviations are plotted in Fig. 6. The control adhesive (CSE) showed the highest nominal SI%, which was not significantly different from CTS and CTP. On the other hand, GBP and AEB attained moderate SI% values, and the lowest sealing performances were achieved by BF, IB, FBS, and XV. Fig. 6The average SI% for different tested adhesives with their standard deviations. Horizontal bar indicates no significant difference between the adhesives.  A statistically significant correlation was found between OCT SI% and CLSM SI% (, , confidence to 0.99) (Fig. 7). Moreover, high-magnification CLSM images demonstrated that the gap was present not only at the adhesive–dentine interfaces but also between adhesive–composite interfaces in 1-SEAs (Fig. 8). Fig. 7Regression between OCT SI% and CLSM SI% with confidence intervals of the solid line presented by the dotted lines (, ).  Fig. 8CLSM photomicrographs illustrating dentine—adhesive—composite interfaces formed by control adhesive (Clearfil SE Bond [CSE]) and 1-SEAs (Clearfil Tri-S Bond [CTS], Clearfil Tri-S Bond Plus [CTP], G-Bond Plus [GBP], Bond Force [BF], and Adper Easy Bond [AEB]). C, composite; A, adhesive; D, dentine. at . CSE showed good sealing ability with dentine and composite (a) and (b) in spite of remarkably thicker layers at corners (b). Notice a good integration of CSE with composite material. CTS showed around 5 μm thickness at cavity wall (c) and 10 to 20 μm thickness at cavity floor (d). However, the adhesive at a similar thickness of 5 μm at the floor of the cavity (e) was debonded from dentine (arrows). In case of CTP, gap (arrows) was occasionally present at adhesive–composite interface (f). A slightly thicker adhesive layer in a different specimen showed no gap (g). For GBP, the gap (arrows) was mainly located at adhesive—composite interface (h) and (i). In BF (j), the gap was mainly located at adhesive–composite interface (black arrows). AEB with 5 μm thickness represented good sealing of the cavity floor (k). In the same specimen, gaps (arrows) at adhesive–dentine interface were found at the cavity wall (l).  4.DiscussionIn this study OCT appeared as a potential tool to nondestructively evaluate the sealing performances of eight 1-SEAs. When light from OCT probe was directed onto the sample, there was increase in signal intensity of light at the surface of the composite material and at defective biomaterial–tissue interfaces. This increase in signal intensity occurs due to scattering of light traversing through media of different refractive indices. The amount of reflection depends upon the angle of incidence of light and contrast of the media involved. In the case of resin composite investigated in the current study, value was calculated as 1.46 by OCT using the optical path-length-matching method previously described.25,26 This value is close to that of tooth structure and remarkably different from that of air (), which assumedly filled the gaps or defects, resulting in significant signal peaks at the border of the defect, as shown in Figs. 3, 4, and 5. Previous works have focused on gap measurement at the bottom of cavity, which is perpendicular to the OCT beam direction. In the current work, a simple pilot experiment was carried out to clarify how the angle of incidence on cavity walls affects the reflection. Several cavities were designed to have an inverted taper with a certain wall inclination (90, 115, 125, and 135 deg) and a flattened floor, as shown in Fig. 9. The cavities were then filled with the flowable composite without any adhesive application. When the lateral wall was perpendicular to the cavity floor, gaps were not visible, since the beam passed parallel to the walls without making interfacial angle. In other cases, interfacial gaps were visible at the lateral wall; however, as noticed from Fig. 9, the calculated gap percentage would still be slightly underestimated with 115 deg wall inclination. It appears that 125 and 135 deg resulted in similar SI% values, indicating that these inclinations are adequate for reliable detection of lateral wall gap by OCT. This assumption was confirmed by the strong correlation found in the results between OCT and CLSM in the main experiment, where the cavities had approximately 125 deg taper. Fig. 9OCT images explain how cavity wall inclination affects the OCT output signal value, in this case SI%. All cavities were restored with composite resin without preapplication of adhesive resin to create gap along the whole restoration interface. (a) Cavity wall 90 deg to the floor with . Gap can be noticed at the floor but not at the lateral walls. (b), (c), and (d) Angles between lateral walls and floors are around 115, 125, and 136 deg and SI% values are 17.7, 12.7, and 11.1, respectively. Gap is visible along the whole restoration interface for (c) and (d); however, the expected signal intensity peak could not be noticed at some parts of interface in (b).  It is also important to note that the OCT signal intensity levels decrease through the depth of the object due to attenuation of light through media (Fig. 2). The attenuation is the result of scattering and absorption of light, and depends on several factors including the wavelength of light and the constituents of the biomaterial or tissue. In the case of dental composite, the attenuation is mainly affected by filler particles, metallic oxides, and shade of the material employed.27 With increasing depth of restoration, there was gradual loss of signal value; nevertheless the second peaks indicating presence of gap at the cavity interface could be distinctly obtained at various depths despite the attenuation. In order to account for the attenuation, measurement of gap extension was accomplished by experimentally developed software that detected these second peaks with increased signal intensity on each A-scan line independently along the whole length of the restoration interface. Apart from the visualization of gaps at the interface, OCT imaging can also detect voids or air bubbles of different sizes within the composite restoration.24 In Figs. 3, 4, and 5, voids of different sizes and almost spherical in shape, filled with air, reflect back most of the light from their boundaries. Such strong backscattering from within the composite occasionally prevents effective signal acquisition from the deeper region of the structure. The attenuation of light due to multiple reflections at the defect boundaries results in dark area with low signal intensity underneath the defect. CLSM observation was performed for the confirmation of OCT findings (Figs. 3, 4, and 5). The interfacial areas where a peak in OCT signal intensity was observed corresponded well to the gap in CLSM images. However, occasionally additional gaps at the margin of the CLSM images (Fig. 4) could be seen, particularly in the case of 1-SEAs. This raised a concern that the OCT methodology could have produced false-negative results with regard to the presence of gaps at some regions. On the other hand, these gaps were thought to be produced during sectioning, polishing, and ultrasonication procedures. Although, unlike SEM, metal sputtering and vacuum conditions are not required for CLSM, it is still a destructive method. Nonetheless, statistical analysis revealed that SI% calculated from both OCT and CLSM images were significantly correlated with each other (Fig. 7), which, in turn, validates the quantitative SI% measurements by OCT in this study. At the same time, the small difference in the value of OCT and CLSM SI% was mainly attributed to specimen processing procedures and higher magnification and resolution of CLSM. Interestingly, the slope of regression line was close to unity and the intercept was not very large (6.6%); analysis of covariance revealed that this regression line was not significantly different from a standard linear relationship where () (). In this study a flowable resin composite Estelite Flow Quick was used, which is based on radical amplified photopolymerization technology that promotes rapid polymerization and requires shorter irradiation time according to the manufacturer. While this feature is desirable in terms of clinical time efficiency, a rapid polymerization may result in a higher rate of modulus development that affects generation of contraction stresses.28 The aim of employing the flowable composite as a filling material for bulk-filling of the relatively large class I cavities (high C-factor)29,30 was to create a severe shrinkage stress condition to challenge the adhesives. SS-OCT has been previously used for detecting gap defects at the tooth–restoration interfaces.15–17 However, the capability of SS-OCT to detect gap location, whether in between adhesive–dentine or adhesive–composite, depends on the optical thickness of the adhesive in relation to the axial resolution of the system. If the adhesive is adequately thick, it can be clearly distinguished in an OCT tomogram (Fig. 3), and therefore the gap location can be identified. However, the majority of adhesives in this study formed a bonding layer in thickness, which would make it difficult to judge the axial location of the gap; in order to confirm the location, samples scanned under SS-OCT were prepared for CLSM observation at magnification. It was noticed that the failure of 1-SEAs occurred not only at adhesive–dentine interfaces but also in between adhesive–composite interfaces. Apart from the common categorical classification of dental adhesives, the performance of SEAs is remarkably different among various products in the same category and depends on the specific formulation of each adhesive. The acidic functional monomers such as 10-methacryloyloxydecyl dihydrogenphosphate (MDP) and 4-methacryloyloxyethyl trimellitic acid (4-MET) are the key ingredients of SEAs that enhance wetting, demineralize tooth substrate, and chemically bond with it.31 The etching efficacy of SEAs depends on hydrogen ions dissociated from the acidic monomers in presence of water.32 A 2-SEA was employed as control adhesive in the present study. The bonding agent has been adopted as the gold standard of SEA systems in several studies.3,33 Under this system, a hydrophilic etching primer is applied first, and after evaporation of solvent and water, a second layer of hydrophobic bond is covered, which seals off the underlying wet dentine. This additional hydrophobic layer, rich in hydrophobic monomer and fillers, renders CSE to achieve good sealing with underlying tooth substrate and overlying resin composite.34 In addition, the material contains MDP as the acidic functional monomer, which has shown good adhesive properties contributing to effectiveness and durability of adhesion to dental tissues.35,36 Also the hydrophilic functional monomer 2-hydroxyethyl methacrylate (HEMA) in this bonding agent allows sufficient resin monomer penetration into tooth substrate prior to light curing.37 In contrast to the two-step system, in 1-SEAs the ingredients are either incorporated into single bottle or provided as two components that are mixed into one solution before application (such as in FBS). The resulting mixtures are usually hydrophilic solutions consisting of resin monomers, fillers, water, solvents, initiators, and stabilizers.31 Two 1-SEAs (CTS and CTP) that obtained higher SI% values, statistically comparable with the control adhesive, contain MDP and HEMA functional monomers. The presence of ethanol as the solvent might have removed adequate water from the mixture upon air drying.31 Moreover, these two adhesives contain silanated colloidal silica and are more viscous than other 1-SEAs, which might have contributed to producing optimal adhesive layer with sufficient mechanical property.31 In spite of higher sealing performance, some gaps were found in these two adhesives as shown in Fig. 8. In CTS and CTP, adhesive–dentine separation was occasionally observed, indicating the polymerization contraction stress produced by composite counter adhesive–dentine interfacial bond.29 Moreover, the gaps were sometimes located between adhesive–composite interfaces. Despite the air blowing step, residual solvent remaining on adhesive–composite interface of these adhesives may have retarded adhesive-composite copolymerization, leading to formation of gap at this interface.1 In this study GBP obtained moderate SI% values. The presence of phosphoric acid ester monomer and 4-MET in GBP might have improved its sealing performance in comparison to other adhesives with lower SI% values. On the other hand, GBP showed some gap at adhesive–composite interface (Fig. 8). This lower sealing performance of GBP in comparison to CTS and CTP could be because of phase separation in the absence of HEMA.38 Although strong air pressure removes some water and phase-separated micro voids from the adhesive, remaining voids at the upper region of adhesive hamper their copolymerization with composite restoration. AEB contains methacrylated phosphoric esters and methacrylate functionalized polyalkenoic acid. However, this adhesive showed an average SI% of only . There is a possibility that the remaining phase-separated globules of polyalkenoic acid copolymer39 in AEB after mild air blow might have lowered the sealing capability with some areas of dentine. Moreover, the effectiveness of functional monomers in AEB in comparison to MDP has been questioned.36 BF has SI% value comparable to AEB, IB, FBS, and XV. BF contains a phosphoric acid monomer (3-D self-reinforcing monomer), which, according to manufacturers and some researchers, actively interacts with the tooth substrate,40 but its performance in comparison to MDP is still unclear. In CLSM image of BF, gaps dominantly occurred between adhesive and composite (Fig. 8). Presence of lower vapor pressure isopropyl alcohol in BF,15 which requires more time to evaporate during air-drying phase than ethanol, might have led some residual solvents to remain at the composite side of adhesive surface, therefore hampering sufficient copolymerization. Finally, IB and XV frequently showed separation from both composite and dentin sides. Besides the commonly known compositional issues of 1-SEAs, the lack of an efficient functional monomer and absence of HEMA in the composition of IB and XV might be one reason for their lowest sealing performance.38 FBS is the only 1-SEA with a two-component system that requires mixing before application. This additional procedure of mixing may have included some air bubbles, and also there might be loss of homogeneity of adhesive due to preapplication evaporation of solvent like acetone. Moreover, the glass fillers of FBS appeared to be very large particles potentially hampering penetration of the adhesive into the substrate (figure not shown).41 It appears that 1-SEAs show variation in their sealing ability and that a single component (such as functional monomer, solvent, or filler) cannot be the sole basis of comparison among two different formulations. The current study looked into sealing performance of adhesives only 24 h after bonding. Further study is required for the long-term assessment of adhesives by OCT imaging before and after thermo-mechanical aging procedure. 5.ConclusionOCT acted as a useful tool for the nondestructive assessment and interpretation of the adaptive behavior of dental adhesives through restored cavity, provided that dental cavity walls make certain inclination with regard to OCT beam and appropriate analytic approach was used. Some 1-SEAs obtained internal sealing capacity comparable to the control 2-SEA. Statistically significant SI% correlation was found between SS-OCT and CLSM; moreover, the location of gaps in 1-SEAs observed under CLSM occurred not only at dentine–adhesive interfaces but also, frequently, at adhesive–composite interfaces. AcknowledgmentsThis work was supported, in part, by a Grant-in-Aid for Scientific Research (Nos. 23390432 and 24792019) from Japan Society for the Promotion of Science and a Research Grant for Longevity Sciences (21A-8) from Ministry of Health, Labor and Welfare. The funding sources had no involvement in conducting and reporting the study. The adhesive materials and the composite used in the experiment were each donated for research by their respective manufacturer. Authors are grateful to Analytics Japan Co. for their assistance in the development of the software plugin for image analysis in this work. ReferencesK. L. Van Landuytet al.,
“Are one-step adhesives easier to use and better performing? Multifactorial assessment of contemporary one-step self-etching adhesives,”
J. Adhes. Dent., 11
(3), 175
–190
(2009). 1461-5185 Google Scholar
M. Peumanset al.,
“Clinical effectiveness of contemporary adhesives: a systematic review of current clinical trials,”
Dent. Mater., 21
(9), 864
–881
(2005). http://dx.doi.org/10.1016/j.dental.2005.02.003 DEMAEP 0109-5641 Google Scholar
J. Perdigaoet al.,
“In vitro bonding performance of all-in-one adhesives. Part I—Microtensile bond strengths,”
J. Adhes. Dent., 8
(6), 367
–373
(2006). 1461-5185 Google Scholar
K. L. Van Landuytet al.,
“Filler debonding and subhybrid-layer failures in self-etch adhesives,”
J. Dent. Res., 89
(10), 1045
–1050
(2010). http://dx.doi.org/10.1177/0022034510375285 JDREAF 0022-0345 Google Scholar
Y. Kinomotoet al.,
“Polymerization contraction stresses of resin-based composite restorations within beveled cavity preparations of class I restorations,”
Am. J. Dent., 16
(2), 139
–143
(2003). 0894-8275 Google Scholar
M. Braemet al.,
“The impact of composite structure on its elastic response,”
J. Dent. Res., 65
(5), 648
–653
(1986). http://dx.doi.org/10.1177/00220345860650050301 JDREAF 0022-0345 Google Scholar
C. M. Kemp-ScholteC. L. Davidson,
“Complete marginal seal of class V resin composite restorations effected by increased flexibility,”
J. Dent. Res., 69
(6), 1240
–1243
(1990). http://dx.doi.org/10.1177/00220345900690060301 JDREAF 0022-0345 Google Scholar
B. Van Meerbeeket al.,
“Relationship between bond-strength tests and clinical outcomes,”
Dent. Mater., 26
(2), E100
–E121
(2010). http://dx.doi.org/10.1016/j.dental.2009.11.148 DEMAEP 0109-5641 Google Scholar
J. De Muncket al.,
“A critical review of the durability of adhesion to tooth tissue: methods and results,”
J. Dent. Res., 84
(2), 118
–132
(2005). http://dx.doi.org/10.1177/154405910508400204 JDREAF 0022-0345 Google Scholar
C. C. Bonifacioet al.,
“Micro-mechanical bond strength tests for the assessment of the adhesion of GIC to dentine,”
Acta Odontol. Scand., 70
(6), 555
–563
(2012). http://dx.doi.org/10.3109/00016357.2011.640280 AOSCAQ 0001-6357 Google Scholar
S. PhrukkanonM. F. BurrowM. J. Tyas,
“The influence of cross-sectional shape and surface area on the microtensile bond test,”
Dent. Mater., 14
(3), 212
–221
(1998). http://dx.doi.org/10.1016/S0109-5641(98)00034-7 DEMAEP 0109-5641 Google Scholar
S. SudsangiamR. van Noort,
“Do dentin bond strength tests serve a useful purpose?,”
J. Adhes. Dent., 1
(1), 57
–67
(1999). 1461-5185 Google Scholar
J. F. Rouletet al.,
“Quantitative margin analysis in the scanning electron microscope,”
Scanning Microsc., 3
(1), 147
–159
(1989). SCMIEU 0891-7035 Google Scholar
L. Zhenget al.,
“Relationship between adhesive thickness and microtensile bond strength,”
Oper. Dent., 26
(1), 97
–104
(2001). Google Scholar
T. A. Bakhshet al.,
“Concurrent evaluation of composite internal adaptation and bond strength in a class-I cavity,”
J. Dent., 41
(1), 60
–70
(2013). http://dx.doi.org/10.1016/j.jdent.2012.10.003 JDENAB 0300-5712 Google Scholar
T. A. Bakhshet al.,
“Non-invasive quantification of resin-dentin interfacial gaps using optical coherence tomography: validation against confocal microscopy,”
Dent. Mater., 27
(9), 915
–925
(2011). http://dx.doi.org/10.1016/j.dental.2011.05.003 DEMAEP 0109-5641 Google Scholar
P. Makishiet al.,
“Non-destructive 3D imaging of composite restorations using optical coherence tomography: marginal adaptation of self-etch adhesives,”
J. Dent., 39
(4), 316
–325
(2011). http://dx.doi.org/10.1016/j.jdent.2011.01.011 JDENAB 0300-5712 Google Scholar
A. Sadret al.,
“Swept source optical coherence tomography for quantitative and qualitative assessment of dental composite restorations,”
Proc. SPIE, 7884 78840C
(2011). http://dx.doi.org/10.1117/12.877351 PSISDG 0277-786X Google Scholar
J. G. Fujimoto,
“Optical coherence tomography for ultrahigh resolution in vivo imaging,”
Nat. Biotechnol., 21
(11), 1361
–1367
(2003). http://dx.doi.org/10.1038/nbt892 NABIF9 1087-0156 Google Scholar
D. Huanget al.,
“Optical coherence tomography,”
Science, 254
(5035), 1178
–1181
(1991). http://dx.doi.org/10.1126/science.1957169 SCIEAS 0036-8075 Google Scholar
M. Chomaet al.,
“Sensitivity advantage of swept source and Fourier domain optical coherence tomography,”
Opt. Express, 11
(18), 2183
–2189
(2003). http://dx.doi.org/10.1364/OE.11.002183 OPEXFF 1094-4087 Google Scholar
R. LeitgebC. HitzenbergerA. Fercher,
“Performance of Fourier domain vs. time domain optical coherence tomography,”
Opt. Express, 11
(8), 889
–894
(2003). http://dx.doi.org/10.1364/OE.11.000889 OPEXFF 1094-4087 Google Scholar
K. Ishibashiet al.,
“Swept-source optical coherence tomography as a new tool to evaluate defects of resin-based composite restorations,”
J. Dent., 39
(8), 543
–548
(2011). http://dx.doi.org/10.1016/j.jdent.2011.05.005 JDENAB 0300-5712 Google Scholar
A. Nazariet al.,
“Non-destructive characterization of voids in six flowable composites using swept-source optical coherence tomography,”
Dent. Mater., 29
(3), 278
–286
(2013). http://dx.doi.org/10.1016/j.dental.2012.11.004 DEMAEP 0109-5641 Google Scholar
I. Haririet al.,
“Effects of structural orientation of enamel and dentine on light attenuation and local refractive index: an optical coherence tomography study,”
J. Dent., 40
(5), 387
–396
(2012). http://dx.doi.org/10.1016/j.jdent.2012.01.017 JDENAB 0300-5712 Google Scholar
I. Haririet al.,
“Estimation of the enamel and dentin mineral content from the refractive index,”
Caries Res., 47
(1), 18
–26
(2013). http://dx.doi.org/10.1159/000342416 CAREBK 0008-6568 Google Scholar
C. Lammeieret al.,
“Influence of dental resin material composition on cross-polarization-optical coherence tomography imaging,”
J. Biomed. Opt., 17
(10), 106002
(2012). http://dx.doi.org/10.1117/1.JBO.17.10.106002 JBOPFO 1083-3668 Google Scholar
J. L. Ferracane,
“Developing a more complete understanding of stresses produced in dental composites during polymerization,”
Dent. Mater., 21
(1), 36
–42
(2005). http://dx.doi.org/10.1016/j.dental.2004.10.004 DEMAEP 0109-5641 Google Scholar
C. L. DavidsonA. J. DegeeA. Feilzer,
“The competition between the composite-dentin bond strength and the polymerization contraction stress,”
J. Dent. Res., 63
(12), 1396
–1399
(1984). http://dx.doi.org/10.1177/00220345840630121101 JDREAF 0022-0345 Google Scholar
R. M. Carvalhoet al.,
“A review of polymerization contraction: the influence of stress development versus stress relief,”
Oper. Dent., 21
(1), 17
–24
(1996). Google Scholar
K. L. Van Landuytet al.,
“Systematic review of the chemical composition of contemporary dental adhesives,”
Biomater., 28
(26), 3757
–3785
(2007). http://dx.doi.org/10.1016/j.biomaterials.2007.04.044 BIMADU 0142-9612 Google Scholar
N. Hiraishiet al.,
“Water concentration in self-etching primers affects their aggressiveness and bonding efficacy to dentin,”
J. Dent. Res., 84
(7), 653
–658
(2005). http://dx.doi.org/10.1177/154405910508400714 JDREAF 0022-0345 Google Scholar
R. Walteret al.,
“Two-year bond strengths of “all-in-one” adhesives to dentine,”
J. Dent., 40
(7), 549
–555
(2012). http://dx.doi.org/10.1016/j.jdent.2012.03.003 JDENAB 0300-5712 Google Scholar
F. R. TayD. H. Pashley,
“Have dentin adhesives become too hydrophilic?,”
J. Can. Dent. Assoc., 69
(11), 726
–731
(2003). JCDAAS 0008-3372 Google Scholar
Y. Yoshidaet al.,
“Comparative study on adhesive performance of functional monomers,”
J. Dent. Res., 83
(6), 454
–458
(2004). http://dx.doi.org/10.1177/154405910408300604 JDREAF 0022-0345 Google Scholar
H. Nurrohmanet al.,
“Apatite crystal protection against acid-attack beneath resin-dentin interface with four adhesives: TEM and crystallography evidence,”
Dent. Mater., 28
(7), E89
–E98
(2012). http://dx.doi.org/10.1016/j.dental.2012.04.025 DEMAEP 0109-5641 Google Scholar
N. NakabayashiK. Takarada,
“Effect of HEMA on bonding to dentin,”
Dent. Mater., 8
(2), 125
–130
(1992). http://dx.doi.org/10.1016/0109-5641(92)90067-M DEMAEP 0109-5641 Google Scholar
K. L. Van Landuytet al.,
“Monomer-solvent phase separation in one-step self-etch adhesives,”
J. Dent. Res., 84
(2), 183
–188
(2005). http://dx.doi.org/10.1177/154405910508400214 JDREAF 0022-0345 Google Scholar
B. Van Meerbeeket al.,
“Correlative transmission electron microscopy examination of nondemineralized and demineralized resin-dentin interfaces formed by two dentin adhesive systems,”
J. Dent. Res., 75
(3), 879
–888
(1996). http://dx.doi.org/10.1177/00220345960750030401 JDREAF 0022-0345 Google Scholar
T. Nikaidoet al.,
“Effect of functional monomers in all-in-one adhesive systems on formation of enamel/dentin acid-base resistant zone,”
Dent. Mater. J., 30
(5), 576
–582
(2011). DMJOD5 Google Scholar
E. Osorioet al.,
“Differential nanofiller cluster formations in dental adhesive systems,”
Microsc. Res. Tech., 75
(6), 749
–757
(2012). http://dx.doi.org/10.1002/jemt.v75.6 MRTEEO 1059-910X Google Scholar
|


