
|
|
1.IntroductionAs a branch of photoacoustic microscopy (PAM), laser-scanning PAM (LS-PAM)1–3 is an emerging high-speed, high-resolution three-dimensional (3-D) imaging technology based on optical-absorption contrast. Recently, photoacoustic ophthalmoscopy (PAOM) has successfully extended LS-PAM to ophthalmic imaging, which is capable of imaging the retinal microvasculature and retinal pigment epithelium without mechanically scanning the ultrasonic transducer.4 By providing specific optical-absorption imaging of the retina, PAOM is promising in the early diagnosis of many retinal diseases, such as diabetic retinopathy and age-related macular degeneration.5,6 The image quality of PAOM is governed by three parameters: image resolution, image contrast, and field of view (FOV). The spatial resolution of PAOM is determined by both optics and the ultrasonic transducer. The smallest achievable spot size of the illuminating light determines the lateral resolution, while the center frequency and the bandwidth of the ultrasonic transducer determine the axial resolution. Thus, a high-frequency transducer is required for PAOM to resolve the retinal blood vessels from the retinal pigment epithelium layer for quantitative functional studies.7 Due to ocular safety concerns, the laser pulse energy must be below the ANSI safety limit. As a result, the sensitivity of the ultrasonic transducer plays a key role in determining the contrast-to-noise ratio (CNR) of PAOM, which in turn is determined by the geometry, frequency, and piezoelectric material of the ultrasonic transducers. Geometry such as the aperture size was related to clamped dielectric permittivity. For example, material of higher clamped dielectric permittivity was suitable for making a small aperture size transducer and a mismatch of aperture reduces the detection sensitivity. In material selection, electromechanical coupling coefficient was directly related to the energy conversion efficiency, which determines the detection sensitivity of a transducer. Moreover, to achieve a high imaging speed and avoid mechanical scanning in ophthalmic applications, the transducer is kept stationary during imaging. Consequently, the FOV is determined by the effective beam width of the ultrasonic transducer. Generally, the sound field of an ultrasonic transducer is divided into two parts: the near-field and the far-field with a transitional focal zone in between. Different from conventional PAM, which uses a confocal configuration where the illuminating light is focused in the focal zone of a focused ultrasonic transducer, the imaging target in PAOM is placed in the far-field of an unfocused transducer to provide an FOV as large as possible.8 For practical applications of PAOM, the FOV will need to be improved in order to facilitate the alignment of the optical illumination and the orientation of the transducer. A question was then raised: can we improve the FOV by using a focused transducer in the far-field? Compared with an unfocused transducer, a focused ultrasonic transducer has a narrower ultrasonic beam around the focal zone, while in the far-field, the ultrasonic beam becomes more divergent and may provide a larger FOV. However, a foreseeable tradeoff is that the detection sensitivity is lower in the far-field of such a transducer. Although many efforts are being carried out in high-frequency transducer design to improve PAOM image quality, an optimized design for PAOM has not yet been developed. In this paper, we report our systematic study of high-frequency ultrasonic transducers for PAOM, including piezoelectric material selection, frequency selection, and fabrication technique. 2.Methods2.1.Transducer Design and SimulationThe most critical component of designing an ultrasonic transducer is the selection of the piezoelectric material, which converts the acoustic energy to an electrical signal. Possessing good piezoelectric properties, is the most popular polycrystalline ferroelectric ceramic material for fabricating ultrasonic transducers.9,10 Besides polycrystalline ceramics, single crystals, such as (Refs. 11 and 12) and (PMN-PT),13–15 are also used for ultrasonic transducers due to their outstanding dielectric and electromechanical properties. Different from the polycrystalline ceramics, single crystals do not suffer from grain size and porosity issues when fabricating very thin piezoelectric layers and thus are more desirable for high-frequency transducers without scaling limitations.16 Both and PMN-PT have a satisfactory electromechanical coupling coefficient (e.g., , PMN-PT ), which is favorable for high-sensitivity transducers. However, PMN-PT exhibits a much higher clamped dielectric permittivity than (e.g., , PMN-PT ), which is selected for designing smaller-aperture transducers. Requiring a small aperture and high sensitivity, currently PMN-PT should be the first choice for PAOM imaging system. In general, the piezoelectric element of an ultrasonic transducer operates at its thickness mode and the resonant frequency is determined by the thickness of the piezoelectric layer given by17 The lowest resonance frequency is achieved when , where is an odd integer, and is the acoustic velocity in the piezoelectric material. The PA signal is broadband and most PAM systems use transducers with frequencies varying from 20 to 60 MHz.18 In PAOM, a 20 MHz ultrasonic transducer provides sufficient axial resolution (75 μm theoretically) to differentiate the retinal blood vessels from the retinal pigment epithelium (RPE) layer.19 A further increase in frequency may sacrifice the detection sensitivity due to the higher attenuation at higher frequencies. We first designed three unfocused transducers with different center frequencies (20, 30, and 40 MHz) to demonstrate this image quality change. To match the standard impedance of the receiver electronics, the aperture size and thickness of matching layers of the transducers were determined by using PiezoCAD (KLM model-based simulation software, Sonic Concepts, Woodinville, WA). The thickness of the polarized PMN-PT material for 20, 30, and 40 MHz transducer were also optimized by PiezoCAD and lapped to be 100, 65, and 40 μm, respectively. The general fabrication technique described by Cannata et al.12 was modified and used in this study. A first matching layer was laid over to the negative electrode (front site) of PMN-PT material to facilitate the efficient acoustic energy transfer between the PMN-PT element with high acoustic impedance and the water medium. The matching layer had a thickness of ( is the wavelength in the material of the matching layer) and was made of a mixture of three parts 2–3 μm silver particles (Adrich Chem. Co., Milwaukee, Wisconsin) and 1.25 parts Insulcast 501 epoxy (American Safety Technologies, Roseland, New Jersey). A conductive backing material (E-SOLDER 3022, Von Roll Isola Inc., New Haven, Connecticut) was cured separately over the back of the PMN-PT element to damp the energy radiation from the back site of the element and provide structural support. Before assembling the functional element into the steel needle housing, an electrical connector was fixed into the backing material. Finally, parylene was vapor deposited on the whole transducer as a second matching layer and protective coating. A picture and the 3-D cutting drawing of the transducer are shown in Figs. 1(a) and 1(b), respectively. Fig. 1(a) Actual image of the needle transducer. (b) Three-dimensional cutting drawing of the transducer design.  Normally, focusing increases the sensitivity around the focal zone of the high-frequency ultrasonic transducer in pulse-echo imaging. According to acoustic reciprocity, the transmitting pressure response at an imaging point from a transducer is identical to that received by the transducer from a point source. In the far-field, the beam profile of the focused ultrasonic transducer diverges and may provide a larger FOV. To study the focusing effect on PAOM imaging, we designed and fabricated a 30 MHz focused transducer to make a comparison study with the 30 MHz unfocused transducer. Both of the transducers have a square shape with an aperture size of 0.5 mm. To make the focused transducer, a spherical ball of 1 mm radius was used to mechanically press on its functional element to achieve an number (F#) of 2 with the manufacturing process detailed below. A mold was customized to fit the size of the steel needle housing and align concentrically the needle housing with the spherical ball. The mold and transducer were incubated at temperatures during the press-focusing process and then cooled down to room temperature before the focusing was achieved. Since the incubated temperature may exceed the depoling temperature (60 to 95°C) for binary PMN-PT crystal, the focused transducer was poled in a DC electric field of for 5 min at room temperature to induce the piezoelectric effect. The sound fields of the two transducers were simulated using Field II with the same design parameters to visualize the effect of focusing on the FOV.20,21 The simulation data were then compared to the in vivo imaging results. 2.2.Experimental SystemFigure 2 shows a schematic of the experimental system. The illuminating light source was a frequency-doubled Q-switched Nd:YAG laser (SPOT-10-100-532, Elforlight Ltd, Daventry, UK: 532 nm; ; 2 ns pulse duration; maximal pulse repetition rate: 30 kHz). The output laser light was first attenuated with a neutral density (ND) filter before being coupled into a single-mode optical fiber. The light reflected from the surface of the ND filter is detected by a photodiode to provide the trigger signal for PAOM data acquisition. The output laser light from the fiber was collimated into a beam diameter of 6 mm, combined with the probing light of a spectra-domain optical coherence tomography by a hot mirror (Edmund Inc., Barrington), reflected by a mirror, scanned by an X-Y galvanometer, and finally delivered to the eye through a lens system consisting of an achromatic relay lens () and an ocular lens (). When imaging a sample other than the retina in vivo, e.g., black tape, the ocular lens was removed and the relay lens was replaced with an objective lens (). The galvanometer scanner was controlled by an analogue-output board, whose sample clock was used to trigger the laser. Fig. 2Schematic of laser scanning photoacoustic microscopy system. ND, neutral density filter; PD, photodiode; I, iris; SMF: single-mode fiber; HM, hot mirror; UT, ultrasonic transducer; SLD, superluminescent diode; PC, polarization controller; L1 to L4, lens; FP, fiberport; M, mirror.  The induced PA waves from the sample were detected by an ultrasonic transducer, which was placed in contact with the eyelid coupled by ultrasound gel. The detected PA signals were first amplified by 66 dB and then digitized by a high-speed digitizer (CompuScope14200, Gage Applied Technologies, Lachine, Canada) at a sampling rate of . In our current study, the laser pulse energy was measured to be 40 nJ after the ocular lens, which is lower than the ANSI safety limit. The OCT was used mainly for imaging guidance to reduce visible light exposure to the eye. During alignment, only the OCT light was on. After the retinal region of interest was identified and the OCT image was optimized, the OCT light was turned off and the PAOM imaging mode was activated. 2.3.Imaging SubjectsWe characterized the frequency response of the transducers and their performances in imaging in vivo samples. The transducer’s frequency response was measured by pulse-echo test in a deionized water bath at room temperature. Similar to the in vivo imaging condition, an X-cut quartz was placed 6 mm away from the transducer as the reflecting target. The transducers were excited by a 70 Vpp broadband negative pulse from a pulser/receiver. The center frequency () and fractional bandwidth (BW) are determined by the following equations: where and are defined as the lower and upper frequencies. The axial resolution of PAOM is determined by the center frequency and bandwidth of the transducer, which can be theoretically estimated by the equation where is the speed of sound. A 6-μm-diameter tungsten wire was imaged to determine the axial resolution of the transducer.For in vivo experiments, the eyes of albino rats with normal retina were imaged (Sprague Dawley rats, body weight: 300 to 450 g, Charles Rivers). The animals were anesthetized by intraperitoneal injection of a cocktail containing Ketamine ( body weight) and Xylazine ( body weight). Before imaging, the pupils were dilated with 10% Phenylephrine solution. After anesthetization, the animals were restrained in a mounting tube, which was fixed on a five-axis platform. Raster scans with the fast axis along the horizontal direction were performed. The scan angle spanned for imaging the rat retina. All experiments were performed in compliance with the guidelines of the University of Southern California’s Institutional Animal Care and Use Committee. 3.Results and Discussions3.1.Transducer PerformanceThe pulse-echo measurement results and frequency response of the three unfocused transducers are displayed in Figs. 3(a) to 3(c). For the 20 MHz transducer, the peak-to-peak amplitude of the echo signal was 648 mV without gain at a reflection distance of 6 mm and a time delay of 8 μs. The measured and BW were 17 MHz and 37%. The 30 MHz transducer had an echo signal amplitude of 564 mVpp, of 30.5 MHz, and BW of 53%, respectively. The 40 MHz transducer had an echo signal amplitude of 430 mVpp, of 39 MHz, and BW of 39%, respectively. The measured axial resolutions of the 20, 30, and 40 MHz transducers were 78, 46, and 37 μm, respectively. For these three unfocused transducers, the measured center frequencies were in good agreement with the PiezoCAD simulation, while the 20 MHz transducer had the highest sensitivity as expected. Fig. 3(a) Frequency response of 20 MHz transducer at 6 mm (: 17 MHz, BW: 37%). (b) Frequency response of 30 MHz transducer at 6 mm (: 30.5 MHz, BW: 53%). (c) Frequency response of 40 MHz transducer at 6 mm (: 39 MHz, BW: 39%). (d) Frequency response of 30 MHz focused transducer () at 6 mm (: 30 MHz, BW: 60%). 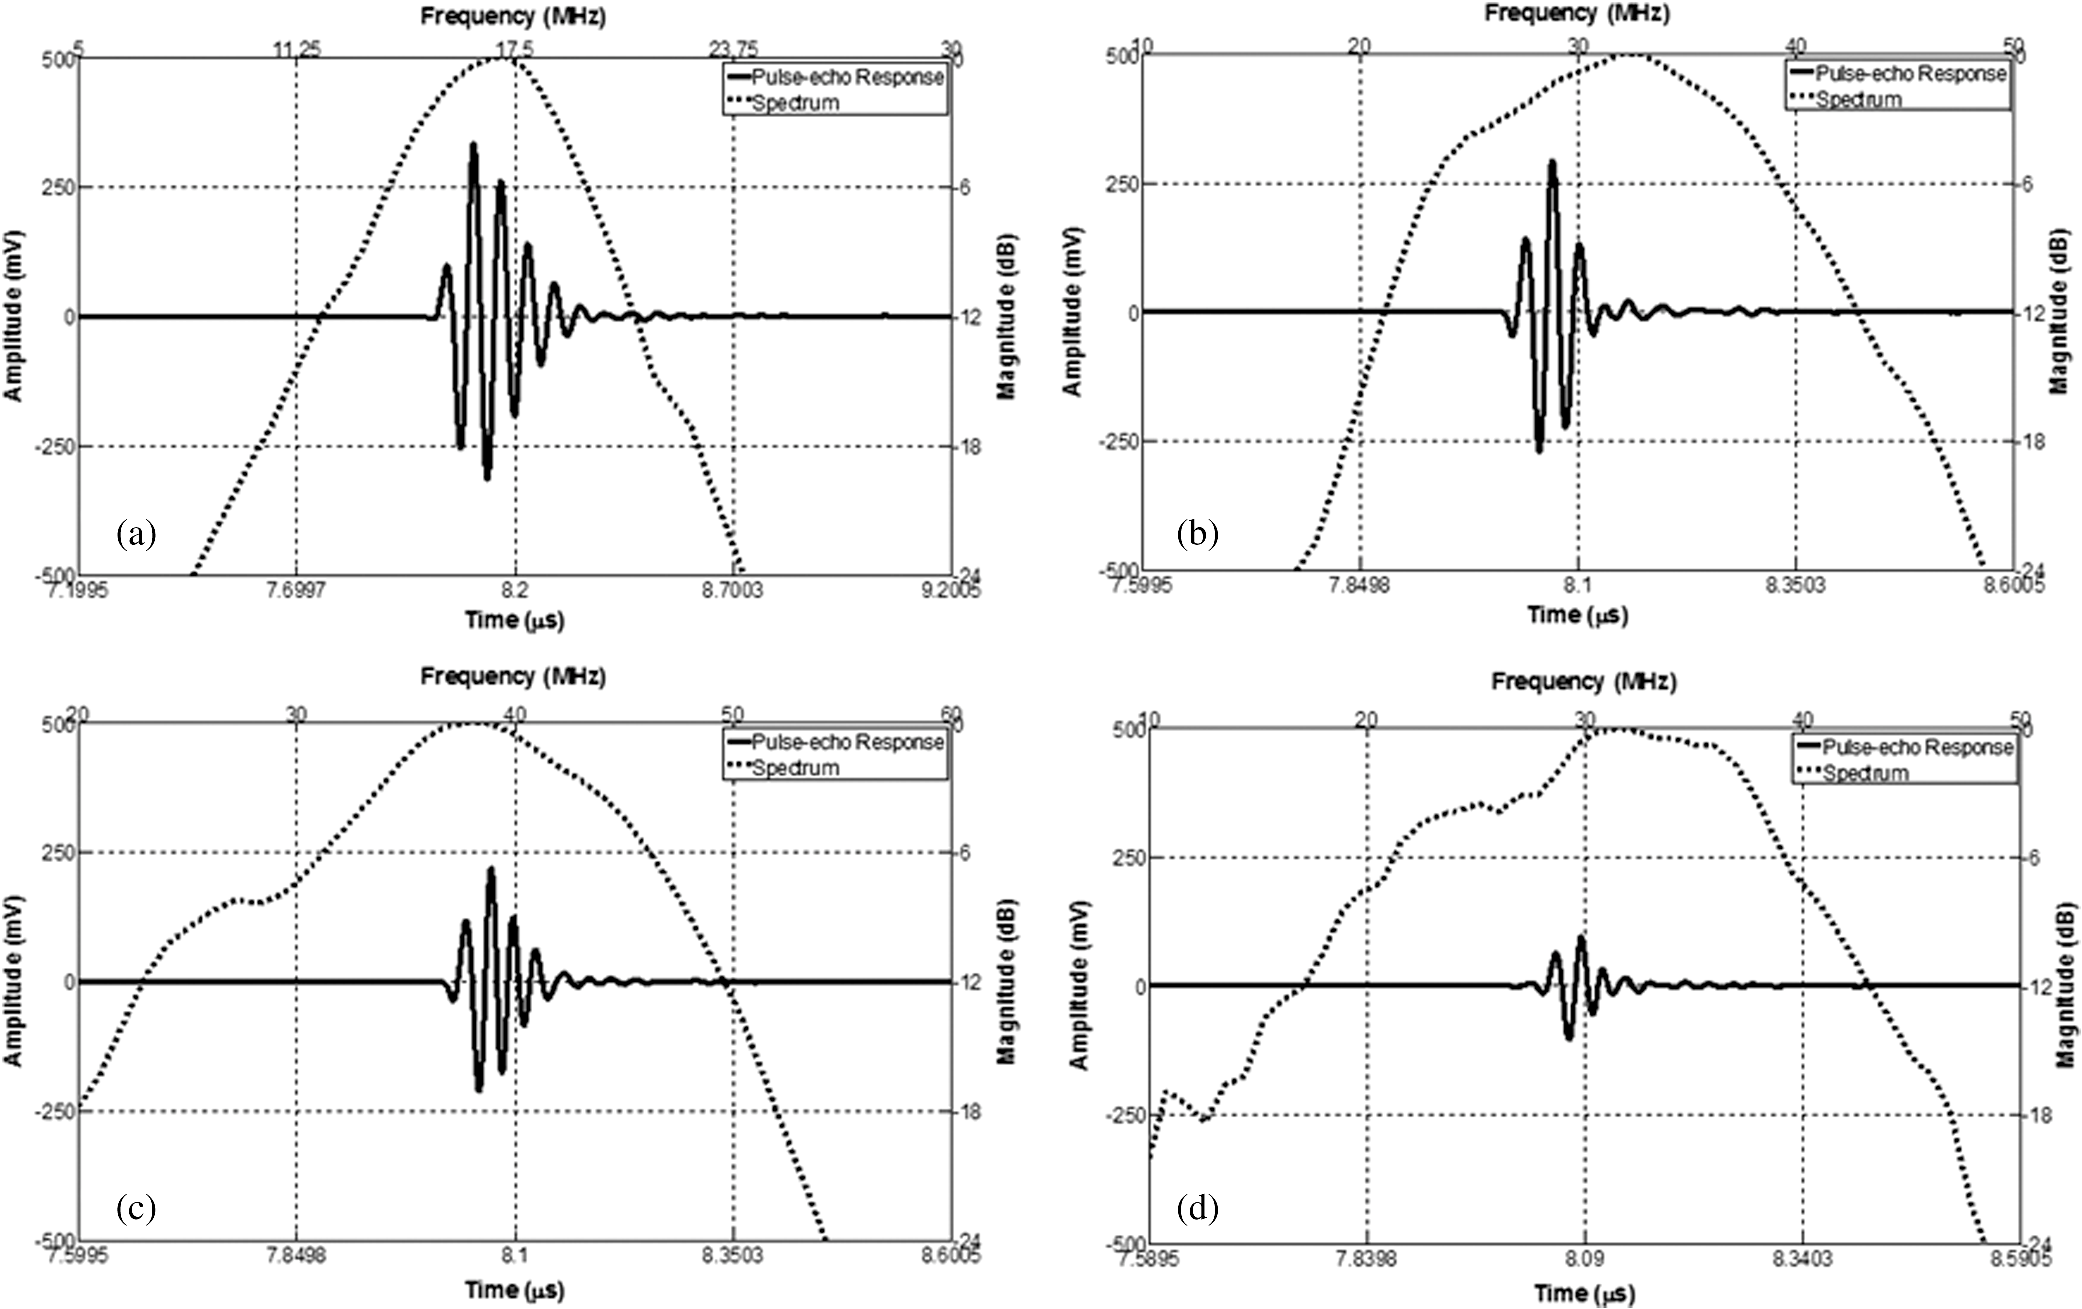 The frequency response of the 30 MHz focused transducer is shown in Fig. 3(d). The measured echo signal amplitude, center frequency, and bandwidth were 199 mVpp, 30 MHz, and 60%, respectively. Compared with the 30 MHz unfocused transducer, the 30 MHz focused transducer exhibited a broader bandwidth and a better axial resolution of 37 μm. However, it had a relatively irregular spectrum, which can be attributed to the slight degradation of piezoelectric properties caused by the mechanical pressing. According to the previous study by Knapik et al.,22 the mechanical losses would increase and electromechanical coupling in the devices would decrease after the press-focusing process, but the reported sensitivity did not appear to be significantly affected at the focal point. Nevertheless, note that the pulse-echo measurement was conducted at a distance (6 mm) far beyond its focal point (1 mm), where the transducer’s beam had diverged significantly into the far-field. Therefore, in contrast to the unfocused transducer, the focused transducers’ loss of sensitivity in the far-field was mainly caused by the focusing effect. 3.2.Effect of Transducer Center Frequency on PAOM ImageThe maximum-amplitude projection (MAP) PAOM images of the same albino rat’s eye acquired with the three unfocused transducers are shown in Figs. 4(a) to 4(c) (all of the three images are displayed in the same dynamic range of 25 dB). The major retinal blood vessels were clearly displayed with high PA signals within the FOV of the three images. In the retinal blood vessels, the PA signals originated from the high optical absorption of hemoglobin in the red blood cells. Since there is no melanin in the RPE cells of an albino rat, the laser light penetrated through the RPE layer into the choroid without generating PA signals in the RPE layer. As a result, the densely packed capillary vessel network appeared in the PAOM images indicated by the red arrow. The 20 MHz transducer [Fig. 4(a)] provided the highest contrast for the retinal blood vessels, and only the 20 MHz transducer can capture the choroidal vessels in the whole FOV, while the choroid layer was only partially captured by the 30 MHz [Fig. 4(b)] and 40 MHz [Fig. 4(c)] transducers. None of the three transducers were able to resolve a single capillary in the choroid by using the divergent receiving field far away from the focal zone. Fig. 4Maximum-amplitude projection photoacoustic ophthalmoscopy (MAP-PAOM) images of albino rats captured by (a) 20 MHz, (b) 30 MHz, and (c) 40 MHz ultrasonic transducers. B-scan images of corresponding red dashed line in MAP images by (d) 20 MHz, (e) 30 MHz, and (f) 40 MHz ultrasonic transducers. Scale bar: 200 μm. 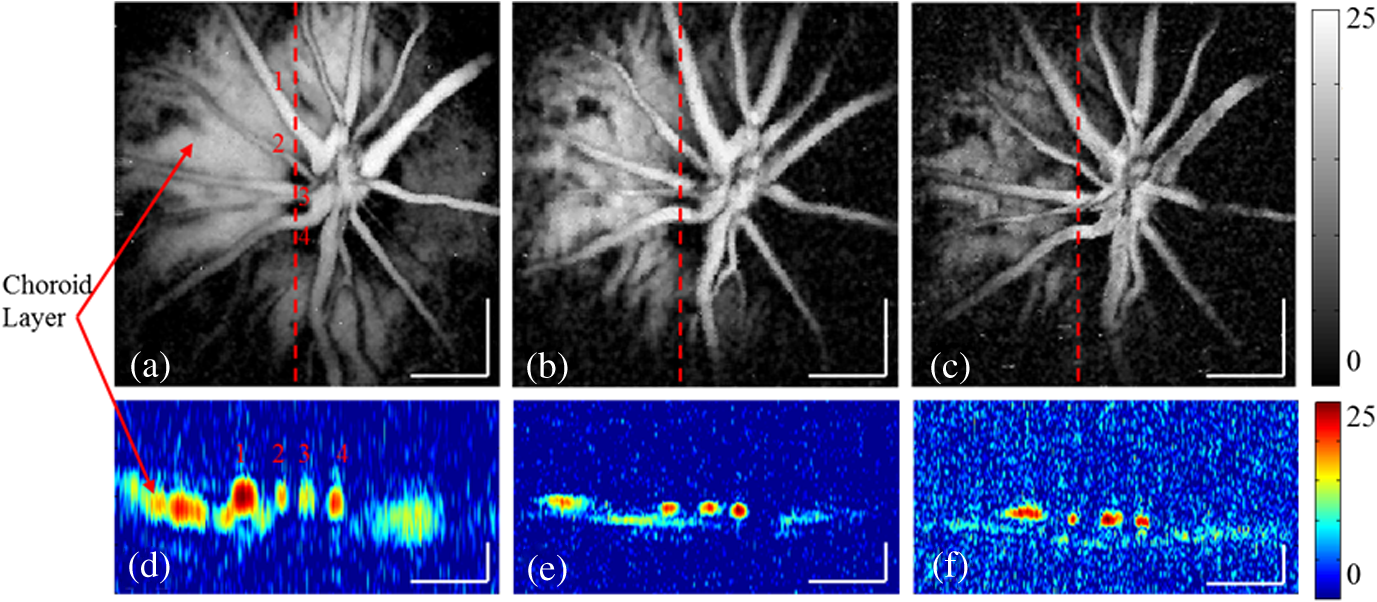 The CNR was calculated by using the following equation:23,24 where and denote the mean of the signal of the imaging target and the mean of the background noise; and represent the signal variance of the imaging target and the background noise. In this case, the imaging target is the main retinal blood vessels that can be extracted from the 3-D PAOM data. The 20 MHz transducer provided the highest CNR of 16.5 dB, followed by the 30 MHz transducer of 14 dB, and then the 40 MHz transducer of 10.4 dB. The CNR value of the MAP image of PAOM could be a parameter representing the transducer’s detection sensitivity for the broadband PA signal. These results generally agreed with the pulse-echo measurements in Sec. 3.1. Since the PA signal originated in the far-field of the ultrasonic transducer, the acoustic attenuation was the dominant factor affecting the detection sensitivity, which proportionally increases with the frequency. The acoustic attenuation is defined as where is the attenuation coefficient at 1 MHz and is a frequency-dependent parameter. In other words, the relatively lower-frequency components in the PA signal were attenuated less than the higher-frequency components during the propagation in ocular tissue. Therefore, the 20 MHz transducer’s bandwidth had a better match for the lower-frequency components of the PA signal and provided better detection sensitivity than the higher-frequency transducers. The corresponding B-scan images of the dashed line in Figs. 4(a) to 4(c) are shown in Figs. 4(d) to 4(f), respectively. The retinal blood vessels could be differentiated from the choroid layer along the axial direction. The four retinal vessels indicated by numbers 1 to 4 in Fig. 4(d) are displayed with their corresponding lateral position and size. Compared with retinal vessel No. 1, retinal vessel Nos. 2 to 4 just came out of the optical disc without choroid capillaries shown behind. The 40 MHz transducer has the highest axial resolution followed by the 30 and 20 MHz transducers, which agreed with the wire phantom results. Even though the axial resolution was affected by the center frequency of the ultrasonic transducer, the 20 MHz transducer had sufficient axial resolution to resolve retinal vessels in rat eye imaging in our experiments. All three MAP images showed no noticeable difference in the lateral resolution because the spot size of the illuminating light determined lateral resolution. These results suggest that when applying PAOM to human retinal imaging, due to the much larger size of human eye, reducing the transducer’s frequency could be an effective way to achieve better PAOM imaging quality.3.3.Effect of Transducer Focusing on PAOM ImageThe simulation results of both the unfocused and focused transducers are shown in Fig. 5. The unfocused transducer had a natural focal zone located at 1.5 mm, and the focused transducer () had a focal length of 1 mm. The beam profile 6 mm away from the transducer surface, where the rat retina was placed during in vivo imaging, shows that the focused transducer has a wider beam width to form a larger FOV, but a reduced sensitivity. To quantitatively estimate the FOV of the transducer, we imaged a black tape target. The full width of half maximum of the MAP of the received PA signals was calculated to provide an approximation of the transducers’ FOV. The intensity MAP retinal images were also processed to quantitatively measure the FOV in actual retinal images by using the same evaluation criteria. Figures 6(a) and 6(e) show the rat retinal images captured by the 30 MHz unfocused and focused transducers, respectively. The FOVs of the two images (indicated by the yellow circle) were estimated to be 0.8 and 1.0 mm in diameter in the intensity images [Figs. 6(b) and 6(f)], demonstrating that focusing was capable of providing approximately a 20% increase of FOV, which also agreed with the results of imaging with the black tape target. The B-scan images of the green dashed line in Figs. 6(a) and 6(e) are shown in Figs. 6(c) and 6(g). The unfocused transducer could only resolve two retinal vessels due to its limited FOV, while the focused transducer could still clearly differentiate three retinal vessels even with a relatively high noise level at the edge of the FOV. A tiny side branch of retinal vessels indicated by the dashed circle was resolved by the focused transducer in the MAP image [Fig. 6(e)] and B-scan image [Fig. 6(h)]; however, it did not appear in both MAP [Fig. 6(a)] and B-scan images [Fig. 6(d)] captured by the unfocused transducer. The two sets of B-scan images also proved that focusing could effectively enlarge the FOV in PAOM imaging. Nevertheless, the detection sensitivity of the focused transducer obviously dropped to a CNR of 10.8 dB compared with that (CNR of 14.8 dB) of the image obtained by the unfocused transducer. Since both transducers have a center frequency of , other than the FOV difference, the images provided similar anatomical information of the retina as was previously described. Consequently, the comparison study reasonably agrees with the Field II simulation results and shows that the unfocused and focused transducers exhibited their respective strengths in PAOM imaging. Fig. 5(a) Acoustic field of the 30 MHz unfocused transducer. (b) Acoustic field of the 30 MHz focused transducer. (c) Lateral pressure profile 6 mm away from the 30 MHz unfocused transducer. (d) Lateral pressure profile 6 mm away from the 30 MHz focused transducer.  Fig. 6MAP-PAOM images of albino rat retina captured by 30 MHz (a) unfocused and (e) focused () ultrasonic transducers. (b) and (f) intensity images of (a) and (e). (c) and (g) PAOM B-scan images marked by green dashed line and red dashed line in (a). (d) and (h) PAOM B-scan images marked by green dashed line and red dashed line in (e). Scale bar: 200 μm.  4.ConclusionsWe have carried out a systematic study on the ultrasonic transducers at high frequencies specifically designed for PAOM. Both ex vivo and in vivo imaging experiments were conducted to compare and evaluate the designs. From the experimental results we can conclude that the 20 MHz transducer has an advantage of better detection sensitivity while providing sufficient image resolution. In addition, focusing could effectively increase the FOV of PAOM image but with a tradeoff of degrading the detection sensitivity. We hope this study may help the future development of transducers in clinical applications of PAOM. AcknowledgmentsThis work is supported in part by the following grants: National Institutes of Health grant P41-EB2182, 7R21EB008800-02 and 1R01EY019951. ReferencesH. F. Zhanget al.,
“Laser-scanning optical-resolution photoacoustic microscopy,”
Proc. SPIE, 7177 71770L
(2009). http://dx.doi.org/10.1117/12.815396 PSISDG 0277-786X Google Scholar
S. HuL. V. Wang,
“Photoacoustic imaging and characterization of the microvasculature,”
J. Biomed. Opt., 15
(1), 011101
(2010). http://dx.doi.org/10.1117/1.3281673 JBOPFO 1083-3668 Google Scholar
Z. Xieet al.,
“Laser-scanning optical-resolution photoacoustic microscopy,”
Opt. Lett., 34
(12), 1771
–1773
(2009). http://dx.doi.org/10.1364/OL.34.001771 OPLEDP 0146-9592 Google Scholar
S. Jiaoet al.,
“Photoacoustic ophthalmoscopy for in vivo retinal imaging,”
Opt. Express, 18
(4), 3967
–3972
(2010). http://dx.doi.org/10.1364/OE.18.003967 OPEXFF 1094-4087 Google Scholar
H. F. Zhanget al.,
“Simultaneous in vivo imaging of melanin and lipofuscin in retina with photoacoustic ophthalmoscopy and autofluorescence imaging,”
J. Biomed. Opt., 16
(8), 080504
(2011). http://dx.doi.org/10.1117/1.3606569 Google Scholar
H. F. Zhanget al.,
“Imaging of hemoglobin oxygen saturation variations in single vessels in vivo using photoacoustic microscopy,”
Appl. Phys. Lett., 90
(5), 053901
(2007). APPLAB 0003-6951 Google Scholar
H. F. ZhangC. A. PuliafitoS. Jiao,
“Photoacoustic ophthalmoscopy for in vivo retinal imaging: current status and prospects,”
Ophthalmic Surg. Lasers Imaging, 42 S106
–S115
(2011). http://dx.doi.org/10.3928/15428877-20110627-10 1542-8877 Google Scholar
F. Zhenget al.,
“Laser-scanning photoacoustic microscopy with ultrasonic phased array transducer,”
Biomed. Opt. Express, 3
(11), 2694
–2699
(2012). http://dx.doi.org/10.1364/BOE.3.002694 BOEICL 2156-7085 Google Scholar
G. H. Haertling,
“Ferroelectric ceramics: history, and technology,”
J. Am. Ceram. Soc., 82
(4), 797
–818
(1999). http://dx.doi.org/10.1111/j.1151-2916.1999.tb01840.x JACTAW 0002-7820 Google Scholar
K. F. Cheunget al.,
“Performance enhancement of a piezoelectric linear array transducer by half-concave geometric design,”
Sens. Actuators A Phys., 172
(2), 511
–515
(2011). http://dx.doi.org/10.1016/j.sna.2011.09.035 SAAPEB 0924-4247 Google Scholar
K. H. Lamet al.,
“Ultrahigh frequency lensless ultrasonic transducers for acoustic tweezers application,”
Biotechnol. Bioeng., 110
(3), 881
–886
(2013). http://dx.doi.org/10.1002/bit.24735 BIBIAU 0006-3592 Google Scholar
J. M. Cannataet al.,
“Design of efficient, broadband single-element (20-80 MHz) ultrasonic transducers for medical imaging applications,”
IEEE Trans. Ultrason., Ferroelectr., Freq. Control, 50
(11), 1548
–1557
(2003). http://dx.doi.org/10.1109/TUFFC.2003.1251138 ITUCER 0885-3010 Google Scholar
Q. F. Zhouet al.,
“PMN-PT single crystal, high-frequency ultrasonic needle transducers for pulsed-wave Doppler application,”
IEEE Trans. Ultrason., Ferroelectr., Freq. Control, 54
(3), 668
–675
(2007). http://dx.doi.org/10.1109/TUFFC.2007.290 ITUCER 0885-3010 Google Scholar
S. T. Lauet al.,
“Ferroelectric lead magnesium niobate-lead titanate single crystals for ultrasonic hydrophone applications,”
Mater. Sci. Eng. B Solid State Mater. Adv. Technol., 111
(1), 25
–30
(2004). http://dx.doi.org/10.1016/j.mseb.2004.02.016 MSBTEK 0921-5107 Google Scholar
K. H. Lamet al.,
“PMN-PT single crystal focusing transducer fabricated using a mechanical dimpling technique,”
Ultrasonics, 52
(1), 20
–24
(2012). http://dx.doi.org/10.1016/j.ultras.2011.06.004 ULTRA3 0041-624X Google Scholar
S. E. ParkT. R. Shrout,
“Characteristics of relaxor-based piezoelectric single crystals for ultrasonic transducers,”
IEEE Trans. Ultrason. Ferroelectr., Freq. Control, 44
(5), 1140
–1147
(1997). http://dx.doi.org/10.1109/58.655639 ITUCER 0885-3010 Google Scholar
K. K. ShungM. Zipparo,
“Ultrasonic transducers, and arrays,”
IEEE Eng. Med. Biol. Mag., 15
(6), 20
–30
(1996). http://dx.doi.org/10.1109/51.544509 IEMBDE 0739-5175 Google Scholar
L. V. Wang,
“Multiscale photoacoustic microscopy, and computed tomography,”
Nat. Photonics, 3
(9), 503
–509
(2009). http://dx.doi.org/10.1038/nphoton.2009.157 1749-4885 Google Scholar
T. S. Leeson,
“Rat retinal blood vessels,”
Can. J. Ophthalmol., 14
(1), 21
–28
(1979). CAJOBA 0008-4182 Google Scholar
J. A. JensenN. B. Svendsen,
“Calculation of pressure fields from arbitrarily shaped, apodized, and excited ultrasound transducers,”
IEEE Trans. Ultrason., Ferroelectr., Freq. Control, 39
(2), 262
–267
(1992). http://dx.doi.org/10.1109/58.139123 ITUCER 0885-3010 Google Scholar
J. A. Jensen,
“Simulation of advanced ultrasound systems using Field II,”
in IEEE Int. Symp. on Biomedical Imaging: Nano to Macro,
636
–639
(2004). Google Scholar
D. A. Knapiket al.,
“A 100–200 MHz ultrasound biomicroscope,”
IEEE Trans. Ultrason., Ferroelectr., Freq. Control, 47
(6), 1540
–1549
(2000). http://dx.doi.org/10.1109/58.883543 ITUCER 0885-3010 Google Scholar
P. C. LiM. O’Donnell,
“Elevational spatial compounding,”
Ultrason. Imaging, 16
(3), 176
–189
(1994). ULIMD4 0161-7346 Google Scholar
S. I. AwadJ. T. Yen,
“3-D spatial compounding using a row-column array,”
Ultrason. Imaging, 31
(2), 120
–130
(2009). http://dx.doi.org/10.1177/016173460903100203 ULIMD4 0161-7346 Google Scholar
BiographyTeng Ma graduated from University of Michigan (Ann Arbor, Michigan) in 2011 with a BSE degree in biomedical engineering. He received a MS degree in biomedical engineering from University of Southern California (USC) in 2013. He is pursuing his PhD degree at USC. He joined the NIH Resource on Medical Ultrasonic Transducer Technology at USC as a Research Assistant since 2011. Ruimin Chen received his BS degree from University of Electronics Science and Technology of China (UESTC), Chengdu, China and his MS degree from University of Southern California (USC), Los Angeles, California, in 2006 and 2008, respectively, both in Biomedical Engineering. He is currently a PhD candidate at the NIH Resource Center for Medical Ultrasonic Transducer Technology, USC. K. Kirk Shung received a PhD in electrical engineering from University of Washington, Seattle, Washington, in 1975. He has been a professor of biomedical engineering at USC since 2002 and the director of NIH Resource Center on Medical Ultrasonic Transducer Technology since 1997. He was appointed a dean’s professor in biomedical engineering at the Viterbi School of Engineering at USC in 2013. He is a life fellow of IEEE, and a fellow of the Acoustical Society of America and American Institute of Ultrasound in Medicine. Qifa Zhou received his PhD degree from Xi’an Jiaotong University, China in 1993. He is currently a research professor at the NIH Resource on Medical Ultrasonic Transducer Technology and the Department of Biomedical Engineering and Industry & System Engineering at University of Southern California. Before joining USC in 2002, he worked in the Materials Research Laboratory at Pennsylvania State University. He is a fellow of SPIE, a senior member of IEEE Ultrasonics, Ferroelectrics, and Frequency Control (UFFC) Society. Shuliang Jiao received his PhD from the department of Biomedical Engineering of Texas A&M University in 2003. After graduation he joined the faculty of Bascom Palmer Eye Institute of University of Miami as an assistant professor and later the Department of Ophthalmology, Keck School of Medicine of University of Southern California as an associate professor. He is currently an associate professor in the Department of Biomedical Engineering, Florida International University. His research interest is mainly focused on the development of innovative technologies for imaging and treatment of eye diseases. |


