|
|
1.IntroductionScreening is an important tool in the overall management of cancers and has led to early detection and decreased mortality rates for several cancers. Screening tests like the Pap test, fecal-occult-blood test (FOBT), and mammography have reduced the morbidity and mortality associated with cervix, colorectal, and breast cancers.1–3 Oral cancers are the 16th most common cancers in the world, with lower disease-free survival rates than occult cancers like breast and cervix. It is also the most commonly occurring cancer in Indian males and accounts for of all cancers in India.4 In spite of the amenability and accessibility of the oral cavity, oral cancers are frequently diagnosed only in advanced stages.5 Early detection of oral cancer thus remains the best way to ensure patient survival and improved quality of life.6,7 However, no definite screening test is available for oral cancer. Visual inspection followed by biopsy and histopathology is the gold standard for screening and diagnosis of oral cancers. A study has demonstrated the positive effect of visual screening on oral cancer mortality in a cluster-randomized controlled trial in India in high-risk populations.8 Adjunct techniques, like toluidine blue staining, oral cytology, tissue fluorescence (VelScope), and chemiluminescence (Vizilite)-based methods, are being explored as complementary techniques to visual inspection.9 Other optical spectroscopic techniques, like infrared (IR), fluorescence, and Raman, have also been explored for oral cancer diagnosis. Raman spectroscopy (RS), a vibrational spectroscopic method based on inelastic scattering of light,10 yields a global profile of biochemical changes in the sample. In vivo RS has shown potential in detecting premalignant conditions and cancer field effects,11,12 but their screening applications are limited by the need of involved instrumentation and strict experimental conditions. Blood test-based screening is more practical and desirable, particularly for mass screening of populous nations like India and other developing countries where oral cancer is endemic. Blood-based screening tests, like cancer antigen-125, alpha feto-protein, and prostate specific antigen, have already been employed for early detection of ovarian, liver, and prostate cancer.13–15 However, a biomarker exclusive to presence of oral cancer still eludes the scientific and medical community. As an alternative, measurement of global changes in the metabolic profile of a sample may also aid in cancer diagnosis. A recent study that investigates the entire metabolome of blood samples has shown potential in prediction of breast cancer with 80% efficiency.16 Serum RS has previously shown potential in detecting cancers like breast, colorectal, ovarian, pancreatic, and cervical cancers.17–22 Our previous studies have shown the potential of serum RS in the management of oral cancers. Diagnosis of oral cancers using both resonance and conventional Raman spectroscopy was achieved with a classification efficiency of between normal and oral cancer groups.23,24 Recurrence in oral cancers was identified by serum RS of postsurgery samples with efficiency.25 Before envisaging clinical or screening-related applications, the efficacy of serum RS in early precancer (premalignant), specific cancer detection, and evaluation of results on a large sample size is mandatory. Serum RS-based diagnosis of premalignant conditions for oral cancer, is hitherto unreported. Although serum RS has been shown to detect several cancers, the specific detection of any cancer has also not been demonstrated. In the present study, the detection of oral premalignant conditions (leukoplakia, oral submucous fibrosis, and tobacco pouch keratosis) and specific detection of oral cancer using a disease control group (nonoral cancer, i.e., glioma) was first explored. The classification between normal and oral cancer groups was then evaluated on a large cohort. Finally, the overall clinical utility of serum RS was investigated using classification models for screening. A patient-wise approach (where the average spectrum computed from all spectra of a sample/case is employed for data analysis) was employed for analysis. The findings are presented in this paper. 2.Materials and Methods2.1.Sample Collection CentersSubject categories of normal, disease control, oral premalignant, and oral cancer were included in the present study. The subjects for these categories were screened and selected from outpatient department services of Tata Memorial Center, Mumbai, and D. Y. Patil Dental College and Hospital, Navi Mumbai. The normal (healthy or control) subjects were selected from the patients’ relatives, friends, and staff members of these institutes. Required ethical clearance was obtained from the respective participating institutions before the start of the study. 2.2.Sample AccrualSubjects who were clinically normal (without any apparent current disease), with or without tobacco/alcohol habits were categorized under the Normal group. The disease control group was included as a nonoral cancer malignancy control. Glioma patients belonging to grades II to IV were included in this group. The oral premalignant category comprised subjects with clinically evident mucosal changes, either homogenous or heterogeneous leukoplakia patch, tobacco pouch keratotic lesion or palpable oral submucous fibrosis (OSMF). The oral cancer category consisted of subjects with primary histopathologically confirmed oral cancer at subsites buccal mucosa or tongue. Patients with a clinical history of anticancer treatment, chemo or radiotherapy, second malignancy, and recurrence, were excluded from the present study. Both oral cancers and oral premalignant subjects were found to have long-term tobacco abuse history. After preliminary screening, serum samples were collected from 328 subjects during 2010 to 2014. Some 126 subjects satisfied the criterion for normal, 120 for oral cancer, 47 for oral premalignant, and 35 for disease control. Written informed consent and demographic information was collected from each subject before sample collection. 2.3.Sample CollectionAfter overnight fasting, 5 ml blood samples were collected by venipuncture in vacuette tubes (Improve vacutainer, Guangzhou Improve Medical Instruments Co. Ltd., China) with clot activator to obtain serum. The tubes were kept standing for 2 h to allow clot formation, and centrifuged at 3000 rpm for 10 min. The supernatant was separated, aliquoted, snap frozen in liquid nitrogen, and finally stored at until Raman analysis. 2.4.Raman SpectroscopyAfter passive thawing on ice, a volume of sample was placed on calcium fluoride () window and spectra were acquired using a fiber-optic Raman microprobe. Details of the instrument have been described previously.26 Briefly, the system consists of a laser (785 nm, Process Instruments) as an excitation source and HE 785 spectrograph (Horiba-Jobin-Yvon, France) coupled with a charge coupled device (CCD) (Synapse, Horiba-Jobin-Yvon) as dispersion and detection elements, respectively. Optical filtering of unwanted noise, including Rayleigh signals, is accomplished through the superhead. The Raman microprobe was assembled by coupling a microscopic objective (Nikon, Japan) to the superhead. Spectral acquisition details were as follows: ; laser power: 30 mW; integration time: 15 s; and average: 4. On an average, seven spectra were recorded from each sample. Mean spectra were calculated by averaging all spectra of a sample: a patient-wise approach was employed for data analysis. 2.5.Spectral Preprocessing and Data AnalysisSpectra were corrected for CCD response with a National Institute of Science and Technology certified Standard Reference Material 2241 followed by the subtraction of background signals from optical elements and substrate. To remove interference of the slow moving background, first derivatives of spectra (Savitzky-Golay method and window size 3) were computed.27,28 Spectra were interpolated in the 700 to region, vector-normalized, and used as input for multivariate analysis. Multivariate tool principal component linear discriminant analysis (PC-LDA) followed by leave-one-out cross-validation (LOOCV) was used for data analysis. Average spectra were also computed for spectral comparisons across the groups using the background-corrected spectra prior to derivatization. These spectra were baseline corrected by fitting a fifth-order polynomial function, smoothed (Savitzky-Golay, 3), vector-normalized, and used for spectral comparisons. 3.Results and DiscussionCurrently practiced modalities for screening of oral cancers include visual inspection, followed by biopsy and histopathology of suspicious lesions. Serum Raman spectroscopy-based screening may serve as a useful adjunct to existing approaches. In the present study, first the feasibility to identify premalignant conditions and specific cancer detection was investigated and differences between oral cancer and normal conditions were evaluated using a large sample size. Finally, screening-related applications of serum RS were verified using two specialized classification systems. Based on previous studies, PC-LDA using the patient-wise approach in the fingerprint region was employed for data analysis. 3.1.Spectral AnalysisMean spectra were computed by averaging background-subtracted spectra prior to derivatization for each class, by averaging -axis variations keeping the axis constant for each class, and baseline corrected by fitting a fifth-order polynomial function. The smoothed (Savitzky-Golay method, 3), normalized average spectra for all groups are shown in Figs. 1(a)–1(d). Major spectral features were observed at 830 and 850 (Tyr doublet), 1007 (Phe), 1085 to 1100 (DNA backbone), 1162 and 1530 (-carotene), 1267 (amide III), 1318 and 1342 (DNA bases), 1451 ( bending), 1556 and 1622 (Trp), and 1656 (amide I). Tentative assignments have been made as per the available literature.29,30 Thus, spectra are characterized by the presence of contributions mainly from amino acids, beta carotene, DNA, and proteins. Intensity-related variations in amino acids, amide III, and DNA peaks were observed across the different groups. Fig. 1Average spectra for spectral comparisons: (a) normal, (b) disease control, (c) premalignant, and (d) oral cancer. 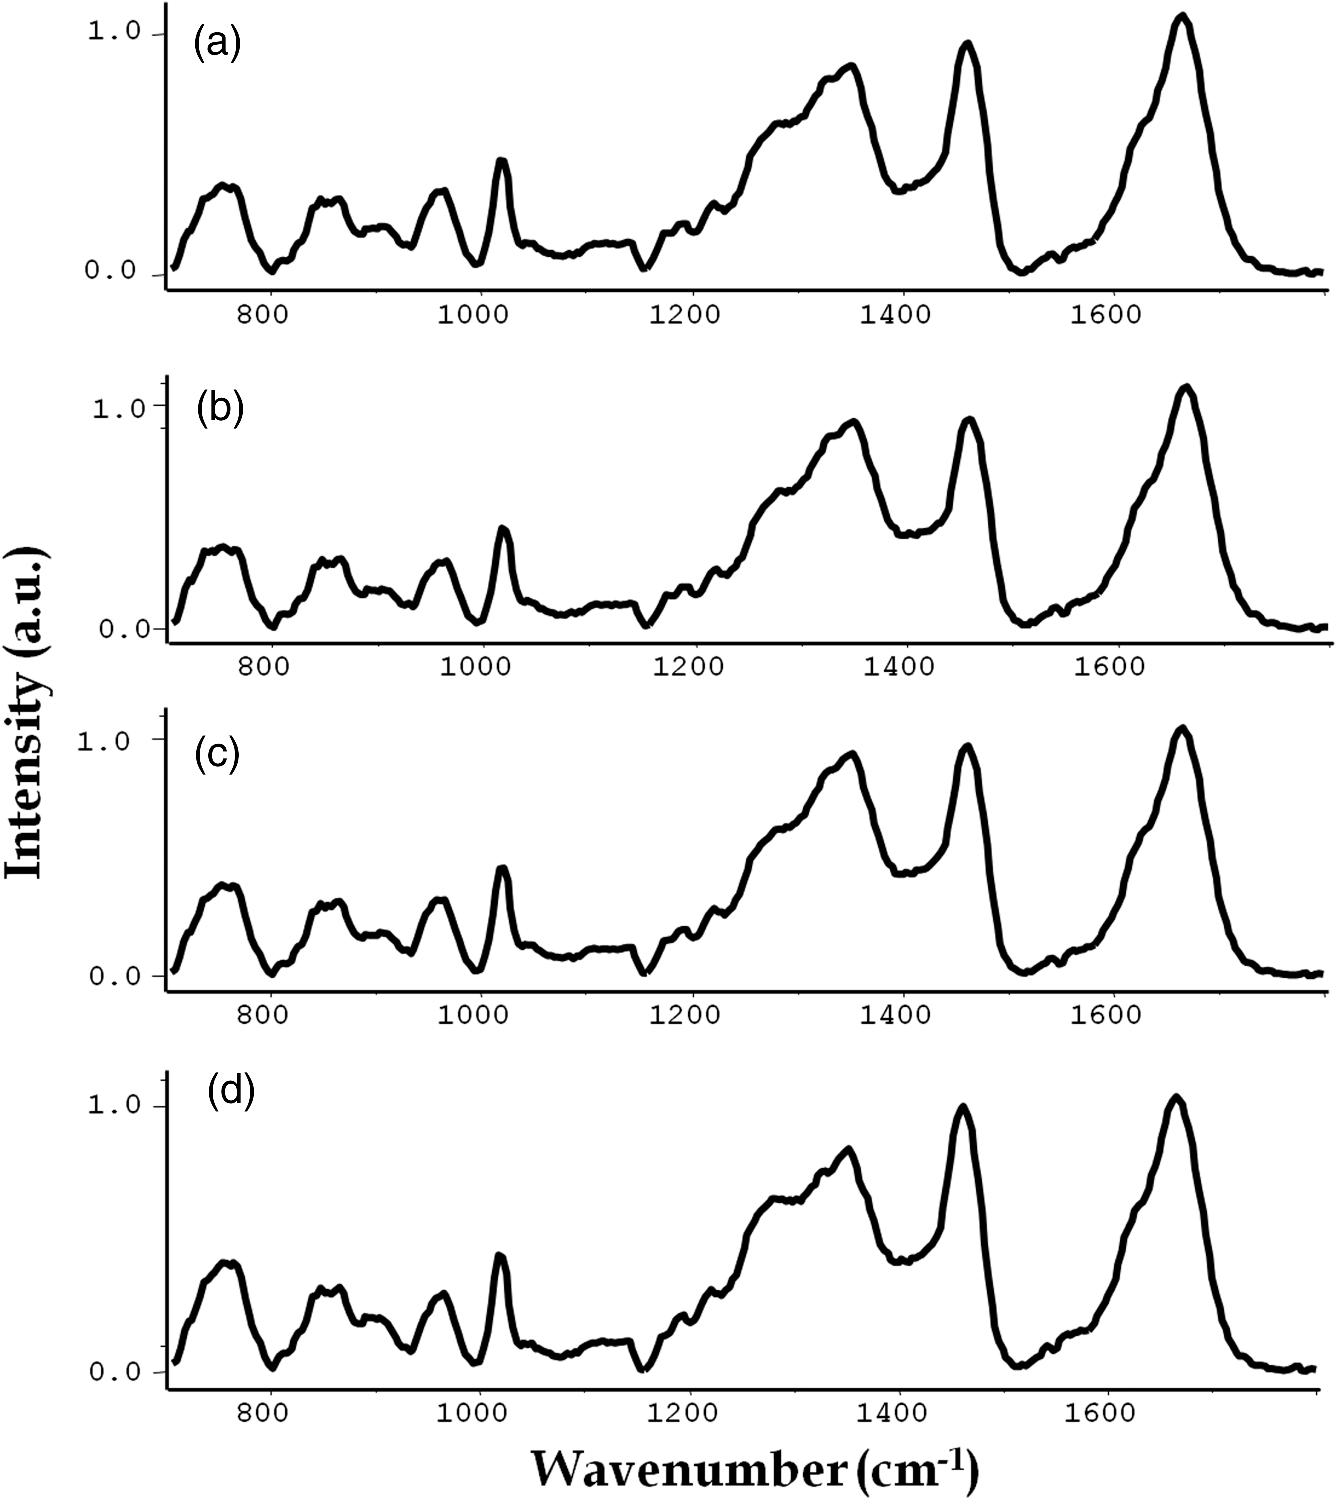 Oral cancer spectra showed higher Tyr, Trp (doublet at 830 and 850, 1552), amide III (1270), and deformation (1450) but slightly lower amide I (1660) and sharper DNA bases (1342). Most of these spectral variations corroborate our previous findings.23,24 With respect to the normal group, premalignant spectra showed higher Phe (1008), lower amide III (1270), higher DNA bases (1320, 1342), higher deformation (1450), and slightly lower amide I (1660). The disease control spectrum showed higher Phe (1008), amide III (1270), DNA bases features (1320, 1342), lower deformation (1450), and higher amide I (1660 ). It has been reported that the appearance of premalignant changes in the oral cavity is associated with an increase in serum concentrations of enzyme lactate dehydrogenase, -microglobulin, changes in lipid profile; serum glyco-conjugates, like sialic acid; lipid-bound sialic acid; serum antioxidants, like vitamin A, E, -carotene; and trace elements, like iron, zinc, copper.31–33 In the case of gliomas, changes in proteomic profiles; serum gangliosides; trace elements, like copper, zinc, lead, manganese, cobalt; and increase in YKL-40 levels have been linked with its development.34–37 3.2.Multivariate AnalysisThe feasibility of classifying normal, premalignant, oral cancer, and disease control (nonoral cancer) groups using binary classification systems was first explored. PC-LDA was employed to build the standard models followed by cross-validation using LOOCV. In the subsequent step, the potential of serum RS in screening-related applications was investigated using two models: a single all-encompassing four-model and a normal versus abnormal coupled with type of abnormality deduction model. 3.2.1.Exploring classification between normal and oral premalignant groupsPC-LDA for normal versus premalignant subjects was carried out using five factors ( classification efficiency) as shown in Fig. 2(a). The scatter plot indicates slightly overlapping clusters for normal and premalignant groups [Fig. 2(b)]. A lower efficiency for identifying normal () and premalignant conditions () was observed (Table 1). This indicates a similarity in the normal and premalignant serum samples, in light of the lack of appreciable cancer-related changes. Fig. 2Principal component linear discriminant analysis (PC-LDA) for normal and premalignant subjects: (a) scree plot and (b) scatter plot. 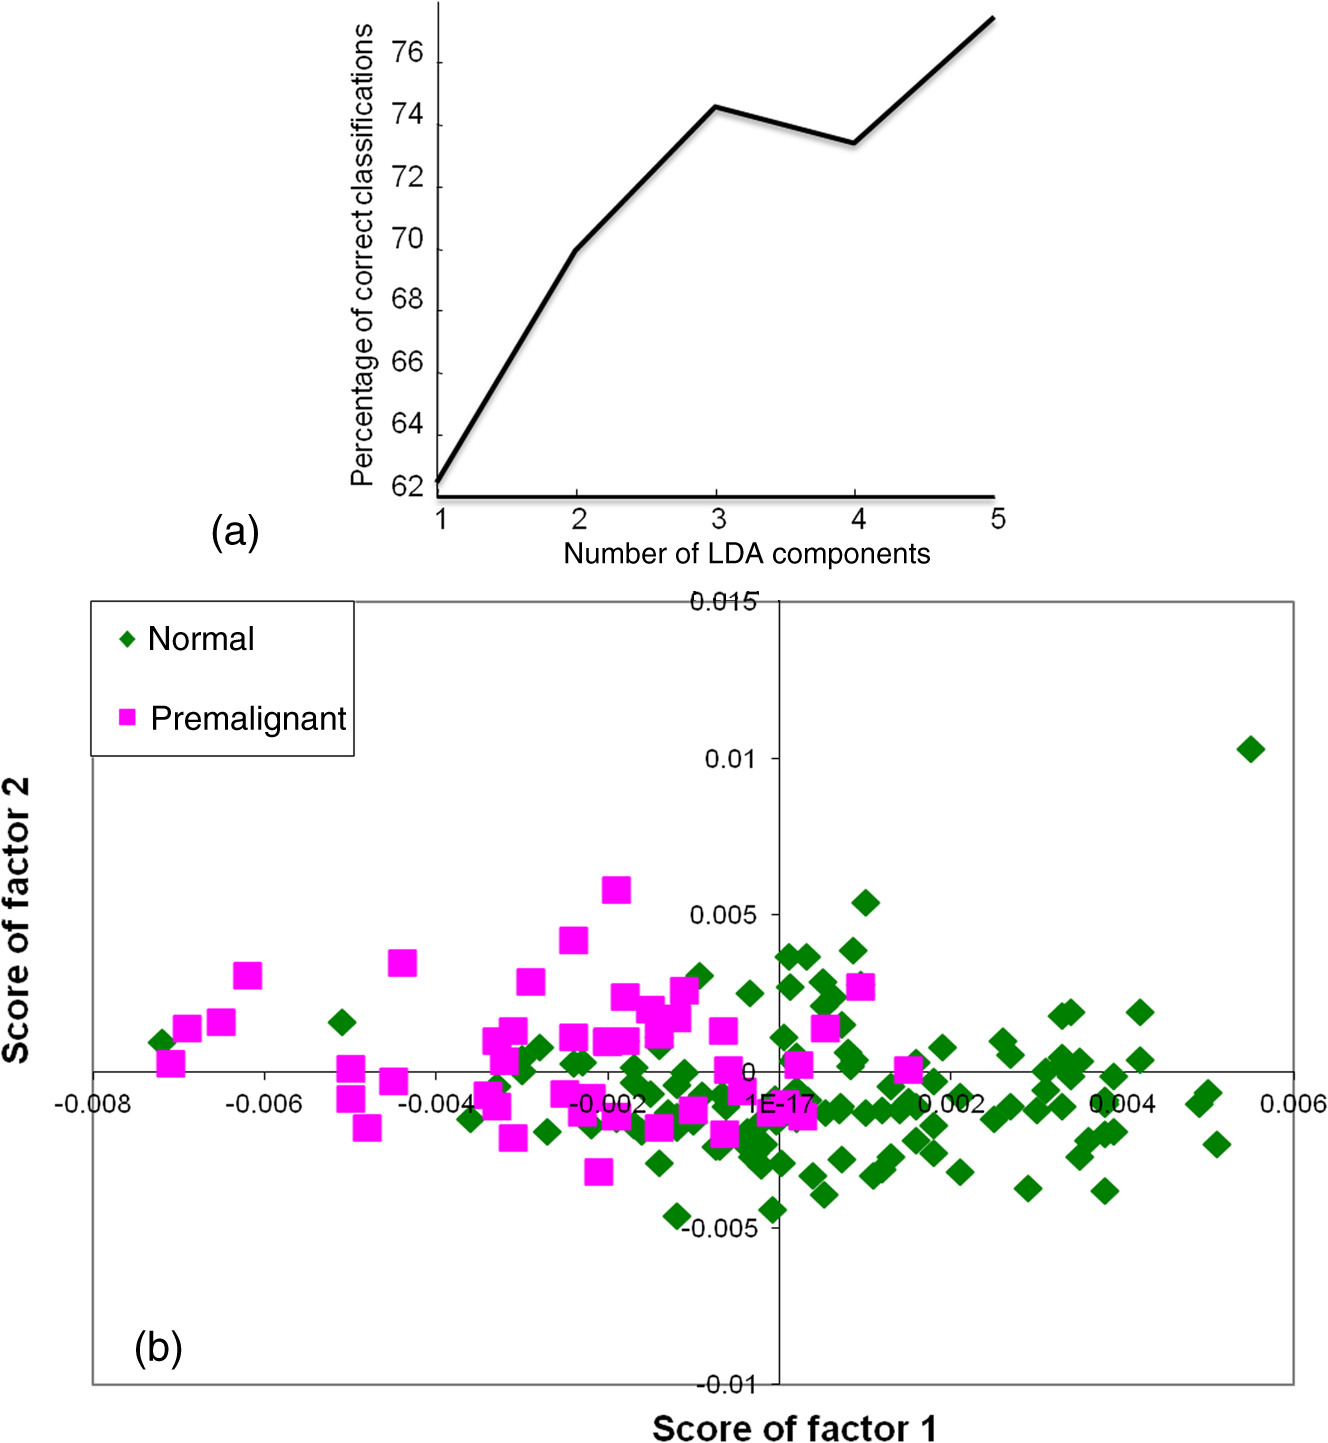 Table 1Principal component linear discriminant analysis (PC-LDA) for classification between normal and premalignant serum samples [leave-one-out cross-validation (LOOCV) confusion matrix results for the analysis].
3.2.2.Exploring classification between normal and disease control groupsPC-LDA for normal versus disease control was carried out using five factors [Fig. 3(a)]. The PC-LDA scatter plot shown in Fig. 3(b) indicates two almost distinct clusters for normal and glioma. The LOOCV confusion matrix in Table 2 indicates overall classification efficiency for identifying both disease and normal samples. Thus, healthy and disease samples can be identified with high sensitivity and specificity. Table 2PC-LDA for classification between normal and disease control serum samples (LOOCV confusion matrix results for the analysis).
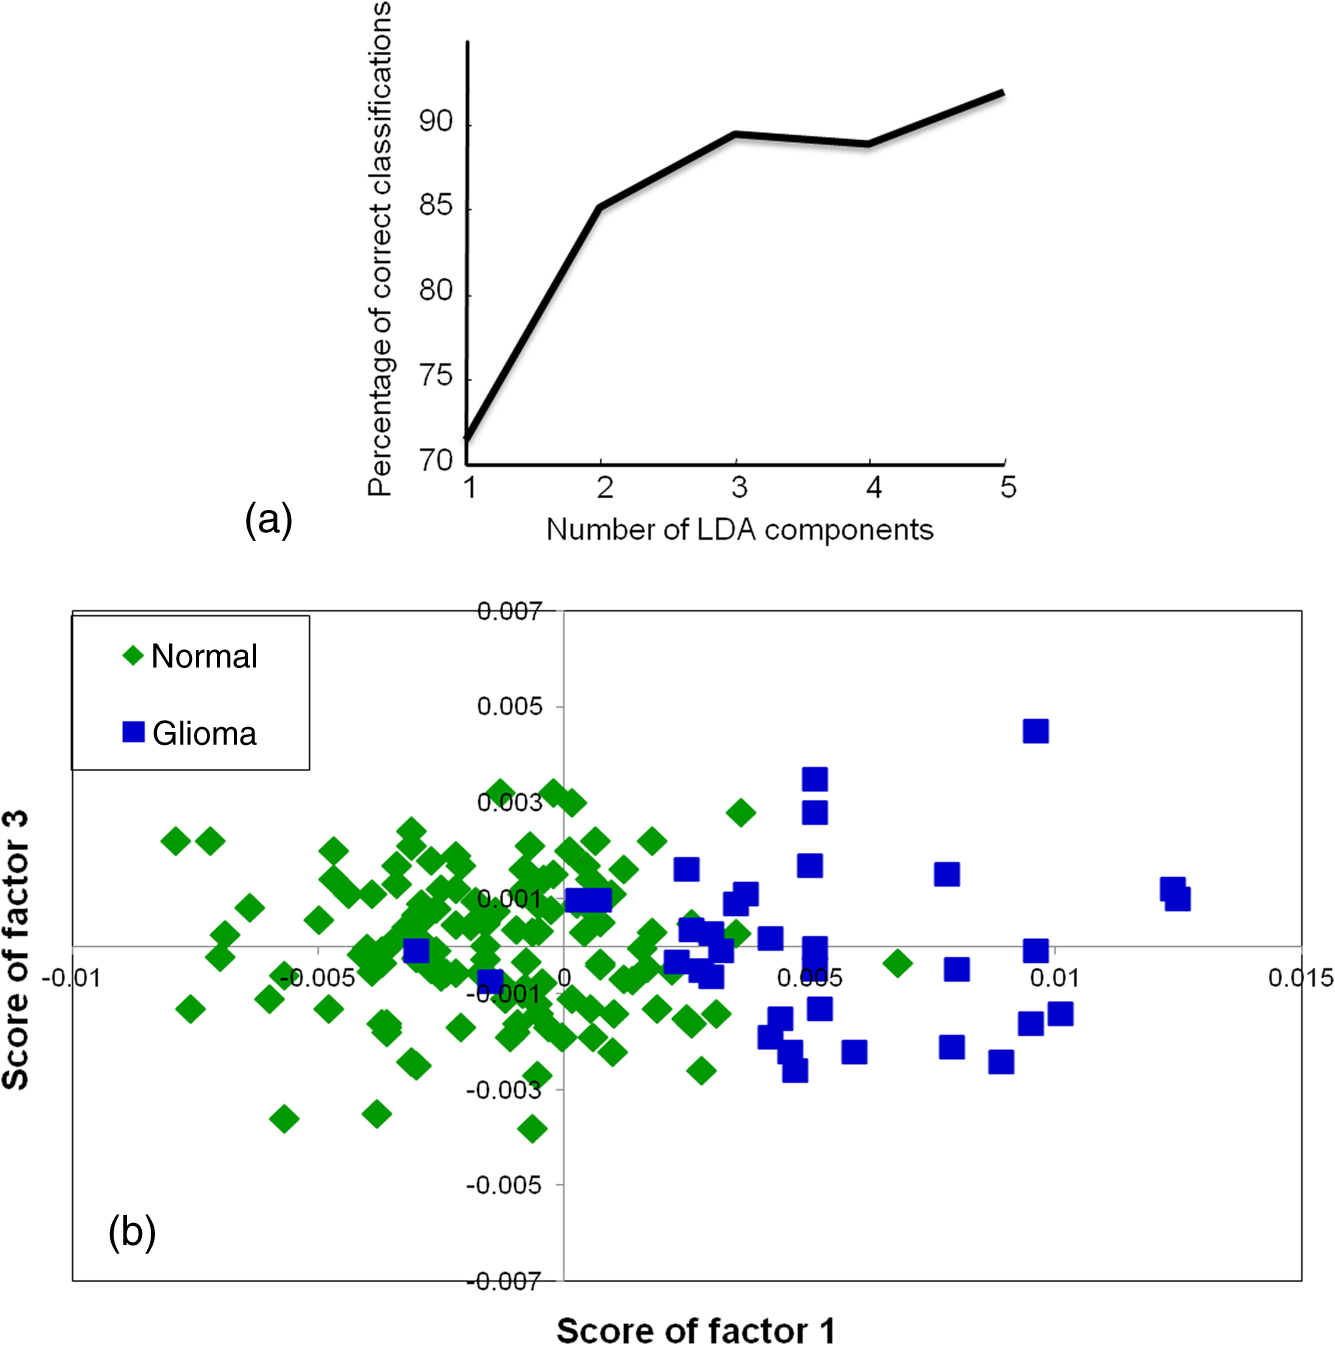
3.2.3.Exploring classification between normal and oral cancer groupsPC-LDA of normal versus oral cancer was carried out using six factors [Fig. 4(a)]. The scatter plot shown in Fig. 4(b) demonstrates two distinct clusters each for normal and oral cancer. Table 3(a) indicates an LOOCV efficiency of 90% to identify normal and 84% for detection of cancer samples. To substantiate these findings, a standard model of normal versus oral cancer was built using samples. The remaining 126 samples of normal and oral cancer were used as the independent test dataset on this model. The LOOCV confusion matrix for the standard model and the test predictions are shown in Tables 3(b) and 3(c), respectively. In the standard model, normal and cancer could be identified with 88 and 83% efficiency, respectively. As shown in Table 3(c), normal samples (86%) and cancer samples (87%) were predicted correctly. Thus, test predictions indicate that normal and oral cancer samples can be identified with high sensitivity and specificity. Table 3PC-LDA for classification between normal and oral cancer serum samples.
3.2.4.Exploring cancer-specific diagnosis for oral cancersOur previous studies have shown successful classification between normal and oral cancer samples. To determine if RS can differentiate between two different types of cancers, a nonoral cancer group, i.e., glioma, was incorporated in this study. Additionally, specific diagnosis of cancers is important during cancer screening. Thus, the feasibility of differentiating these two different types of cancers was also explored in this study. Oral cancers included in this study are oral squamous cell carcinomas, while gliomas are brain cancers that originate in the glial cells. Different serum biochemistry changes are reported in these cancers, as previously mentioned in the spectral analysis sections. The PC-LDA of oral cancer versus disease control (glioma) samples was first carried out using 10 factors to explore cancer-specific differences in serum [Fig. 5(a)]. The scatter plot shown in Fig. 5(b) shows two distinct clusters for oral cancer and glioma. The LOOCV table [Table 4(a)] demonstrates correct predictions of glioma samples and oral cancer samples. Thus, these cancers were discriminated with efficiency. The distinction between normal and cancer, and simultaneous detection of type of cancer (oral cancer or glioma), was also evaluated using a three-model system. PC-LDA was carried out using 10 factors accounting for efficiency [Fig. 6(a)]. The PC-LDA scatter plot shows three almost distinct clusters corresponding to normal, oral cancer, and disease control [Fig. 6(b)]. The LOOCV confusion matrix shown in Table 4(b) demonstrates the feasibility of identifying normal samples with efficiency. Glioma and oral cancer could be identified with 77 and 75% efficiency, respectively. These results indicate that different cancers have different Raman spectroscopic signatures and may be identified distinctly based on serum spectral characteristics. Table 4PC-LDA for exploring cancer-specific detection for oral cancers (LOOCV confusion matrix results for the analysis).
3.2.5.Exploring serum Raman spectroscopy in screening applicationsTwo classification models were employed to evaluate the potential of serum RS in oral cancer screening: first, a four-group model, and second, a normal versus abnormal model followed by determining the type of abnormality. Exploring classification among normal, disease control, oral premalignant, and cancer sera using a four-model systemIn the first screening model, a four-group model approach was used to explore classification among normal, disease control, premalignant, and oral cancer. This is the ideal model for screening applications, as all possible groups constitute this model. Thus, a single-step analysis will be required to ascertain the identity of the sample during screening. PC-LDA was carried out using seven factors, which accounted for correct classifications. The scree plot and PC-LDA scatter plot are shown in Fig. 7. As shown in Table 5, several misclassifications among normal, disease, and premalignant groups were observed. About 15 and 25% normal misclassified with disease and premalignant, respectively, while only 10% misclassified with the cancer group. More number of normal misclassifications observed with premalignant group could be due to less severe biochemical changes as compared to cancer groups. In case of cancer, 15% were misclassified with normal, 10% with disease, and 8% with premalignant groups. Thus, overall, a specificity of and sensitivity of was observed for normal versus oral cancer classification. Premalignant and disease controls could also be identified with 71 and 66% efficiency. Table 5Standard model for screening applications I—single four-group model for classification among normal, disease control, premalignant, and oral cancer (LOOCV confusion matrix results for the analysis).
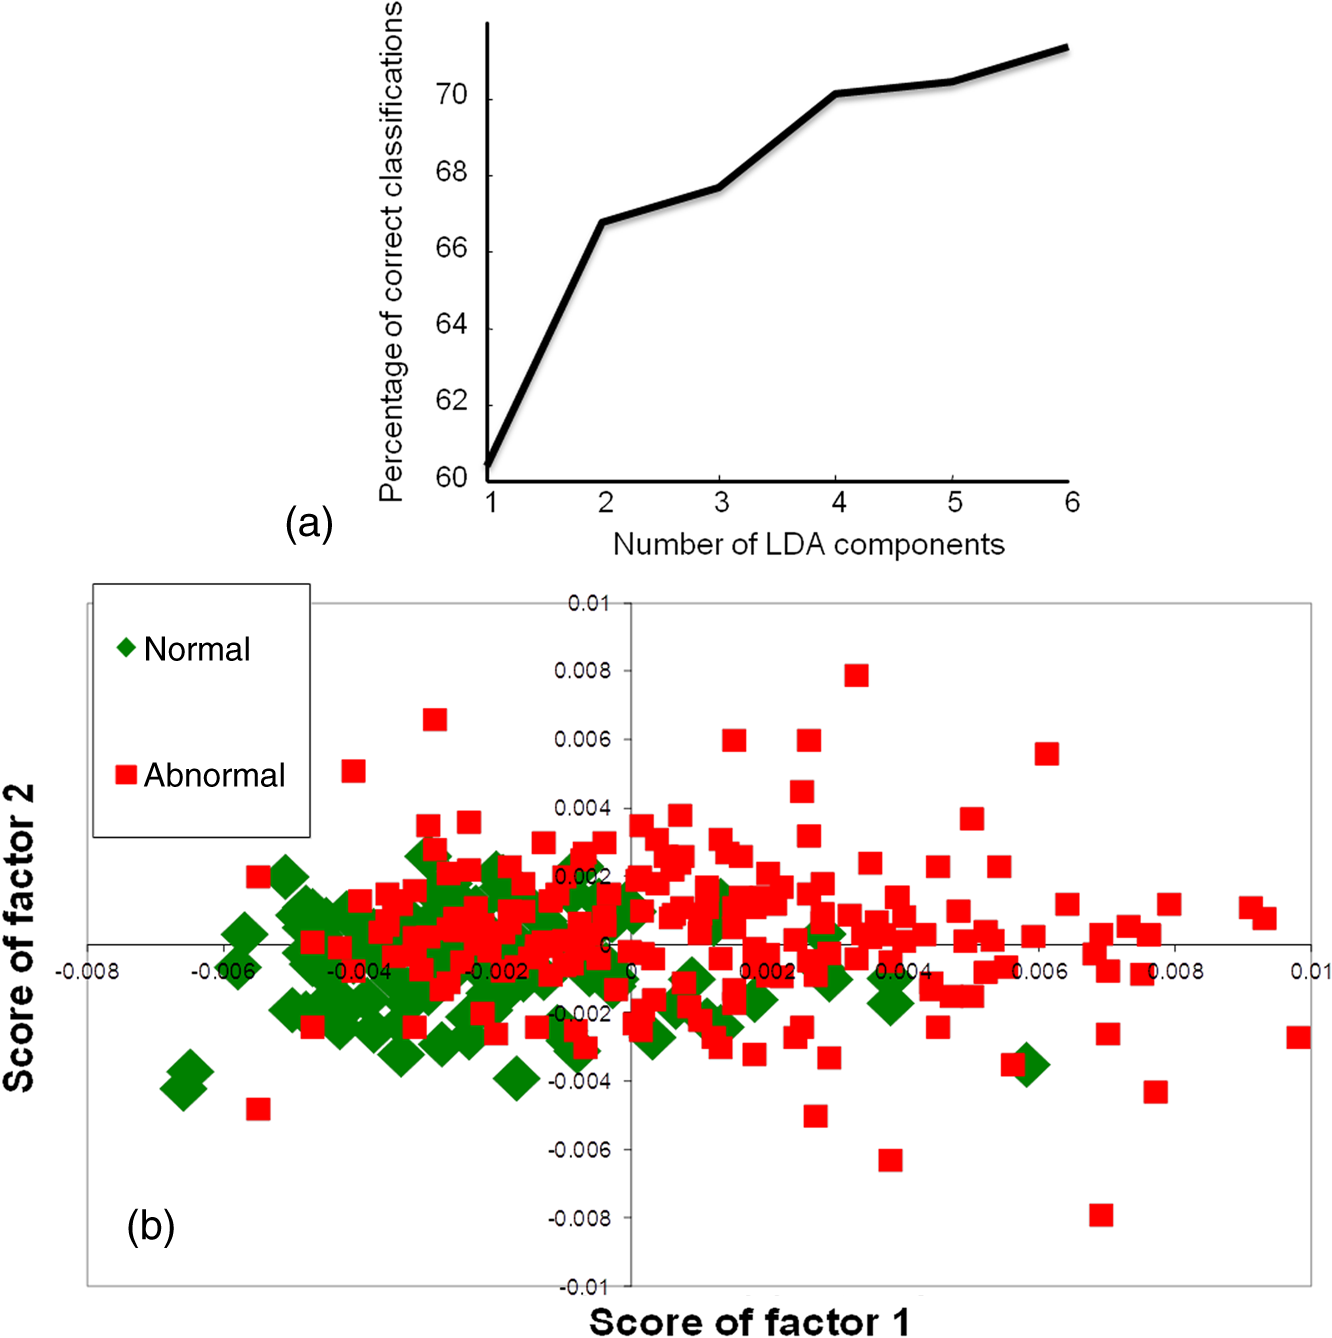
Exploring classification between normal and abnormalIn the second classification model, the feasibility to identify a healthy/normal serum sample against all other pathological/abnormal conditions was explored. Thus, in this first step, classification between the normal group and a combined abnormal group (disease + premalignant + oral cancer) was explored. In this classification system, if a sample would be classified as abnormal, the second step would be carried out to identify the type of abnormality: disease, premalignant, or malignant. This could be an ideal approach for screening-related applications where healthy samples are excluded and abnormal samples are subjected to further round of confirmatory analyses. The first normal versus abnormal PC-LDA classification was carried out using six factors accounting for 71% classification efficiency [Fig. 8(a)]. The scatter plot shown in Fig. 8(b) indicates two almost distinct clusters corresponding to normal and abnormal. As shown in Table 6(a), normal could be identified with efficiency, while abnormal or pathological could be identified with 64% efficiency. Thus, the sensitivity and specificity for this approach was found to be and , respectively. The feasibility to differentiate the different abnormal conditions was explored in the next step. PC-LDA was carried out using seven factors accounting for efficiency [Fig. 9(a)]. The scatter plot shown in Fig. 9(b) indicates two overlapping clusters for disease control and premalignant while a slightly distinct cluster for oral cancer. In total, disease subjects could be correctly classified, while premalignant and cancers were correctly classified [Table 6(b)]. The sensitivity to detect each abnormal condition was 74, 79, and 75% for disease, premalignant, and cancer, respectively. Most disease misclassifications were observed with premalignant samples and vice versa. Few premalignant () and malignant () misclassifications were observed between these two classes. The two premalignant subjects classified as malignant may be indicative of imminent malignant transformation, though no follow-up of these subjects was conducted in the present study. The lower rates of identifying premalignant as cancer could be attributed to the fact that only leukoplakia and 5 to 10% OSMF transform into malignancy.6,38 During screening applications, such samples can nevertheless be termed as suspicious and followed up for malignancy after primary screening. Overall, in this analysis, disease could be identified with 74%, premalignant with 77%, and oral cancer with efficiency. But the identification of abnormal condition against normal in the first step had a lower sensitivity rate of and higher specificity rate of 80%. For an ideal cancer screening test, higher sensitivity is desirable to eliminate the possibility of losing any malignant cases to false negative diagnosis. Although the lower specificity rates may also be a concern, the samples falsely classified as positives will only be treated as suspicious, and all these suspiciously abnormal samples will be deemed as cancer only after several rounds of confirmatory tests. Table 6Standard model for screening applications II—normal versus abnormal followed by determination of type of abnormality (LOOCV confusion matrix results for the analysis).
4.ConclusionsScreening of cancers using a peripheral blood sample may be a practical and feasible approach. This approach is associated with multiple advantages like accessibility, low invasive procedure, low cost, and multiple sampling.39 Moreover, samples can be transported from primary screening centers to a centralized facility for analysis. Recent studies have shown the utility of blood sample-based liquid biopsy in cancer diagnosis and monitoring treatment response by detecting DNA fragments, or by detecting blood telomere length for predicting the onset of cancer.40,41 In cancers where definite biomarkers are not available, the global biochemical changes can be identified by spectroscopic techniques like nuclear magnetic resonance (NMR), IR, fluorescence, and RS. A more recent study has shown to predict breast cancer five years before its occurrence with 80% sensitivity, using metabolic changes in serum by NMR spectroscopy.16 Serum RS had previously shown potential in detecting several diseases, cancers, monitoring treatment response, and predicting recurrence.25 In the present study, the efficacy of serum RS in detecting premalignant conditions, specific detection of oral cancers, and utility in oral cancer screening were evaluated. While the premalignant samples could be identified with efficiency, normal and disease controls could be identified with a higher efficiency of . The analysis on a large sample size and independent test data evaluation confirms the discrimination between normal and oral cancer groups with an average efficiency of . Screening applications were further explored by using two classification models. While the first four-group model yielded reasonable efficiency of classification, the normal versus abnormal model yielded sensitivity of 64% and specificity of . Although the sensitivity and specificity rates are not very high, they are quite comparable to established screening techniques like FOBT, Pap smear, and mammography.42–44 In spite of medium sensitivity (67.8%) and specificity (75%) and other limitations, mammography remains the most preferred approach for breast cancer screening. Even using Pap smears, where the sensitivity of a single Pap smear is reported to be between 60 and 80%, screening has reduced the incidence and mortality of invasive cervical cancers by .45 As the current screening approaches (visual inspection followed by biopsy and histopathology) are useful mainly for high-risk populations,8 oral cancer screening using serum RS may serve as useful adjuncts and help in improving low disease-free survival rates associated with oral cancers. Other approaches like Raman mapping and sample concentration methods like drop coating deposition Raman may improve the overall sensitivity rates of serum RS-based screening. Before envisaging clinical applications, a more rigorous validation using various population cohorts, several disease controls, and more premalignant cases are warranted. AcknowledgmentsThe Raman spectrometer employed in the study was procured from DBT project BT/PRI11282/MED/32/83/2008, titled “Development of in vivo laser Raman spectroscopy methods for diagnosis of oral precancerous and cancerous conditions,” Department of Biotechnology, Government of India. The authors would like to acknowledge technicians and nurses of Tata Memorial Center for help in blood collection. ReferencesB. Levin et al.,
“Screening and surveillance for the early detection of colorectal cancer and adenomatous polyps, 2008: a joint guideline from the American Cancer Society, the US Multi‐Society Task Force on Colorectal Cancer, and the American College of Radiology,”
CA Cancer J. Clin., 58
(3), 130
–160
(2008). http://dx.doi.org/10.3322/CA.2007.0018 CAMCAM 0007-9235 Google Scholar
D. Saslow et al.,
“American Cancer Society guidelines for breast screening with MRI as an adjunct to mammography,”
CA Cancer J. Clin., 57
(2), 75
–89
(2007). http://dx.doi.org/10.3322/canjclin.57.2.75 Google Scholar
D. Saslow, D. Solomon and H. Lawson,
“Screening guidelines for the prevention and early detection of cervical cancer,”
CA Cancer J. Clin., 62
(3), 147
–172
(2012). http://dx.doi.org/10.3322/caac.21139 CAMCAM 0007-9235 Google Scholar
K. R. Coelho,
“Challenges of the oral cancer burden in India,”
J. Cancer Epidemiol., 2012 701932
(2012). http://dx.doi.org/10.1155/2012/701932 Google Scholar
S. Khandekar, P. Bagdey and R. Tiwari,
“Oral cancer and some epidemiological factors: a hospital based study,”
Ind. J. Commun. Med., 31
(3), 157
–159
(2006). Google Scholar
S. S. Napier and P. M. Speight,
“Natural history of potentially malignant oral lesions and conditions: an overview of the literature,”
J. Oral Pathol. Med., 37
(1), 1
–10
(2008). http://dx.doi.org/10.1111/j.1600-0714.2007.00579.x Google Scholar
I. van der Waal,
“Potentially malignant disorders of the oral and oropharyngeal mucosa; present concepts of management,”
Oral Oncol., 46
(6), 423
–425
(2010). http://dx.doi.org/10.1016/j.oraloncology.2010.02.016 EJCCER 1368-8375 Google Scholar
R. Sankaranarayanan et al.,
“Effect of screening on oral cancer mortality in Kerala, India: a cluster-randomised controlled trial,”
Lancet, 365
(9475), 1927
–1933
(2005). http://dx.doi.org/10.1016/S0140-6736(05)66658-5 LANCAO 0140-6736 Google Scholar
D. V. Messadi,
“Diagnostic aids for detection of oral precancerous conditions,”
Int. J. Oral Sci., 5
(2), 59
–65
(2013). http://dx.doi.org/10.1038/ijos.2013.24 Google Scholar
C. V. Raman and K. S. Krishnan,
“A new type of secondary radiation,”
Nature, 121
(3048), 501
–502
(1928). http://dx.doi.org/10.1038/121501c0 Google Scholar
S. P. Singh et al.,
“In vivo Raman spectroscopic identification of premalignant lesions in oral buccal mucosa,”
J. Biomed. Opt., 17
(10), 105002
(2012). http://dx.doi.org/10.1117/1.JBO.17.10.105002 Google Scholar
S. Singh et al.,
“In vivo Raman spectroscopy of oral buccal mucosa: a study on malignancy associated changes (MAC)/cancer field effects (CFE),”
Analyst, 138
(14), 4175
–4182
(2013). http://dx.doi.org/10.1039/c3an36761d ANLYAG 0365-4885 Google Scholar
U. Menon et al.,
“Sensitivity and specificity of multimodal and ultrasound screening for ovarian cancer, and stage distribution of detected cancers: results of the prevalence screen of the UK Collaborative Trial of Ovarian Cancer Screening (UKCTOCS),”
Lancet Oncol., 10
(4), 327
–340
(2009). http://dx.doi.org/10.1016/S1470-2045(09)70026-9 Google Scholar
B. Daniele et al.,
“-fetoprotein and ultrasonography screening for hepatocellular carcinoma,”
Gastroenterology, 127
(5), S108
–S112
(2004). http://dx.doi.org/10.1053/j.gastro.2004.09.023 GASTAB 0016-5085 Google Scholar
R. Harris and K. N. Lohr,
“Screening for prostate cancer: an update of the evidence for the US Preventive Services Task Force,”
Ann. Intern. Med., 137
(11), 917
–929
(2002). http://dx.doi.org/10.7326/0003-4819-137-11-200212030-00014 Google Scholar
R. Bro et al.,
“Forecasting individual breast cancer risk using plasma metabolomics and biocontours,”
Metabolomics, 11
(5), 1
–5
(2015). http://dx.doi.org/10.1007/s11306-015-0793-8 Google Scholar
J. Pichardo-Molina et al.,
“Raman spectroscopy and multivariate analysis of serum samples from breast cancer patients,”
Lasers Med. Sci., 22
(4), 229
–236
(2007). http://dx.doi.org/10.1007/s10103-006-0432-8 Google Scholar
D. Lin et al.,
“Colorectal cancer detection by gold nanoparticle based surface-enhanced Raman spectroscopy of blood serum and statistical analysis,”
Opt. Express, 19
(14), 13565
–13577
(2011). http://dx.doi.org/10.1364/OE.19.013565 Google Scholar
S. Feng et al.,
“Nasopharyngeal cancer detection based on blood plasma surface-enhanced Raman spectroscopy and multivariate analysis,”
Biosensors Bioelectron., 25
(11), 2414
–2419
(2010). http://dx.doi.org/10.1016/j.bios.2010.03.033 Google Scholar
J. L. González-Solís et al.,
“Cervical cancer detection based on serum sample Raman spectroscopy,”
Lasers Med. Sci., 29
(3), 979
–985
(2014). http://dx.doi.org/10.1007/s10103-013-1447-6 Google Scholar
G. L. Owens et al.,
“Vibrational biospectroscopy coupled with multivariate analysis extracts potentially diagnostic features in blood plasma/serum of ovarian cancer patients,”
J. Biophotonics, 7
(3–4), 200
–209
(2014). http://dx.doi.org/10.1002/jbio.201300157 Google Scholar
G. Wang et al.,
“Detection of the potential pancreatic cancer marker MUC4 in serum using surface-enhanced Raman scattering,”
Anal. Chem., 83
(7), 2554
–2561
(2011). http://dx.doi.org/10.1021/ac102829b Google Scholar
A. Sahu et al.,
“Raman spectroscopy of serum: an exploratory study for detection of oral cancers,”
Analyst, 138
(14), 4161
–4174
(2013). http://dx.doi.org/10.1039/c3an00308f ANLYAG 0365-4885 Google Scholar
A. Sahu et al.,
“Raman spectroscopy of serum: a study on oral cancers,”
Biomed. Spectrosc. Imaging, 4
(2), 171
–187
(2015). http://dx.doi.org/10.3233/BSI-150107 Google Scholar
A. Sahu et al.,
“Recurrence prediction in oral cancers: a serum Raman spectroscopy study,”
Analyst, 140
(7), 2294
–2301
(2015). http://dx.doi.org/10.1039/C4AN01860E ANLYAG 0365-4885 Google Scholar
A. Sahu et al.,
“Serum based diagnosis of asthma using Raman spectroscopy: an early phase pilot study,”
PLOS One, 8
(11), e78921
(2013). http://dx.doi.org/10.1371/journal.pone.0078921 Google Scholar
S. Koljenović et al.,
“Discriminating vital tumor from necrotic tissue in human glioblastoma tissue samples by Raman spectroscopy,”
Lab. Invest., 82
(10), 1265
–1277
(2002). http://dx.doi.org/10.1097/01.LAB.0000032545.96931.B8 LABMDV Google Scholar
A. Nijssen et al.,
“Discriminating basal cell carcinoma from perilesional skin using high wave-number Raman spectroscopy,”
J. Biomed. Opt., 12
(3), 034004
(2007). http://dx.doi.org/10.1117/1.2750287 JBOPFO 1083-3668 Google Scholar
F. S. Parker, Applications of Infrared, Raman, and Resonance Raman Spectroscopy in Biochemistry, New York
(1983). Google Scholar
Z. Movasaghi, S. Rehman and I. U. Rehman,
“Raman spectroscopy of biological tissues,”
Appl. Spectrosc. Rev., 42
(5), 493
–541
(2007). http://dx.doi.org/10.1080/05704920701551530 Google Scholar
A. P. Singh et al.,
“Estimation of serum -microglobulin in potentially malignant disorders and squamous cell carcinoma of the oral cavity: a clinicopathological study,”
Dent. Res. J., 11
(1), 109
(2014). Google Scholar
V. Kamath, K. Satelur and Y. Komali,
“Biochemical markers in oral submucous fibrosis: a review and update,”
Dent. Res. J., 10
(5), 576
(2013). Google Scholar
T. Pereira, S. Shetty and S. Pereira,
“Estimation of serum lactate dehydrogenase level in patients with oral premalignant lesions/conditions and oral squamous cell carcinoma: a clinicopathological study,”
J. Cancer Res. Ther., 11
(1), 78
(2015). http://dx.doi.org/10.4103/0973-1482.150352 Google Scholar
F. M. Iwamoto et al.,
“Serum YKL-40 is a marker of prognosis and disease status in high-grade gliomas,”
Neuro Oncol., 13
(11), 1244
–1251
(2011). http://dx.doi.org/10.1093/neuonc/nor117 Google Scholar
B. Radić, Ž. Vukelić and S. Kalanj Bognar,
“Serum gangliosides in patients with brain tumors,”
Coll. Antropol., 32
(1), 171
–175
(2008). Google Scholar
M. Arslan et al.,
“Trace elements, heavy metals and other biochemical parameters in malignant glioma patients,”
Asian Pac. J. Cancer Prev., 12
(2), 447
–451
(2011). APJIEA 0125-877X Google Scholar
I. D. Popescu et al.,
“Potential serum biomarkers for glioblastoma diagnostic assessed by proteomic approaches,”
Proteome Sci., 12
(1), 1
–14
(2014). http://dx.doi.org/10.1186/s12953-014-0047-0 Google Scholar
P.-S. Ho et al.,
“Malignant transformation of oral potentially malignant disorders in males: a retrospective cohort study,”
BMC Cancer, 9
(1), 260
(2009). http://dx.doi.org/10.1186/1471-2407-9-260 BCMACL 1471-2407 Google Scholar
D. M. Good et al.,
“Body fluid proteomics for biomarker discovery: lessons from the past hold the key to success in the future,”
J. Proteome Res., 6
(12), 4549
–4555
(2007). http://dx.doi.org/10.1021/pr070529w Google Scholar
M. Roschewski et al.,
“Circulating tumour DNA and CT monitoring in patients with untreated diffuse large B-cell lymphoma: a correlative biomarker study,”
Lancet Oncol., 16
(5), 541
–549
(2015). http://dx.doi.org/10.1016/S1470-2045(15)70106-3 Google Scholar
L. Hou et al.,
“Blood telomere length attrition and cancer development in the normative aging study cohort,”
EBioMedicine, 2
(6), 591
–596
(2015). http://dx.doi.org/10.1016/j.ebiom.2015.04.008 Google Scholar
Y. Niv and A. D. Sperber,
“Sensitivity, specificity, and predictive value of fecal occult blood testing (Hemoccult II) for colorectal neoplasia in symptomatic patients: a prospective study with total colonoscopy,”
Am. J. Gastroenterol., 90
(11), 1974
–1977
(1995). Google Scholar
K. Nanda et al.,
“Accuracy of the Papanicolaou test in screening for and follow-up of cervical cytologic abnormalities: a systematic review,”
Ann. Intern. Med., 132
(10), 810
–819
(2000). http://dx.doi.org/10.7326/0003-4819-132-10-200005160-00009 Google Scholar
R. Ferrini et al.,
“Screening mammography for breast cancer: American College of Preventive Medicine practice policy statement,”
Am. J. Prev. Med., 12
(5), 340
–341
(1996). Google Scholar
D. M. Eddy,
“Screening for cervical cancer,”
Ann. Intern. Med., 113
(3), 214
–226
(1990). http://dx.doi.org/10.7326/0003-4819-113-3-214 Google Scholar
|
||||||||||||||||||||||||||||||||||||||||||||||||||||||||||||||||||||||||||||||||||||||||||||||||||||||||||||||||||||||||||||||||||||||||||||||||||||||||||||||||||||||||||||||||||||||||||||||||