
|
|
1.IntroductionSpectral measurements and analyses, which could provide accurate quantifications of the microvascular and morphological properties of gastric mucosa, facilitate the diagnosis of gastric diseases. However, point spectroscopy does not account for the spatial heterogeneity of tissue, as it detects light from a single point, which makes it ineffective for mapping lesion areas. Hyperspectral imaging (HSI), on the other hand, can be used for spatial mapping of tissue morphology and physiology,1–7 and it accounts for the spatial heterogeneity of the tissue. This technique involves the acquisition and analysis of a series of reflected two-dimensional images sampled at different wavelengths.8–13 In the gastrointestinal field, most HSI studies have involved ex vivo biopsies, resected tumor tissues, or surface organs, such as the skin, tongue, or larynx. Clancy et al.13 developed a laparoscope HSI system based on a liquid-crystal tunable filter, Martin et al.11,12 designed an HSI system that employs fluorescence for larynx imaging, and Leitner et al.14 established an HSI laryngoscope system based on an acoustic-optical tunable filter, which can collect 51 images with a bandwidth of 5 nm in 1.25 s. Kiyotoki et al.15 proposed the use of an HSI camera in a diagnostic support system for resected gastric cancer tissues, and indicated that HSI could be employed to measure spectral reflectance in gastric tumors and could differentiate between tumorous and normal mucosa. However, the colors of the resected tissues differed from those observed in vivo, which suggests that the spectral properties of tissue may change after resection. In the present study, we developed an image enhancement method based on in vivo hyperspectral images for the examination of different types of gastric diseases. 2.Methods2.1.Equipment SetupFigure 1 shows a diagram of the flexible hyperspectral (HS) gastroscopy system, which can be used to obtain a series of reflected HS images in a noncontact manner in the 405 to 665 nm wavelength range. This system is a modified version of the commercialized endoscope AQ-100 donated by Shanghai Aohua Photoelectric Endoscope Co. Ltd. This system is described in detail in Ref. 16. Twenty-seven sequential narrowband bandpass interference filters are centered at wavelengths between 405 and 665 nm in 10 nm intervals with full widths at half maximum (FWHMs) of 10 nm and peak transmission (Shenyang HB Optical Technology Co., Ltd., China) and, together with two all-pass holes, are mounted in two motorized filter wheels positioned in the collimated light beam path. In the conventional white light illumination mode, red (R), green (G), and blue (B) color filters are switched and the all-pass holes in the HS wheels are in the illumination beam path. When the suspected disease area is targeted and the HSI mode is enabled, the 27 monochromatic spectral-channel light beams are produced sequentially in 4.2 s as the filter wheel rotates. An optical fiber bundle directs the beams to the mucosa after the optical taper focuses the light onto the bundle. A combination of lenses is attached to the distal end of the bundle. This combination results in a 5.0-cm-diameter illumination spot at a working distance of 2.0 cm. A monochromatic charge-coupled device (CCD; ICX279AL, Sony) positioned at the distal end of the optical fiber bundle is used to spectrally resolve the reflected images from the mucosa. Analog signals read from the CCD are sequentially transformed into digital signals in the image processing unit. A cable connects the image processing unit to the medical monitor, which displays the reflected images of the mucosa. 2.2.Clinical Data AcquisitionAfter obtaining ethics approval from Zhongshan Hospital (Shanghai, China, Approval No. 2012-06(2)) and informed consent from the patients, we acquired HS images of different types of gastric mucosa in a clinical setting. In particular, HS images of gastric ulcers were investigated. 2.3.Data PreprocessingAfter acquiring sequential HS images containing different spectral information, we performed image preprocessing to reduce the imperfections that arose during imaging and to generate images suitable for analysis. Noise reduction, contrast enhancement, illumination normalization, reflex removal, and soft image registration for moving objects were performed.17–22 2.4.Band SelectionThe entropy of an image is defined as23,24 where is entropy, is the pixel variable of the image, and is the probability distribution function of . The joint entropy is defined as23,24 where indicates the joint entropy, and represent the pixel variables of two different spectral images, and is the joint probability distribution function of and . The joint entropy can also be represented asThen the dependence of information (DI) is defined as23,24 where is the DI index and andThe value of can be used to identify the relevant bands’ selection in HS image cubes by performing the following procedure:23
2.5.Image Enhancement and EvaluationAfter selecting the band subset in this study, the selected bands were assigned to be the new R, G, and B components for the enhanced image. After performing white balancing, the effects of this image enhancement method were investigated by comparing the new image with the conventional color image. 3.ResultsAfter developing the system, we obtained 29 in vivo HS image cubes for normal gastric mucosa tissues and different types of gastric disease tissues and objects from 12 volunteers in a clinic. Figure 2 shows example images from an HS image cube for a gastric ulcer. The spectral characteristics in the ulcer region are significantly different from those of the normal tissue and the erythematous mucosa around the disease area. Figure 3 presents the spectral curves from three typical regions in the image. As shown, the ulcer region has a reflectance higher than those of the erythematous and normal regions at all visible wavelengths. This increased reflectance is related to the fact that the ulcer region is whiter than its surroundings. Below 595 nm, the reflectance of the erythematous region is lower than that of the normal tissue regions, while above 595 nm, their reflectances are similar. Hence, the erythematous region appears redder than the normal region. We used this gastric ulcer HS image cube in the image enhancement case study. Fig. 2First image is conventional color image, while others are images from HS image cube for gastric ulcer, individually centered at 465, 515, 545, 575, 595, 615, and 665 nm.  Fig. 3Spectral curves from representative points in HS image cube. There are three typical regions: ulcer region (gastrohelcosis), erythematous region, and normal tissue region. 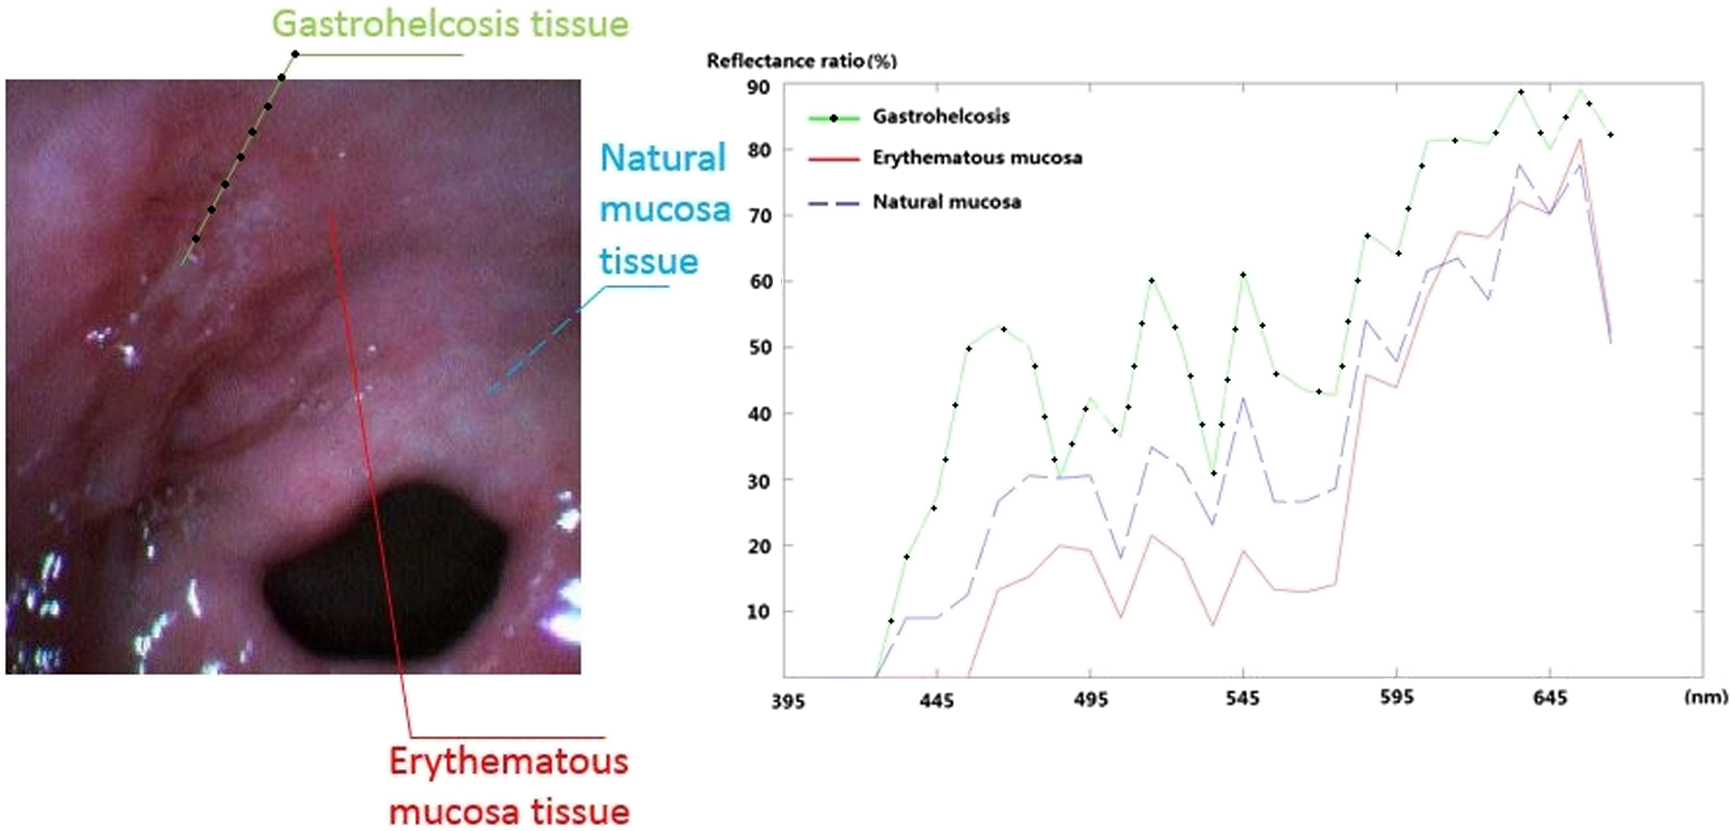 Table 1 presents the band selection results obtained using the DI algorithm, which shows that the first three selected bands are from the G, B, and R wavelength regions. These three bands were assigned to be the new R, G, and B components for the enhanced image. We also assigned the 465 nm band to be the B component for comparison. Table 1Band selection results obtained using DI algorithm on HS images of gastric ulcer.
Figure 4 shows the enhanced imaging results obtained using the new assignments. Figures 4(a) and 4(b) show that the ulcer region appears yellower in the enhanced image than in the conventional image, while the normal tissue regions appear whiter. The erythematous region located between the ulcer region and the normal region appears similar in the enhanced and conventional images. Thus, the enhanced image facilitates differentiation between the ulcer and erythematous regions from the normal tissue region. Fig. 4(a) Gastric ulcer region in conventional color imaging mode. (b) Enhanced image using HS images at 645, 545, and 495 nm as new R, G, and B components, respectively. (c) Enhanced image using HS images at 645, 545, and 465 nm as new R, G, and B components, respectively, (b) and (c) were obtained after white balance processing.  From Figs. 4(b) and 4(c), it is evident that the erythematous and normal regions have similar color tones, while the ulcer region exhibits a different color. This finding indicates that different band selections could produce different color tones and enhanced results. 4.DiscussionFor a gastroscopy system with CCDs operating at low speeds, the use of more than three bands would prevent real-time imaging. Hence, three bands should be employed to facilitate diagnosis, as the bands would be selected according to the specific disease and would have FWHMs narrower than those in conventional white light imaging and narrowband imaging. Despite the interesting results obtained in this study, this method should be employed clinically in the future to verify its effectiveness in actual application. Moreover, since many factors, such as the organ, location, disease stage, and environment, may cause the reflected spectral images to vary, we do not expect that these band selection results will be universally applicable. In this study, we simply proved that this image enhancement method based on in vivo HS images is useful and that it can improve the color tone contrast of images used for disease diagnosis. In the future, after analyzing a large number of cases involving in vivo HSI application and the bands selected for each disease and individual, we will be able to determine the optimal spectral band subsets that are effective for most patients with specific diseases. 5.ConclusionWe proposed and demonstrated an image-enhancement method based on band selection for in vivo HS gastroscopic imaging. A flexible gastroscopy system was modified with HS technology and was used to obtain in vivo HS images for different types of mucosal diseases and objects. A band selection algorithm based on DI was employed to analyze HS images of a gastric ulcer, and three bands (645, 545, and 495 nm) were identified from these images. After defining these selected bands as the new R, G, and B components to be used to obtain the enhanced image, it was found that this new method yielded color tone contrast higher than that of the corresponding conventional color image. Although further study is required, this method has great potential for application in clinics. AcknowledgmentsThe authors were grateful to engineers Mingda Chen and Zongxiao Sun from Peking University. ReferencesW. L. Wolfe, Introduction to Imaging Spectrometers, SPIE Press, Bellingham, Washington
(1997). Google Scholar
G. L. Lu and B. W. Fei,
“Medical hyperspectral imaging: a review,”
J. Biomed. Opt., 19
(1), 010901
(2014). http://dx.doi.org/10.1117/1.JBO.19.1.010901 Google Scholar
L. V. Wang, Photoacoustic Imaging and Spectroscopy, CRC Press, Boca Raton, Florida
(2009). Google Scholar
D. A. Boas, C. Pitris, and N. Ramanujam, Handbook of Biomedical Optics, CRC Press, Boca Raton, Florida
(2012). Google Scholar
V. V. Tuchin and V. Tuchin, Tissue Optics: Light Scattering Methods and Instruments for Medical Diagnosis, SPIE Press, Bellingham, Washington
(2007). Google Scholar
M. C. Pierce et al.,
“Accuracy of in vivo multimodal optical imaging for detection of oral neoplasia,”
Cancer Prev. Res., 5
(6), 801
–809
(2012). http://dx.doi.org/10.1158/1940-6207.CAPR-11-0555 Google Scholar
H. Akbari et al.,
“Hyperspectral imaging and quantitative analysis for prostate cancer detection,”
J. Biomed. Opt., 17
(7), 076005
(2012). http://dx.doi.org/10.1117/1.JBO.17.7.076005 Google Scholar
K. Masood et al.,
“Hyperspectral colon tissue classification using morphological analysis,”
in Proc. Second Int. Conf. on Emerging Technologies 2006,
735
–741
(2006). Google Scholar
E. Lindsley, E. S. Wachman and D. L. Farkas,
“The hyperspectral imaging endoscope: a new tool for in vivo cancer detection,”
Proc. SPIE, 5322 75
–82
(2004). http://dx.doi.org/10.1117/12.561884 Google Scholar
A. O. H. Gerstner et al.,
“Hyperspectral imaging of mucosal surfaces in patients,”
J. Biophotonics, 5
(3), 255
–262
(2012). http://dx.doi.org/10.1002/jbio.201100081 Google Scholar
M. E. Martin et al.,
“Development of an advanced hyperspectral imaging (HSI) system with applications for cancer detection,”
Ann. Biomed. Eng., 34
(6), 1061
–1068
(2006). http://dx.doi.org/10.1007/s10439-006-9121-9 Google Scholar
R. Martin, B. Thies and A. O. H. Gerstner,
“Hyperspectral hybrid method classification for detecting altered mucosa of the human larynx,”
Int. J. Health Geographics, 11 21
(2012). Google Scholar
N. T. Clancy et al.,
“Multispectral image alignment using a three channel endoscope in vivo during minimally invasive surgery,”
Biomed. Opt. Express, 3
(10), 2567
–2578
(2012). http://dx.doi.org/10.1364/BOE.3.002567 Google Scholar
R. Leitner et al.,
“Multi-spectral video endoscopy system for the detection of cancerous tissue,”
Pattern Recognit. Lett., 34
(1), 85
–93
(2013). http://dx.doi.org/10.1016/j.patrec.2012.07.020 Google Scholar
S. Kiyotoki et al.,
“New method for detection of gastric cancer by hyperspectral imaging: a pilot study,”
J. Biomed. Opt., 18
(2), 026010
(2013). http://dx.doi.org/10.1117/1.JBO.18.2.026010 Google Scholar
Z. Han et al.,
“In vivo use of hyperspectral imaging to develop a noncontact endoscopic diagnosis support system for malignant colorectal tumors,”
J. Biomed. Opt., 21
(1), 016001
(2016). http://dx.doi.org/10.1117/1.JBO.21.1.016001 Google Scholar
S. Chaudhuri et al.,
“Detection of blood-vessels in retinal images using two-dimensional matched-filters,”
IEEE Trans. Med. Imaging, 8
(3), 263
–269
(1989). http://dx.doi.org/10.1109/42.34715 Google Scholar
W. R. Crum, T. Hartkens and D. L. G. Hill,
“Non-rigid image registration: theory and practice,”
Br. J. Radiol., 77 S140
–S153
(2004). http://dx.doi.org/10.1259/bjr/25329214 Google Scholar
J. Kybic,
“Elastic image registration using parametric deformation models,”
Citeseer, 13
–159
(2001). Google Scholar
H. Lange et al.,
“Reflectance and fluorescence hyperspectral elastic image registration,”
Proc. SPIE, 5370 11
(2004). http://dx.doi.org/10.1117/12.535720 Google Scholar
R. S. Mitra and N. N. Murthy,
“Elastic, maximal matching,”
Pattern Recognit., 24
(8), 747
–753
(1991). http://dx.doi.org/10.1016/0031-3203(91)90043-5 Google Scholar
B. Zitova and J. Flusser,
“Image registration methods: a survey,”
Image Vision Comput., 21
(11), 977
–1000
(2003). http://dx.doi.org/10.1016/S0262-8856(03)00137-9 Google Scholar
B. F. Guo et al.,
“Band, selection for hyperspectral image classification using mutual information,”
IEEE Geosci. Remote Sens. Lett., 3
(4), 522
–526
(2006). http://dx.doi.org/10.1109/LGRS.2006.878240 Google Scholar
J. M. Sotoca, F. Pla and A. C. Klaren,
“Unsupervised band selection for multispectral images using information theory,”
in Proc. of the 17th Int. Conf. on Pattern Recognition,
510
–513
(2004). Google Scholar
BiographyXiaozhou Gu is a PhD student in the Department of Biomedical Engineering at Peking University. His research interests include medical device analysis and marketing. Zhimin Han is a postdoc in the College of Engineering at Peking University. His research interests include medical device development, electronics hardware design, and medical image analysis. Ye Fu is a master’s student in the Department of Biomedical Engineering at Peking University. His research interests include medical device development and electronics hardware design. |


