|
|
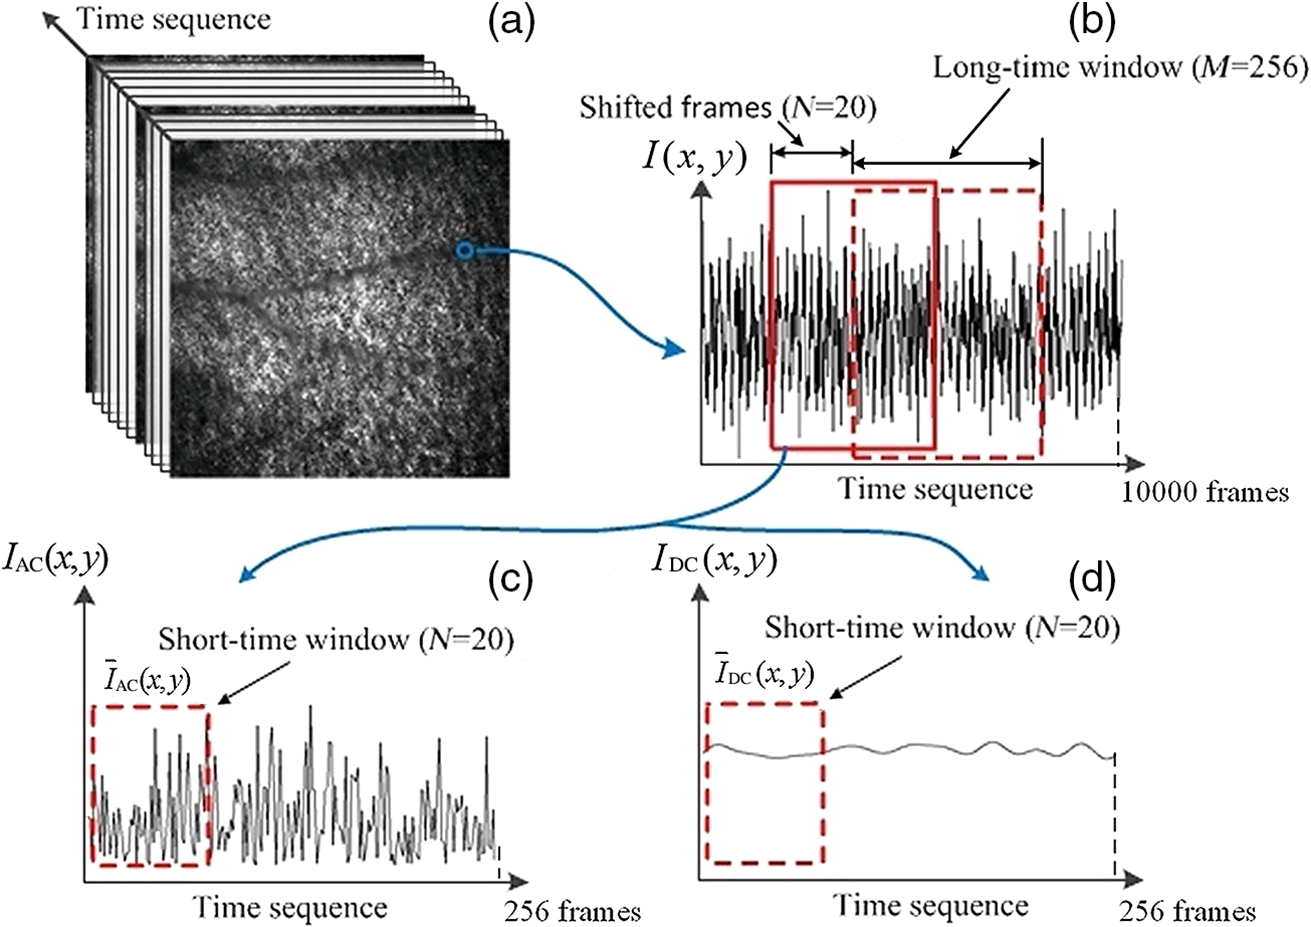
1.IntroductionHemodynamic monitoring after an ischemic event is an effective means of assessing and understanding recovery from numerous diseases, such as strokes.1,2 Vascular occlusion tests (VOTs) are often employed for this type of monitoring and are based on microcirculation functions. Thus, VOTs can be used to examine blood flow capacity increases after ischemic events, such as temporary disruptions of arterial or venous flow, and to monitor postischemic reactive hyperemia, by investigating the responses of microvessels to a local stimulus.3,4The use of high-resolution optical techniques to monitor vascular network changes can yield further insight into the nature of hemodynamic responses.5,6 Some full-field optical imaging techniques are currently being developed with the objective of obtaining high-resolution spatial and temporal data for local hemodynamics monitoring.7,8 Laser speckle imaging, which is based on temporal speckle contrast analysis (TSCA), has been widely used to study blood flow characteristics.9–11 This method is based on the dynamic speckle pattern blurring, which results from the integration time being longer than the typical speckle pattern decorrelation time. The level of blurring is quantified by the speckle contrast to reconstruct blood flow images. However, TSCA imaging is also affected by the moving particles concentration and the flow velocity; thus, it is not easy to measure a specific physical quantity from a reconstructed image. Other disadvantages include that TSCA imaging is not immune to low-frequency background noise and that its spatial resolution cannot meet the requirements of optical microangiography. Recently, we developed a laser speckle imaging technique, namely, laser speckle imaging with intensity fluctuation modulation (LSI-IFM).12,13 In this method, LSI-IFM is used to separate the dynamic and static speckle signals that originate from moving and nonmoving particles, respectively. This approach yields the moving particles distribution and strongly suppresses the low-frequency background noise. Thus, high-spatial-resolution vascular network images can be obtained. However, their temporal resolution, of about 3 s per LSI-IFM image, is not sufficiently high to capture blood microcirculation changes.14 In this study, we further developed this technique and achieved high-temporal-resolution, full-field optical angiography by using the short-time modulation depth (STMD) to perform imaging. This revised method can achieve a temporal resolution of 0.04 s per image, significantly better than the 3-s temporal revolution of the LSI-IFM method. Phantom and biological experiments were also performed and the results verify the feasibility of using the STMD imaging method to perform high-temporal-resolution, full-field VOTs in vivo. 2.Materials and MethodsA schematic diagram of the experimental setup is shown in Fig. 1. An 85-mW laser beam with a central wavelength of 650 nm was emitted by a semiconductor laser and was expanded by a beam expander. A parallel beam with a diameter of 20 mm obliquely incidents on the sample from the same side of the camera. In this experiment, a custom varifocus bitelecentric system lens (depth of field: ) and matrix CMOS camera (A504, Basler, with maximum resolution of ) with an image acquisition rate of 500 fps were used to acquire the raw laser speckle images, and Labview® and MATLAB® software were employed for data acquisition and processing, respectively. The entire imaging apparatus was fixed on a vibration-isolating optical platform to reduce the effects from external shaking. Fig. 1Schematic diagram of experimental setup. Tube driven by double-channel syringe pump and rabbit ear were used to obtain STMD images.  In the proposed method, full-field optical angiography is realized by using an undersampling method to separate the dynamic and static speckle signals, which arise from moving and nonmoving particles, respectively. In general, dynamic speckle signals are generated by the Doppler effect of the moving particles, whose frequencies can be up to 10 kHz.7 According to the Nyquist sampling theorem, to extract a precise dynamic speckle signal, the camera’s frame rate should be at least twice the Doppler signal frequency. Consequently, the camera’s resolution must be low to obtain a sufficiently high acquisition speed because the rate of data transmission from the camera to the computer is finite.15 However, in our method, a high-speed digital camera is used to avoid this problem and can obtain high-spatial-resolution images since its exposure and acquisition periods can be independently set by software. As shown in Fig. 2(a), if the camera’s exposure period is very short, i.e., less than the speckle signal period, the high-frequency speckle signal variations can be captured. For example, if the exposure period is set to , as required by the Nyquist sampling theorem, dynamic speckle signal fluctuations with frequencies of up to 10 kHz can be captured. On the other hand, if the camera’s acquisition period is relatively low (such as that corresponding to the 500 fps image acquisition rate used in our system) and is less than what is demanded by the Nyquist sampling theorem, then the camera can only capture fragments of the high-frequency dynamic speckle signal. In this case, the recorded signals are completely random [Fig. 2(b)]. In contrast, the stationary speckle intensity from nonmoving particles is not affected by changes in the camera’s exposure and acquisition periods because their signal approaches a constant signal over time [Fig. 2(c)].Therefore, the dynamic and static speckle signals can be separated in the frequency domain, as shown in Fig. 2(d). In our approach, a highly undersampled Doppler signal is used to extract the dynamic speckle signal. Fig. 2(a) Sketch of speckle signal recorded by camera; (b) dynamic speckle signal; (c) static speckle signal captured using shorter exposure time; (d) dynamic signals () and static signals () in frequency domain. is cut-off frequency and is sample rate of camera.  In our previous work, the modulation depth (MD) was used as the image parameter to reconstruct blood flow images and was defined as14 where and represent the integration over amplitude spectrum values of the dynamic and static speckle signals in the frequency domain, respectively. According to our previous study, the MD mainly represents the moving particles concentration and is not sensitive to the flow speed. However, the LSI-IFM method requires a long acquisition time because are required to reconstruct a single LSI-IFM image. To realize high-temporal-resolution, full-field optical angiography, a quantity called STMD was developed in this study and was employed as the imaging parameter. Figure 3 illustrates this process in detail. First, the camera acquired a time series of raw speckle images [Fig. 3(a)]. In our VOT, the camera took to acquire 40116 raw image frames continuously. Figure 3(b) shows the corresponding signal series at pixel , which is indicated by a blue circle in Fig. 3(a). Second, from the selected 256-frame-long time window [the red solid-line rectangle in Fig. 3(b)], the dynamic and stationary speckle signals were separated in the frequency domain, as shown in Fig. 3(d). This separation was achieved by performing a fast Fourier transform (FFT) with a cut-off frequency of 10 Hz, which was determined based on the experimental conditions, including the inevitable sample movement that occurs due to the subject’s heart-beat and breathing, the stationary speckle intensity fluctuates slightly, and the related noises. By applying inverse FFTs to both the dynamic and stationary speckle signals and taking the absolute values of the results, the dynamic and static speckle signal time series of 256 absolute frames that are shown in Fig. 3(c) and 3(d), respectively, were obtained. Then, the first 20 absolute frames of each series were averaged to obtain the short-time absolute signals and , respectively. Finally, STMD was defined as follows: As shown in Figs. 3(c) and 3(d), STMD was calculated based on the first 256 frames in the long-time windows. To achieve high-temporal-resolution monitoring, we chose to shift the second long-time window by only 20 frames, i.e., the width of a short-time window [red dashed-line rectangles in Figs. 3(c) and 3(d)]. Then, we obtained the corresponding STMD value in the same manner. Following this procedure, we calculated STMD along the entire time sequence. With the 500 fps sampling rate and 20-frame averages that were used in our experiment, the temporal resolution of the resulting STMD image was about 0.04 s, indicating that our method can be considered high-temporal-resolution, full-field optical angiography.3.Experiment and ResultsThe results of the following experiment verified that STMD can be used as an imaging parameter to perform VOTs. A solution was used to simulate blood flow, and particles with diameters between were employed as the moving particles. A precision double-channel syringe (JZB-2800, JYM) was used to pump pure water [syringe A in (Fig. 1)] and solution [syringe B in (Fig. 1)] into a single polyethene tube, which had an inner diameter of 1 mm. The concentration in the polythene tube was precisely controlled by adjusting the speeds of the flows from syringes A and B. The imaging area was about . The camera captured 9000 frames at an acquisition rate of 500 fps during the VOT processing. The experimental process was as follows. When the acquisition began, syringes A and B pumped pure water and solution () at flow rates of 1 and , respectively, into the polyethene tube. After 3.72 s, the solution pump, i.e., the flow from syringe B, was stopped and begun again at 11.84 s. The entire VOT process took 8.12 s. Video 1 shows the dynamic changes of the STMD image in detail and Fig. 4 presents selected STMD images taken before, during, and after stopping the solution flow. A area [shown in Fig. 4(a)] was used to calculate the average STMD value. Figure 4(g) presents the STMD trace resulting from the VOT. Points (a)–(f) that are marked in Fig. 4(g) correspond to the STMD images shown in Figs. 4(a)–4(f). The decreasing region in Fig. 4(g) shows the gradual decline in concentration that occurs after the occlusion at 3.72 s. The reason that this decrease is gradual rather than immediate is that the particles diffusion in the pure water delays the concentration drop. When the flow begins again at 11.84 s, STMD rapidly returns to its initial value, demonstrating the high-temporal-resolution nature of our method. Fig. 4(a)–(f) Sequential STMD images obtained during phantom VOT; (g) average temporal STMD profile of area indicated by rectangle in (a). Simulated occlusion begins at 3.72 s in (b) and is removed at 11.84 s in (e) [Video 1, MOV, 9.42 MB (URL: http://dx.doi.org/10.1117/1.JBO.21.8.086002.1)].  A biomedical VOT experiment was performed and demonstrated that our method can be used to monitor vascular network changes in vivo. The specimen was a rabbit with a mass of 200 g that was anesthetized with 10% chloral hydrate (0.4 mL). Its ear was depilated with a hair remover lotion and the area used for imaging was pressed by a glass rod to cause blood vessel occlusion. The animal was treated according to Regulations for the Administration of Affairs Concerning Experimental Animals, which were approved by the State Science and Technology Commission of China, and the Guangdong Province regulations for the care and handling of laboratory animals. The high-speed camera (500 fps) recorded 40116 raw speckle images during the 80.23-s acquisition time to reconstruct a 1994 frame STMD image. The occlusion began at 3.48 s and was released at 47.20 s. The resulting raw laser speckle and STMD image sequences are presented in Figs. 5 and 6, respectively. The snapshots were obtained before, during, and after occlusion. In the raw laser speckle image sequences, the blood flow cannot be distinguished from the background tissue. Thus, the tracking profile in Fig. 5(g) shows no changes during the VOT, which is also verified by Video 2. However, as shown by the STMD images in Fig. 6, the vascular network can be reconstructed by using our STMD-parameter-based, full-field optical angiography method. During the occlusion, the vessels and background brighten at first; then, the vessels disappear gradually, and the background becomes dark. A sufficient time after releasing the occlusion, the vessel network returns to its normal state. From the full-field optical angiography image (Fig. 6 and Video 3), an important congestion phenomenon can be directly observed, where Figs. 6(g) and 6(h) present VOT time-trace profiles at the vessel position indicated by rectangles “A” and “B” (), respectively, in Fig. 6(a). When the occlusion starts, the first congestion is mainly caused by venous congestion (point “b” at 4.24 s); when the occlusion stops, arterial congestion occurs at the dominant position (point “e” at 49.16 s) and the network gradually returns to the normal condition. The difference between the two congestions occurs because veins and arteries have different reactions to vascular occlusion. A similar phenomenon has been observed in other experiments performed using ultrasound.16 As shown in Video 3 and Figs. 6(b) and 6(e), the background signal abruptly increases when the congestion occurs. A possible explanation is that the interstitial fluid around the adipose tissue undergoes an emergency reaction to response to the sudden global congestion. However, at some instances [point “1” at 8.26 s and point “2” at 13.47 s that are marked in Figs. 6(g) and 6(h)], the two vessels show different dynamic responses. This result demonstrates that STMD images can also reveal the local dynamic changes in blood vessels. Obviously, an additional benefit of the high-temporal-resolution and full-field character of the STMD method is that rapid global and local changes in vascular networks can be monitored. Fig. 5Time series of raw images (a) before, (b)–(d) during, and (e), (f) after occlusion of rabbit ear artery (Video 2). Imaging area is . (g) Time trace of blood flow, where intensity is average value in area indicated by rectangle in (a) [Video 2, MOV, 10.5 MB (URL: http://dx.doi.org/10.1117/1.JBO.21.8.086002.2)].  Fig. 6Time series of STMD images (a) before, (b)–(d) during, and (e), (f) after occlusion of rabbit ear artery (Video 3). Imaging area is . (g) and (h) are time traces of blood flow, where STMDs are average values in areas indicated by rectangles A and B in (a), “1” and “2” are at 8.26 and 13.47 s, respectively [Video 3, MOV, 8.09 MB (URL: http://dx.doi.org/10.1117/1.JBO.21.8.086002.3)].  4.Discussion and ConclusionAlthough the results of both the phantom and biological experiments demonstrate the abilities high-temporal-resolution of our method, the STMD image display is not in real time. For this purpose, graphics processing unit techniques could be employed in our system, since these could simultaneously acquire raw data and display STMD images. The exposure time of the camera on the STMD images is obtained significantly. When the flow speed is sufficiently fast, a substantial part of its energy will be aliased back into the direct current (DC)-band, which presumably could affect the MD measurement. In the future, a pulsed laser could be used as the illumination source to trigger the synchronization acquisition. For a pulsed laser with short pulse width and high peak power, an ultrashort integration time and a high illumination intensity could be obtained simultaneously. The above-mentioned experimental results indicate that our method could be applied to develop a microcirculation function imaging tool suitable for studying small animal brain models or eye retinas, e.g., to investigate ischemic thrombotic strokes or neurological responses to sensory simulations.17 It can also be used clinically to study cutaneous angiogenesis during wound healing. Since STMD images are mainly sensitive to move red cell concentrations, a dual-wavelength STMD imaging technique could be developed to perform simultaneous imaging of blood flow and hemoglobin oxygenation changes at high spatiotemporal resolutions.18 Another possible application is in the study of microfluidic systems, since this method could be used to control and monitor the reaction time and chemical concentration in each droplet precisely.19 However, the most distinct advantage of our method is that it enables high-temporal-resolution, full-field imaging for moving particle concentration change monitoring in transparent microfluidic systems. In summary, we proposed a high-temporal-resolution, full-field optical angiography method that employs STMD as the imaging parameter. Phantom and biological VOTs were conducted and demonstrated that STMD images can be used to monitor vascular network changes with high temporal and spatial resolution. Our method could be developed into a functional imaging tool to study tissue hemodynamics in vivo or reaction kinetics in microfluidic systems. AcknowledgmentsThis work is supported by the National Natural Science Foundation of China Grants (11474053, 61307062, 61275214), the Science and Technology Planning Project of Guangdong Province Grant (2016A020220021), the Central of China Supporting Local Finance Project, the Special Fund for Science and Technology Innovation of Foshan Grant (2015GA10001), the Science Research Project of Guangzhou Grant (2014J4100130 ), Foshan Science and Technology Type for Small and Medium-sized Enterprise Technology Innovation Fund Project Grant (2014AA100802), the College Students Innovation of Science and Technology Cultivate Special Funds of Guangdong Province Grant (pdjh2016b0530). ReferencesM. Chopp, Z. G. Zhang and Q. Jiang,
“Neurogenesis, angiogenesis, and MRI indices of functional recovery from stroke,”
Stroke, 38 827
–831
(2007). http://dx.doi.org/10.1161/01.STR.0000250235.80253.e9 SJCCA7 0039-2499 Google Scholar
M. Chaturvedi and L. Kaczmarek,
“Mmp-9 inhibition: a therapeutic strategy in ischemic stroke,”
Mol. Neurobiol., 49 563
–573
(2014). http://dx.doi.org/10.1007/s12035-013-8538-z MONBEW 0893-7648 Google Scholar
E. Futier et al.,
“Use of near-infrared spectroscopy during a vascular occlusion test to assess the microcirculatory response during fluid challenge,”
Crit. Care, 15 5
(2011). http://dx.doi.org/10.1186/cc10449 Google Scholar
R. Bezemer et al.,
“Assessment of tissue oxygen saturation during a vascular occlusion test using near-infrared spectroscopy: the role of probe spacing and measurement site studied in healthy volunteers,”
Crit. Care, 13 1
–7
(2009). http://dx.doi.org/10.1186/cc8002 Google Scholar
J. Qin et al.,
“Hemodynamic and morphological vasculature response to a burn monitored using a combined dual-wavelength laser speckle and optical microangiography imaging system,”
Biomed. Opt. Express, 3 455
–466
(2012). http://dx.doi.org/10.1364/BOE.3.000455 BOEICL 2156-7085 Google Scholar
S. Magder,
“Hemodynamic monitoring in the mechanically ventilated patient,”
Curr. Opin. Crit. Care, 17 36
–42
(2011). http://dx.doi.org/10.1097/MCC.0b013e32834272c1 Google Scholar
A. Serov and T. Lasser,
“High-speed laser Doppler perfusion imaging using an integrating CMOS image sensor,”
Opt. Express, 13 6416
–6428
(2005). http://dx.doi.org/10.1364/OPEX.13.006416 OPEXFF 1094-4087 Google Scholar
J. D. Briers and S. Webster,
“Laser speckle contrast analysis (LASCA): a nonscanning, full-field technique for monitoring capillary blood flow,”
J. Biomed. Opt., 1 174
–179
(1996). http://dx.doi.org/10.1117/12.231359 JBOPFO 1083-3668 Google Scholar
P. Li et al.,
“Imaging cerebral blood flow through the intact rat skull with temporal laser speckle imaging,”
Opt. Lett., 31 1824
–1826
(2006). http://dx.doi.org/10.1364/OL.31.001824 OPLEDP 0146-9592 Google Scholar
R. Bezemer et al.,
“Real-time assessment of renal cortical microvascular perfusion heterogeneities using near-infrared laser speckle imaging,”
Opt. Express, 18 15054
–15061
(2010). http://dx.doi.org/10.1364/OE.18.015054 OPEXFF 1094-4087 Google Scholar
R. Bezemer et al.,
“Validation of nearinfrared laser speckle imaging for assessing microvascular (re)perfusion,”
Microvasc. Res., 79 139
–143
(2010). http://dx.doi.org/10.1016/j.mvr.2010.01.004 MIVRA6 0026-2862 Google Scholar
Y. Zeng et al.,
“Laser speckle imaging based on intensity fluctuation modulation,”
Opt. Lett., 38 1313
–1315
(2013). http://dx.doi.org/10.1364/OL.38.001313 OPLEDP 0146-9592 Google Scholar
M. Wang et al.,
“In vivo label-free microangiography by laser speckle imaging with intensity fluctuation modulation,”
J. Biomed. Opt., 18 126001
(2013). http://dx.doi.org/10.1117/1.JBO.18.12.126001 JBOPFO 1083-3668 Google Scholar
M. Wang et al.,
“Full-field optical micro-angiography,”
Appl. Phys. Lett., 104 053704
(2014). http://dx.doi.org/10.1063/1.4864156 APPLAB 0003-6951 Google Scholar
M. Leutenegger et al.,
“Real-time full field laser doppler imaging,”
Biomed. Opt. Express, 2 1470
–1477
(2011). http://dx.doi.org/10.1364/BOE.2.001470 BOEICL 2156-7085 Google Scholar
V. Zoran et al.,
“Elevation in resting blood flow attenuates exercise hyperemia,”
J. Appl. Physiol., 93 134
–140
(2002). http://dx.doi.org/10.1152/japplphysiol.00421.2001 Google Scholar
Z. Pengyue, Y. Huixian and Z. Naiyun,
“Early exercise improves cerebral blood flow through increased angiogenesis in experimental stroke rat model,”
J. NeuroEng. Rehabil., 10 1
–10
(2013). http://dx.doi.org/10.1186/1743-0003-10-43 Google Scholar
L. Zhongchi et al.,
“Simultaneous imaging of cortical hemodynamics and blood oxygenation change during cerebral ischemia using dual-wavelength laser speckle contrast imaging,”
Opt. Lett., 34 1480
–1482
(2009). http://dx.doi.org/10.1364/OL.34.001480 OPLEDP 0146-9592 Google Scholar
D. Schafer et al.,
“Three-dimensional chemical concentration maps in a microfluidic device using two-photon absorption fluorescence imaging,”
Opt. Lett., 32 2568
–2570
(2007). http://dx.doi.org/10.1364/OL.32.002568 OPLEDP 0146-9592 Google Scholar
|