|
|
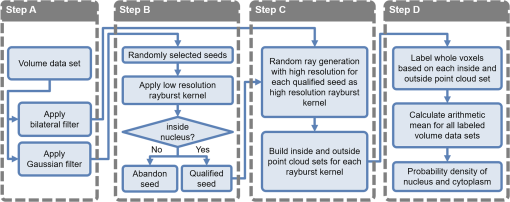
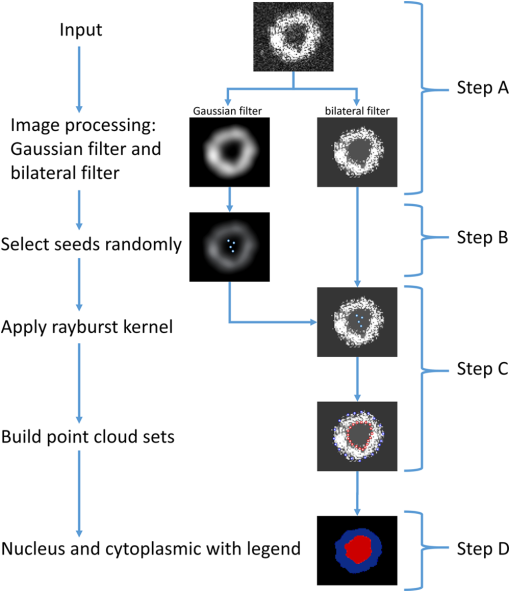
1.IntroductionSingle-cell morphology is important in differentiating disease conditions from normal. In particular, the nuclear-to-cytoplasmic (N/C) ratio is an important feature to distinguish cancer cells from normal counterparts. In conventional cytopathology, cells printed or smeared on a glass slide were stained and then evaluated by two-dimensional (2-D) images through light microscopy. In recent years, many emerging optical technologies—optical coherence tomography (OCT)1,2 and digital holography—have provided three-dimensional (3-D) cell morphology.3 3-D volume tomograms, compared with 2-D images, are more accurate in presenting cellular volume and morphology. Estimating N/C ratio, important to discriminate cancer cells from the normal counterpart, is a challenging task for 2-D imaging modalities. The 2-D N/C ratio was not reliable because the 2-D microscopy showed only a random tangent plane of cells. A more accurate estimation of N/C ratio is often derived from summarizing N/C ratios from different section planes, which is a laborious job. Higher harmonic generation microscopy, which detects the second and third harmonic generation fluorescence, can estimate the volumetric N/C ratio of a group of cells in a single observing plane, but not single-cell N/C ratio.4 To overcome the drawback of the aforementioned 2-D imaging modalities, an instrument that provides isometric high resolutions in both axial and lateral directions is needed. OCT is an optical device that provides depth-resolved 3-D images, which derives from interference signals between backscattered light from the tested samples and reference mirror. OCT has been widely used in ophthalmology for retina imaging but has recently been applied for single-cell imaging.5 The N/C ratio is a critical feature for evaluating whether cells are normal or cancerous.6,7 If the cells undergo physiological changes such as apoptosis and cancerous development, then the N/C ratio changes. For example, the nuclear volume and the N/C ratio of melanoma are larger than those of melanocytes.8 Therefore, the N/C ratio is a helpful indicator for the different stages of a single cell. Among the techniques that provide cellular resolution in lateral direction—microcomputed tomography, fluorescence microscopy, confocal fluorescence microscopy, and OCT—only OCT offers a cellular resolution in the axial direction. Full-field optical coherence tomography (FF-OCT) is a variant of OCT that achieves a submicron resolution in both axial and lateral directions.9 FF-OCT illuminates the whole field and captures the interference signals by a CCD or CMOS camera, greatly enhancing the imaging speed.10 Furthermore, the axial resolution and lateral resolutions are almost the same (isometric), enabling FF-OCT to provide both high-resolution cross-sectional ( and planes) and en face ( plane) images that reflectance confocal microscopy cannot deliver.9 FF-OCT is a label-free technology and its tomographic images can be used for subsequent quantitative analysis. Taken together, these features make FF-OCT an ideal tool for single-cell imaging.10–14 The light source of the FF-OCT used in this study has low incident power, is incoherent, is continuous in the time domain, and has a wide bandwidth in the frequency domain. The incident power of our FF-OCT system was 3 mW (focal spot size about diameter). Its high resolution in the axial direction depends on the bandwidth of the light source. The light source output is generated by a single-clad crystal fiber, pumped by a 446-nm laser diode, yielding a broadband light of a 560-nm central wavelength and a 95-nm bandwidth.15 The current FF-OCT system provides lateral and axial resolutions. To analyze the 3-D volumetric data acquired by FF-OCT, both one-dimensional (1-D) and 2-D transfer functions are inadequate.16–18 1-D transfer function with volume rendering is not only insufficient to analyze the whole cell volume but also has difficulty delineating nuclear and cell membranes. 2-D and multidimensional transfer functions also encounter similar hurdles, as these transfer functions are unable to handle the intracellular refractive index changes recorded in OCT data. Rodriguez et al.19 reported the first rayburst sampling algorithm applied to 3-D neuronal morphometry in 2006. To identify the precise position of the nucleus and cytoplasm easily without specific expertise, we utilized this algorithm and proposed a random rayburst sampling (RRBS) framework. RRBS can detect the boundaries of the nuclear and cell membranes in 3-D space acquired by FF-OCT and separate volumetric data into three parts: nucleus, cytoplasm, and area outside the cells. After RRBS framework processing, the precise spatial distribution of the nucleus and cytoplasm is labeled as a numerical probability density. The quantified parameters—volume size, surface area, surface morphology of the nucleus and cytoplasm, and volumetric N/C ratio—can be calculated easily. Supplementary numerical information is useful for statistical analysis of the cells. 2.MethodsA single cell [Fig. 1(a)] contains a nucleus, cytoplasm, and cell membrane along with organelles inside the cytoplasm, such as mitochondria and the Golgi apparatus. The signal of OCT represents the refractive index changes of material in 3-D space, and the expected scan result of OCT is provided in Fig. 1(b). However, because of resolution limit and background noise, the OCT scan result appears more similar to Fig. 1(c). A typical intensity profile of the distance between points A and D in Fig. 1(c) is shown in Fig. 1(d). The two peaks in Fig. 1(d) represent the boundaries of the nucleus and the cell membrane [points B and C, respectively, in Fig. 1(c)]. Fig. 1Schematic of a single cell. (a) Original en face image. (b) The same en face image of (a) scanned through OCT theoretically; the intensity represents the refractive index change. (c) Actual OCT scan results because of resolution limit and background noise. (d) A typical intensity profile from point A to point D in (c).  The 3-D volumetric data scanned through FF-OCT cannot directly reveal the center of the nucleus. The intensity of the OCT signal represents the refractive index change in 3-D space. The stronger the OCT signal, the larger the refractive index change in 3-D space. According to this physical characterization, we detect the boundaries of the membranes (nuclear and cell membranes) in 3-D space, and then on the basis of these reference points, depict the boundaries. After the processing of the RRBS framework, each voxel of 3-D volumetric data can be labeled as three types: inside the nucleus, inside the cytoplasm, and outside the cell. The FF-OCT used in this study provides isometric submicron resolutions—lateral () and axial ()—which allow the system to provide high-resolution images in both cross-sectional ( and planes) and en face ( plane) directions. Figure 2 shows en face images of a human keratinocyte suspended in gel scanned by FF-OCT. Figure 3 shows the FF-OCT and Zeiss LSM 510 meta confocal microscope scanning result of the melanocyte. Human keratinocytes and melanocytes isolated from human skin specimens were suspended in gel, and then acquired by the FF-OCT. The study protocol was approved by the institutional review board of National Taiwan University Hospital. Signed consents were obtained from patients before skin sample collection. Fig. 2En face images of a keratinocyte at different depths (-axis) from left to right and top to bottom. These images were captured through FF-OCT, without any biologically toxic agent. The scale bar is in the lateral direction ( plane). The depth between every two slices in the axial direction is . 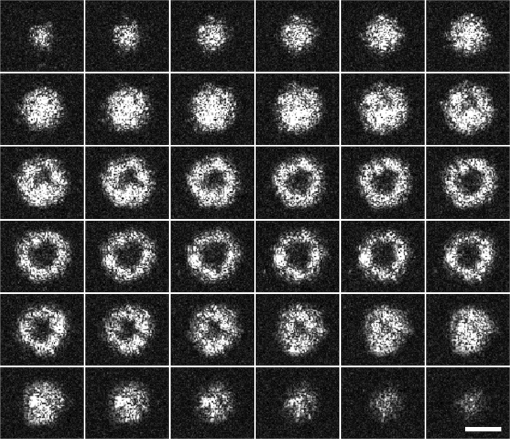 Fig. 3The FF-OCT and Zeiss LSM 510 meta confocal microscope scanning result of the melanocyte. (a) The FF-OCT scanning result. (b) The cytoplasm of melanocyte scanned by confocal microscope. (c) The nucleus of melanocyte scanned by confocal microscope. The scale bar is in the lateral direction ( plane). 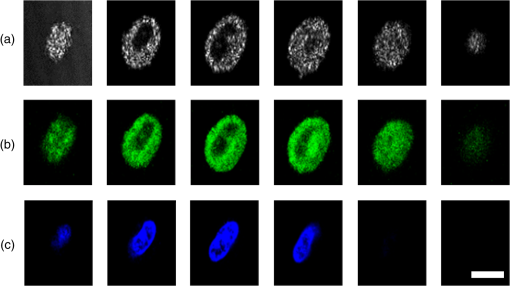 The framework and its verification method are discussed in the next section. The flow of the RRBS framework (Fig. 4) comprises the following four steps (Fig. 5):
2.1.Step A: FilteringIn this step, digital filters—Gaussian filter and bilateral filter20—are applied to the volumetric data in 3-D space. The Gaussian filter is an impulse response of a Gaussian function. The intensity value of each pixel in an image is replaced by a weighted average of intensity values from nearby pixels. The Gaussian function is expressed as where is the coordinate of a discrete point and is the coordinate of the center point. Both and are in 3-D space. The Gaussian filter is applied to original volume data , generating filtered volume data , which is used to select qualified seeds in step B. A crucial parameter, , is associated with the spatial frequency. In this study, we employ the Gaussian filter to remove the high spatial frequency signal and to preserve the low spatial frequency signal. The spatial frequency of the nuclear membrane is higher than that of the cell membrane. The spatial frequency of the nuclear membrane is set as the cutoff frequency of the Gaussian filter. The cutoff frequency of a Gaussian filter is given as where is the sampling rate. In this study, the diameter of the nucleus was . According to Eq. (2), the appropriate is .The bilateral filter is an edge-preserving and noise-reducing filter. The function of the bilateral filter is expressed as where is the coordinate of a discrete point and is the coordinate of the center point. Both and are in 3-D space. Furthermore, is a coefficient for controlling the decay rate depending on the distance between the discrete and center points, whereas is a coefficient for controlling the decay rate depending on the intensity differences between the discrete and center points. Moreover, is the intensity at position , and is the intensity at position ; both are normalized to 0 to 255. The parameter in Eq. (3) is the same as in Eq. (1). The parameter in Eq. (3) is associated with the level of noise that must be removed. The intensity difference between neighboring pixels of noise is assumed to be . The relationship between and is expressed as According to Eq. (4), the appropriate for noise level is 0.989.Figure 6 shows the application of the 3-D Gaussian and bilateral filters. For the original FF-OCT volumetric data applied by the 3-D Gaussian and bilateral filters, the results are denoted as and , respectively. 2.2.Step B: Randomly Selecting SeedsIn this step, we employ rayburst sampling.19 The goal of this step is to select a certain number of qualified voxels inside the nucleus randomly. The OCT volumetric data of a single cell in Figs. 2 and 3 show the following two features:
To increase the efficiency, both spherical and Cartesian coordinate systems are employed. A voxel inside the nucleus is randomly selected as a center point, and then, a rayburst kernel is generated. Each ray passes inside out, and intensity profiles of each ray can be obtained. The parameter is assumed to be an angle separated in and directions. If the rayburst kernel condition is , then six rays are generated, with the unit vector of each ray being (1, 0 deg, 0 deg), (1, 90 deg, 0 deg), (1, 180 deg, 0 deg), (1, 270 deg, 0 deg), (1, 0 deg, 90 deg), and (1, 0 deg, ), resulting in a low-resolution rayburst kernel. For the condition of , 2522 rays are generated, resulting in a high-resolution rayburst kernel. In this step, voxels in are randomly selected and six rays with are generated. Subsequently, are randomly generated as Euler angles, and the rayburst kernel is rotated according to a sequence of intrinsic rotations . Therefore, the rayburst kernel has random positions and rotation angles in 3-D space. This rayburst kernel contains six rays from inside out, and each ray can generate an intensity profile from . The donut signature is evaluated according to these six intensity profiles, and a diagrammatic threshold, , is assumed; if the maximum intensity of each intensity profile is greater than , then the seed (voxel) is considered to be inside the nucleus and qualified. These qualified voxels are considered qualified seeds. Finally, qualified seeds are selected. 2.3.Step C: Detecting BoundariesIn this step, the seeds are used to locate the boundary points of the nuclear membrane and cell membrane. According to the fundamentals of OCT, the intensity peak represents the refractive index changes in 3-D space. From the perspective of cell physiology, the refractive index changes can represent the following:
Figure 7(a) shows an en face image of a single cell (3-D), on which the 3-D bilateral filter was applied. In other words, the RRBS framework randomly selected a seed inside the nucleus and then generated two rays from this seed parallel to the en face plane. The intensity profiles of these two rays are shown in Fig. 7(b). The location of the reflective index changes in 3-D space was determined by detecting the local maximum peak of the intensity profile. In Fig. 7(b), the innermost (points A and C) and outermost (points B and D) peaks are the boundaries of the nuclear membrane and cell membrane, respectively. Each ray is expected to detect two boundary points—the nuclear membrane and cell membrane. If the condition of the rayburst kernel is , then the 2522 rays will detect 2522 inner boundary points as a point cloud set for the nuclear membrane and will detect 2522 outer boundary points as a point cloud set for the cell membrane. Because the seeds inside the nucleus are randomly selected in step B, each seed generates a randomly rotated rayburst kernel, and each rayburst kernel detects inner and outer boundary point cloud sets. These point cloud sets determine the space distribution of the nucleus and cytoplasm and their boundaries in step D. Fig. 7(a) En face image of a single cell with 3-D bilateral filtering. (b) The intensity profile of the horizontal tangent in (a). The horizontal tangent passed through a seed inside the nucleus. Points A and C are the boundary points of the nuclear membrane, and points B and D are the boundary points of the cell membrane. The scale bar is in the lateral direction ( plane). 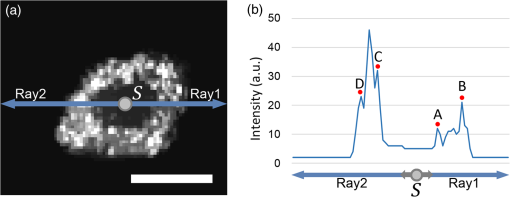 The FF-OCT system detects the backscattered light from large organelles like Golgi body, mitochondrion, and endoplasmic reticulum in the cytoplasm. As shown in Fig. 3, there are signals that marked out the cytoplasm area. The nucleolus varies in size, ranging from 0.2 to , depending on the types of cells and the metabolic status of cells.21–24 A large, prominent nucleolus might generate sufficient backscattering signals to be detected in the FF-OCT system. Under light microscopy, hyperchromatism (the presence of excess chromatin or nuclear staining that resulted in optical inhomogeneities) of the nucleus in hematoxylin and eosin stained slides may represent the increased cell metabolism (i.e., DNA replication) and serve as an indicator for cancerous cells. However, there is little signal detected in the nucleus area in our FF-OCT. The main reason is that the genetic materials in the nucleus are loosely arranged in the forms of DNA (2 nm), nucleosome (10 nm),25,26 and chromatin fiber (30 nm) during most of the time (cell cycle). Therefore, the typical dimensions of the genetic materials in the nucleus are too far off from the incident wavelength centered at 560 nm. The scattering coefficient is too low for our FF-OCT system to detect. Only when the -shaped chromosomes (about 1400 nm) are formed during a very short period of mitosis, could these genetic materials generate backscatter signals strong enough to be detected. As a result, our scanning result usually does not detect the genetic material in the nucleus but can detect the signals backscattered from the organelles in the cytoplasm. Sometimes, the volumetric OCT signals are relatively noisy. Although we used a 3-D bilateral filter to remove noise and refine the signal, an unexpected small noise dot remained inside the volumetric data, impairing the boundary detection in step C and resulting in incorrect labeling in step D [Fig. 8(a)]. However, if another seed is randomly selected (in step B) and regenerates a rayburst kernel (in step C), the noise interference might be prevented to obtain the correct boundary point (in step C) and labeling result [in step D; Fig. 8(b)]. Fig. 8Seed selection schematic diagram. (a) Due to the noise interference (represented by blue square), seed detected the wrong boundary point in step C. (b) Randomly select another seed , then repeat step C to detect boundary points by rayburst sampling. After avoid noise signal, the framework obtain the correct boundary point of nucleus boundary. 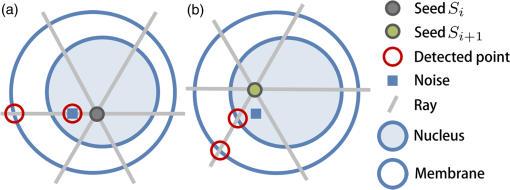 2.4.Step D: LabelingIn this step, the nuclear membrane and cell membrane point cloud sets separate the volumetric data into three parts: the nucleus, the cytoplasm, and the area outside the cell. In other words, each voxel can be in any one of these three areas in 3-D space. Our goal is to determine the voxels’ 3-D space distribution. Figure 9 shows a schematic diagram of the labeling process. The denotes the ’th seed in the volume generated randomly in step B. The coordinates of any voxel inside volume are denoted as . The line segment between points and is denoted as and its distance as . The ray starting from , passing through , and extending to the boundary of the volume is denoted as . Fig. 9(a) Schematic of the labeling process. Green: nuclear membrane; light green: cell membrane. (b) Schematic diagram after removing the nuclear membrane and cell membrane. The gray cone shows the decision range for a voxel. (c) Pink dot: seed; red dot: detected nuclear membrane boundary point in step C; blue dot: detected cell membrane boundary point in step C; gray cube: any voxel in 3-D space. (d) The schematic in the 2-D view.  In Fig. 9(a), let the be the observation center and use a spherical coordinate system to construct a cone with a solid angle . The resultant cone covers a part of the inner and outer point cloud sets. As shown in Fig. 9(d), the red dot represents the inner point cloud, denoted as , , whereas the blue dot represents the outer point cloud, denoted as , . The distance between and is , and the distance between and is . The distance between and is , whereas the distance between and is . To determine the role type of every voxel (gray cube in Fig. 9), the boundary points around and inside the cone are considered, using a solid angle as a reference. A parameter is set as the number of required minimum boundary points. The gray cone with solid angle in Fig. 9(a) covers several inner boundary points and outer boundary points . If the number of boundary points is less than , then is increased gradually, until the number of boundary points covered by the cone is greater than or equal to . If the number of boundary points is greater than , then the boundary points are sorted in ascending order on the basis of , and select the top boundary points. Then, calculate all and values and denote as and , respectively. The distance between seed and any one voxel is . Three scenarios can occur
After a repeat voxel-by-voxel calculation, the role type of every voxel inside volume , denoted as , , is obtained. Each voxel in is noted as a number (0, 1, 2). With each voxel from a volume labeled with one of three role types and denoted as an integer number (0, 1, 2), one labeled volume is obtained from the seed . Repeating the same sequence yields -labeled volumes obtained from seeds . Because these results of are not always identical, expressing the segmentation results as a probability is a suitable approach. The volume is averaged, and is obtained. The role type of each voxel is not denoted as an integer , but as a rational number . For example, the role type of a voxel may be not 100% in the nucleus or cytoplasm but 20% in the nucleus and 80% in the cytoplasm. Thus, the probability representation is a suitable approach. We divide this real number range into three intervals:
Figure 10 shows the concept of the probability density and its use for separating three parts from a single cell. Figure 11 shows en face segmentation results with legend for a keratinocyte at different depths (-axis) from left to right and top to bottom. Table 1 summarizes all the parameters used in the RRBS framework. Fig. 10(a) Probability density of the three areas of a single cell. At the junction of every two areas, the SD (blue line) increased, reflecting the boundary. (b) Original en face image. (c) The same en face image from (b) after applying the 3-D bilateral filter. (d) The nucleus and cytoplasm with legend, where the red region represents the nucleus and the blue region represents the cytoplasm. (e) The SD diagram, where the white area represents high SD and the black area indicates that the SD is equal or close to zero. The scale bar is in the lateral plane. 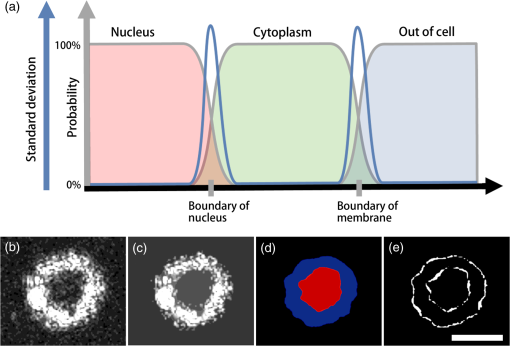 Fig. 11Segmentation results for single keratinocyte at different depths (-axis) with legend, from left to right and top to bottom. The depth between every two slices in the axial direction is and the scale bar is in the lateral plane. 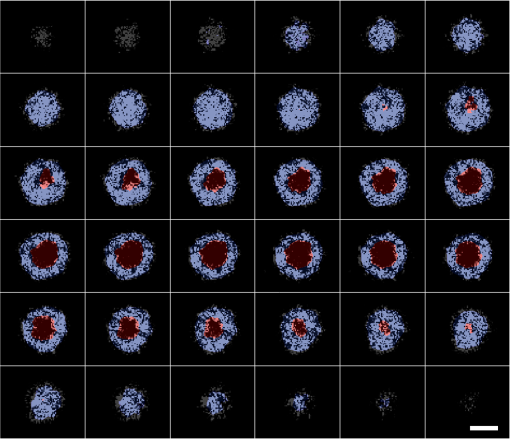 Table 1Symbol list, summarizes all the parameters used in the RRBS framework.
2.5.Feature ExtractionAfter execution of the RRBS framework, the exact 3-D space distribution of the nucleus and cytoplasm of a single cell is calculated and located. The volume size of the nucleus () and the cytoplasm () and the volumetric N/C ratio can be calculated easily by using the following equations: Other features that can be extracted from the signal intensity and 3-D morphology include the average, standard deviation (SD), maximum and minimum kurtosis, skewness, and dynamic range of the nucleus and cytoplasm. By using the RRBS framework, volumetric data can generate more quantized information for cell classification or other statistical analyses. 2.6.Appropriate ParametersIn the RRBS framework, the parameters to be set manually are , , , , , and . The threshold in step C, , is automatically set by averaging the voxel intensity of all seeds . Other default parameters are and . A user must adjust the parameters , , and according to Eqs. (2) and (4). After parameter adjustment, the parameters of the 3-D Gaussian and bilateral filters used in step A can be used with different samples, measured under the same conditions. The value of the parameter in step B only slightly affects the segmentation results. The value affects the position of seeds because determines the voxel present inside the nucleus. The positions of seeds are randomly selected and the final segmentation result in step D relies on numerous qualified seeds ; a group of seeds, but not a single seed, can determine the segmentation results. The parameter in step C is generated automatically by averaging the voxel intensity of all seeds . Finally, the remains to be determined. We performed a series of verification tests to evaluate the most favorable : randomly selected qualified seeds () first, then changed only the value of , executed the RRBS framework, and calculated the volumetric N/C ratio. As shown in Fig. 13(a), when to 32, the relative standard deviation (%RSD) of the volumetric N/C ratio tended to be in the stable phase. When executing the RRBS framework, 10 qualified seeds were randomly selected. The volumetric N/C ratio was calculated after segmentation. As shown in Fig. 13(b), when to 21, the %RSD of the volumetric N/C ratio tended to be in the stable phase. Based on Figs. 13(a) and 13(b), when we randomly selected another qualified seed and executed the RRBS framework, the %RSD of the N/C ratio between different randomly selected seed sets was 2%. The same parameters can be used for another sample, scanned using the same instrument under the same measurement conditions. Since the RRBS framework is automatic in seed selection, even a novice can use the RRBS framework easily and obtain the results as shown in Fig. 12(a). Fig. 12Segmentation results of the keratinocyte (volumetric N/C ): (a) boundaries of the nucleus and cell membrane, (b) membrane boundary, and (c) nuclear boundary.  Fig. 13Validation of the RRBS framework. (a) The appropriate iteration number of the bilateral filter was evaluated and determined to be 8 to 32. In this range, the plot of the relative SD (%RSD) is flat. (b) The %RSD of the N/C ratio between different randomly selected seed sets was 2%, as the iteration number of the bilateral filter increased. (c) The %RSD of the N/C ratio decreased as the number of seeds increased.  3.Results3.1.ImplementationThe present framework is developed through LabVIEW and CUDA parallel computing. Parallel computing has been applied to many fields and excellent results have been obtained.27,28 Computations were conducted on a laptop with the Intel i7-3720QM CPU (6M Cache, 2.6 GHz), an 8-GB RAM, and an NVIDIA NVS 5200M graphics card. The total processing time per volume was 4 min, and the performance bottleneck was in step D. We applied parallel computing techniques using CUDA and the NVIDIA graphics card to the 3-D Gaussian and bilateral filters in step A and the labeling procedure in step D. For the 3-D Gaussian and bilateral filters, computing using a graphic processing unit, it was 98 times faster than that of using a CPU; however, for the labeling procedure, it was only up to 7.2 times faster. After RRBS framework processes, the volumetric data were transferred from to , and we used Voreen29 to render with 1-D transfer function. No particular adjustment is required for the transfer function when rendering the boundaries of the nuclear membrane and cell membrane, except for changing the color or thickness of boundaries. The volume rendering results are shown in Fig. 12. 3.2.ValidationIn this study, we scanned a keratinocyte (Fig. 12), and en face images at different depths in the -axis are shown in Fig. 2. From the FF-OCT and RRBS framework results, the volumetric N/C ratio of the keratinocytes is 0.211. 3.2.1.Effect of the iteration number of the bilateral filterAlthough using digital filters (Gaussian filter and bilateral filter) can suppress high-frequency noise, the trade-off is the reduced spatial resolution. The 3-D bilateral filter is a digital filter that reduces noise and maintains the edge. As shown in Eq. (3), the parameter of the bilateral filter is and , where is same as in Eq. (1). Based on the actual sample situation, spatial frequency of nucleus, and noise level, we calculated the appropriate and according to Eqs. (2) and (4). To reduce noises, the appropriate iteration number for bilateral filter is necessary. As Figs. 13(a) and 13(b) show, when the iteration number of the 3-D bilateral filter increased, the %RSD of volumetric N/C ratio tended to converge to a stable value. However, with increasing , the volumetric N/C ratio began changing. We believe that when stable %RSD of the volumetric N/C ratio was reached, was optimized. 3.2.2.Effect of seed selectionThe RRBS framework involves randomly selecting seeds, generating a rayburst kernel depending on these seeds as the center, detecting boundary points, and labeling each voxel. Finally, the probability density is obtained as the segmentation result. On the basis of the labeling result, we can calculate the volumetric N/C ratio. As shown in Fig. 13(b), the %RSD of different randomly selected seed sets was only 2%. As the number of the 3-D bilateral filter iteration increases, the calculated %RSD of the volumetric N/C ratio from different seed sets reduces. Therefore, the segmentation result is independent of the randomly selected seed set. When we randomly selected another seed set, its effect on the volumetric N/C ratio was very small. 3.2.3.Effect of seed numberA major strength of the RRBS framework is the randomly selected seeds and their use as centers to create rayburst kernels. Figure 13(c) shows that as the number of seeds increased from 2 to 20, , the %RSD of different randomly selected seed sets decreased. The appropriate number of seeds is greater or equal to 10. As shown in Fig. 13(c), when , the %RSD was about 2%; when , the %RSD remains at a stable level of 1.25%. Thus, the %RSD decreases as increases. If , then the %RSD is about 1%. This result suggested when the seed number is greater or equal to 10, it no longer affects the segmentation results. 3.2.4.N/C ratio estimation: comparison of 2-D and 3-D scanningIn 3-D tomography scanning, we can calculate the volumetric N/C ratio of a single cell through the RRBS framework. However, if we have only 2-D images of the cells, we can calculate only the volumetric N/C ratio from a group of cells, but not a single cell. Figure 12 shows that the volumetric N/C ratio of a keratinocyte is 0.211. This volumetric N/C ratio calculated from a single cell was scanned through FF-OCT. To obtain the accurate results using 2-D images of keratinocytes, we randomly generated a tangent plane passing through the cells from Fig. 12(a) and summarized the total area of the nucleus and cytoplasm from each tangent plane to calculate the volumetric N/C ratio from the tangent plane. The simulated volumetric N/C ratio calculated from 2-D images is shown in Fig. 14. To obtain an accurate (error percentage ) N/C ratio from a 2-D image, more than 30 exactly identical cells must be present in the 2-D plane field of view. To obtain a precise () N/C ratio from a 2-D image, more than 500 exactly identical cells must be present in the 2-D plane field of view. During the measurement of actual biological samples, it is cumbersome to perform numerical image analysis of more than 500 tangent plane images of cells. Fig. 14Simulated volumetric N/C ratio, calculated using 2-D images. The deep blue line and light blue band represent the volumetric N/C ratio distribution as the number of tangent planes changes. The purple line represents the %RSD of the N/C ratio. The orange line represents the error percentage of the N/C ratio. 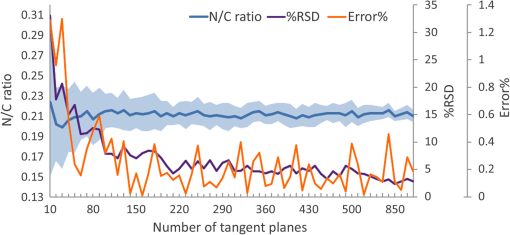 4.ConclusionWe present a reliable RRBS framework for extracting and reconstructing boundaries of the nucleus and cell by using volumetric data acquired by FF-OCT. The RRBS framework, when compared with 1-D or 2-D transfer functions, is relatively easy to employ and produces more reliable segmentation results. The transfer functions are more complex when applied to detect the nucleus and cell boundaries of a single cell from volumetric data. Furthermore, RRBS yields a consistent result. The %RSD from different seed sets was as low as 2%. With RRBS, the nucleus and cytoplasm of a single cell would be segmented in an efficient and automatic manner. A plethora of parameters—the volume size of the nucleus and cytoplasm, the areas of the nuclear and cell membranes, and the volumetric N/C ratio—could be extracted from 3-D single-cell tomogram by RRBS analysis. These quantitative parameters provide valuable tools to study the physiological or pathological status of a single cell. Based on the features extracted by RRBS, a computer algorithm could be designed to differentiate disease (cancer) cells from normal cells. This would broaden the application of 3-D single-cell morphology in the biomedical field. AcknowledgmentsThis study was partially supported by the National Science Council, Taiwan under the Grant No. NSC 101-3113-P-002-024. ReferencesD. Huang et al.,
“Optical coherence tomography,”
Science, 254
(5035), 1178
–1181
(1991). http://dx.doi.org/10.1126/science.1957169 Google Scholar
B. Povazay et al.,
“Submicrometer axial resolution optical coherence tomography,”
Opt. Lett., 27
(20), 1800
–1802
(2002). http://dx.doi.org/10.1364/OL.27.001800 Google Scholar
P. Memmolo et al.,
“3D morphometry of red blood cells by digital holography,”
Cytometry Part A, 85
(12), 1030
–1036
(2014). http://dx.doi.org/10.1002/cyto.a.v85.12 Google Scholar
Y.-H. Liao et al.,
“Determination of chronological aging parameters in epidermal keratinocytes by in vivo harmonic generation microscopy,”
Biomed. Opt. Express, 4
(1), 77
–88
(2013). http://dx.doi.org/10.1364/BOE.4.000077 Google Scholar
N.-C. Cheng et al.,
“Cell death detection by quantitative three-dimensional single-cell tomography,”
Biomed. Opt. Express, 3
(9), 2111
–2120
(2012). http://dx.doi.org/10.1364/BOE.3.002111 Google Scholar
A. J. Creager et al.,
“Cytologic features of clear cell sarcoma (malignant melanoma) of soft parts: a study of fine-needle aspirates and exfoliative specimens,”
Am. J. Clin. Pathol., 117
(2), 217
–224
(2002). http://dx.doi.org/10.1309/D17Q-2MWA-HVNX-H7RD Google Scholar
V. Kumar, A. K. Abbas and J. C. Aster, Robbins Basic Pathology, Elsevier Saunders(2013). Google Scholar
J. M. Okamura et al.,
“Benign atypical junctional melanocytic hyperplasia associated with intradermal nevi: a common finding that may be confused with melanoma in situ,”
Mod. Pathol., 13
(8), 857
–860
(2000). http://dx.doi.org/10.1038/modpathol.3880152 Google Scholar
A. Dubois et al.,
“Three-dimensional cellular-level imaging using full-field optical coherence tomography,”
Phys. Med. Biol., 49
(7), 1227
–1234
(2004). http://dx.doi.org/10.1088/0031-9155/49/7/010 Google Scholar
A. Dubois et al.,
“Ultrahigh-resolution full-field optical coherence tomography,”
Appl. Opt., 43
(14), 2874
–2883
(2004). http://dx.doi.org/10.1364/AO.43.002874 Google Scholar
M. Akiba et al.,
“Full-field optical coherence tomography by two-dimensional heterodyne detection with a pair of CCD cameras,”
Opt. Lett., 28
(10), 816
–818
(2003). http://dx.doi.org/10.1364/OL.28.000816 Google Scholar
C.-C. Tsai et al.,
“Mirau-based full-field time-domain optical coherence tomography using crystal fiber light source,”
Proc. SPIE, 8802 880209
(2013). http://dx.doi.org/10.1117/12.2032478 Google Scholar
C.-C. Tsai et al.,
“Full-depth epidermis tomography using a Mirau-based full-field optical coherence tomography,”
Biomed. Opt. Express, 5
(9), 3001
–3010
(2014). http://dx.doi.org/10.1364/BOE.5.003001 Google Scholar
B. Hajj et al.,
“Whole-cell, multicolor superresolution imaging using volumetric multifocus microscopy,”
Proc. Nat. Acad. Sci. U. S. A., 111
(49), 17480
–17485
(2014). http://dx.doi.org/10.1073/pnas.1412396111 Google Scholar
C.-C. Tsai et al.,
“ double-clad crystal-fiber-based optical coherence tomography on fish cornea,”
Opt. Lett., 35
(6), 811
–813
(2010). http://dx.doi.org/10.1364/OL.35.000811 Google Scholar
R. A. Drebin et al.,
“Volume rendering,”
in Proc. of the 15th Annual Conf. on Computer Graphics and Interactive Techniques,
65
–74
(1988). http://dx.doi.org/10.1145/54852.378484 Google Scholar
J. Kniss et al.,
“Interactive volume rendering using multi-dimensional transfer functions and direct manipulation widgets,”
in Proc. of the Conf. on Visualization ‘01,
255
–262
(2001). http://dx.doi.org/10.1109/VISUAL.2001.964519 Google Scholar
J. Kniss et al.,
“Multidimensional transfer functions for interactive volume rendering,”
IEEE Trans. Vis. Comput. Graph., 8
(3), 270
–285
(2002). http://dx.doi.org/10.1109/TVCG.2002.1021579 Google Scholar
A. Rodriguez et al.,
“Rayburst sampling, an algorithm for automated three-dimensional shape analysis from laser scanning microscopy images,”
Nat. Protocols, 1
(4), 2152
–2161
(2006). http://dx.doi.org/10.1038/nprot.2006.313 Google Scholar
C. Tomasi et al.,
“Bilateral filtering for gray and color images,”
in Sixth Int. Conf. on Computer Vision,
839
–846
(1998). http://dx.doi.org/10.1109/ICCV.1998.710815 Google Scholar
T. Tsuji et al.,
“Ultrastructural studies of nuclei and nucleoli in psoriatic epidermis compared to those in normal epidermis,”
J. Invest. Dermatol., 69
(2), 205
–210
(1977). http://dx.doi.org/10.1111/1523-1747.ep12506307 Google Scholar
J. Maszewski et al.,
“Number, size, and transcriptional activity of nucleoli during different periods of interphase in antheridial filaments of Chara vulgaris L.,”
Folia Histochem. Cytobiol., 22
(1), 9
–19
(1984). Google Scholar
H. E. Grossniklaus et al.,
“Histopathology, morphometry, and nuclear DNA content of iris melanocytic lesions,”
Invest. Ophthalmol. Vis. Sci., 36
(3), 745
–750
(1995). Google Scholar
M. Derenzini et al.,
“Nucleolar function and size in cancer cells,”
Am. J. Pathol., 152
(5), 1291
–1297
(1998). Google Scholar
R. D. Kornberg,
“Chromatin structure: a repeating unit of histones and DNA,”
Science, 184
(4139), 868
–871
(1974). http://dx.doi.org/10.1126/science.184.4139.868 Google Scholar
K. Luger et al.,
“Crystal structure of the nucleosome core particle at 2.8 Å resolution,”
Nature, 389
(6648), 251
–260
(1997). http://dx.doi.org/10.1038/38444 Google Scholar
E. B. Lum et al.,
“Hardware-accelerated parallel non-photorealistic volume rendering,”
67
–ff
(2002). http://dx.doi.org/10.1145/508530.508542 Google Scholar
J. A. Stuart et al.,
“Multi-GPU volume rendering using MapReduce,”
in Proc. of the 19th ACM Int. Symp. on High Performance Distributed Computing,
841
–848
(2010). http://dx.doi.org/10.1145/1851476.1851597 Google Scholar
J. Meyer-Spradow et al.,
“Voreen: a rapid-prototyping environment for ray-casting-based volume visualizations,”
IEEE Comput. Graph. Appl., 29
(6), 6
–13
(2009). http://dx.doi.org/10.1109/MCG.2009.130 Google Scholar
BiographyChia-Kai Chang is a PhD candidate at the Graduate Institute of Photonics and Optoelectronics, National Taiwan University. He received his BS and MS degrees from National Sun Yat-Sen University in 2001 and 2003, respectively. His current research interests are digital image processing and optical coherence tomography. Chien-Chung Tsai received his MS degree from the Institute of Biophotonics, National Yang-Ming University in 2005 and his PhD from the Graduate Institute of Photonics and Optoelectronics, National Taiwan University in 2010. His research interests include optical coherent tomography and biomedical imaging. Wan-Yi Hsu received her BS degree from the Department of Mechanical Engineering, National Central University in 2012 and her MS degree from the Graduate Institute of Photonics and Optoelectronics, National Taiwan University in 2014. Her research interests include optical coherent tomography and biomedical imaging. Jau-Shiuh Chen received his MD degree from the National Taiwan University. He is an attending physician in the Department of Dermatology, National Taiwan University Hospital. He specializes in dermatologic surgery and laser medicine. His current research interest is biomedical imaging. Yi-Hua Liao received her MD and PhD degrees from the National Taiwan University in 1996 and 2007, respectively. He is an associate professor in the Department of Dermatology, College of Medicine, National Taiwan University. Her research interests are cancer biology and biomedical optics. Yi-Shuan Sheen received her MD and MS degrees from Kaohsiung Medical University and National Taiwan University, respectively. She is a lecturer in the Department of Dermatology, College of Medicine, National Taiwan University. Her research interests include cancer biology and biomedical imaging. Jin-Bon Hong received his MD degree from the National Taiwan University in 2005. He is a lecturer in the Department of Dermatology, College of Medicine, National Taiwan University. His research interests are medical genetics and high-throughput screening. Ming-Yi Lin received her BS degree from the National Chung Hsing University in 1999. She is a research assistant in the Department of Dermatology, College of Medicine, National Taiwan University. Her current research interests are molecular biology and biomedical imaging. Jeng-Wei Tjiu received his MD, PhD, and MBA degrees from the National Taiwan University in 2000, 2008, and 2014, respectively. He is a clinical assistant professor in the Department of Dermatology, College of Medicine, National Taiwan University. His current research interest is biomedical imaging. Sheng-Lung Huang received his BS degree from the Department of Electrical Engineering, National Taiwan University in 1986 and his MS and PhD degrees from the Department of Electrical Engineering, University of Maryland, College Park in 1990 and 1993, respectively. He joined the Graduate Institute of Photonics and Optoelectronics (GIPO) and Department of Electrical Engineering, National Taiwan University in 2006, and served as the Chairman of GIPO from 2007–2010. |

