
|
|
1.IntroductionOptical coherence tomography (OCT), as a noninvasive diagnostic tool, has been widely used in dermatological research and for clinical skin diagnoses for decades now.1–5 In addition to examining skin morphology, important advances have been made toward the imaging of functional structures, such as the vascular networks, within a tissue depth of . Such developments have been achieved using a process known as optical coherence tomography angiography (OCTA). OCTA utilizes an endogenous contrast mechanism that originates from the fluctuations of blood flow signals to differentiate a vascular network from its encapsulating static tissue bed.6–9 To extract the signal fluctuations, B-scans are typically repeated at one cross-sectional position to create a cluster of comparable B-frames.6,10 Signals coming from static tissue within such B-frames show little interframe variance, while those from blood vessels experience severe fluctuations due to the continuous flow of blood cells. To aid in visualization, three-dimensional (3-D) vascular images are commonly constructed from a series of blood flow cross sections by raster scanning across the slow transverse direction. En face view vasculatures can be visualized through the mean intensity or maximum intensity projection of blood flow signals at a given depth. Practically speaking, the process of 3-D OCTA imaging of human skin in situ is very susceptible to motion-derived artifacts stemming from various sources, such as respiratory or cardiac activities, involuntary contracting by the subject, and unintentional movements of the handheld probes during dermatological scanning. From previous reports,11–14 motion-derived artifacts resulted in the exclusion of sizable volumes of data from analyses. Even relatively minor movements, such as those attributed to the heartbeat, microtremors in the skin, or motions due to breathing, can increase background noise, predominantly resulting in the appearance of line artifacts in the en face projection. Fortunately, coregistering the B-frame clusters, i.e., repeated B-scans at the same spatial location, before applying angiography algorithms can help with the reduction of such artifacts. Within individual B-frames, the current OCT speeds, typically with an A-line rate of and a B-frame rate of , usually limit the level of artifacts seen from severe movements, e.g., inadvertent sliding of the probe. However, the same cannot be said for consecutive frames because the time between adjacent frames is relatively long. Reported efforts on compensating for motion-derived artifacts in OCTA can be summed up within two categories: the hardware approach and the software approach. Hardware techniques adopting high scan rates, e.g., megahertz OCT,15 are proposed to reduce the acquisition time during in vivo skin imaging, and consequently the probability of motion involvement is lessened. In commercialized ophthalmology OCTA systems,16 for example, scanning laser ophthalmoscopy17,18 is a prevalent strategy used for detecting rapid/large motions and guiding appropriate rescans with specified overlapping to counter them. Adopting such a technique for imaging of the skin, however, would prove fruitless, mainly because unlike retinal imaging, human skin has much higher scattering properties compared to the relatively transparent ocular tissue. Furthermore, the increased complexity and cost associated with acquiring and developing additional devices may reduce its competitiveness in the application of the technology in dermatology. An alternative solution is software-aided postprocessing through image registration,19 in which two or more datasets are usually aligned and merged into one so that artifacts can be replaced by their spatial counterparts where there is no apparent artifact. Using this concept, Kraus et al.20 corrected for motion-induced distortion by retrospectively coregistering orthogonally acquired volumetric scans. Although initially encouraging, this approach required considerable computational power to register just two datasets. Another approach attempted by Antony et al.21 successfully extracted tissue features from OCT structure images based on surface segmentation, and accordingly, they designed geometric transformations to correct the transverse distortions in 3-D. A fiducial marker specifically designed for human skin imaging has also been utilized to achieve 3-D motion correction on an individual B-frame basis.22 Although this method did establish good image correspondence, the feature-based OCT structure registration finds it difficult to satisfy the accuracy requirement for microscale angiography. Moreover, if directly applying the feature-based method to register blood flow signals, one usually has difficulties in assessing the essential features of OCT angiograms, such as extreme curvatures and/or contours. The fiducial marker adhesively bonded to the skin may also cause an allergic response or inflammation that not only leads to future reluctance from the patients to rescan but also interferes with dermatopathological evaluations. An interesting study carried out by Hendargo et al.23 first presented an automatic nonrigid registration for use in OCTA by directly manipulating the orthogonal en face retinal vasculatures. Additionally, Zang et al.24 further demonstrated the practicability of nonrigid registration by minimizing stitching artifacts when montaging en face vascular images from equidirectional scanned volumes. Here, we present a fully automated motion compensation method that employs both rigid transformation and nonrigid free-form deformation to correct motion-derived artifacts that frequently occur in in vivo human skin OCTA imaging. Although orthogonal transverse scans are widely used in ophthalmology research, the restricted uniform sampling therein becomes inappropriate when imaging irregular tissue characteristics, e.g., an incision in the skin. Therefore, a nonorthogonal dual-volume scanning procedure was utilized within our protocol. A rigid affine transformation was first applied to the reticular vasculature of the skin, which primarily consists of deep, large vessels. The generated affine parameters were then applied to the whole vessel network with additional translation adjustment through rigid subpixel compensation. In addition, a B-spline free-form deformation was used to calibrate localized misalignment due to nonrigid distortions and accurately register the dual vasculatures into one artifact-free composition. The whole registration process was feedback controlled by vascular image quality evaluations. The overall performance of the motion compensation algorithm, in terms of correlation coefficient (CC) and peak signal-to-noise ratios (PSNR) of the registered vasculatures, was evaluated and compared to that prior to processing. Our intention is to provide a technique that will offer greater opportunities for a number of clinical outcomes, such as the improved early diagnosis of skin abnormalities or the automatic quantification of dermatosis severity, for example. 2.Methods2.1.Imaging System and Data AcquisitionTo scan human skin, we employed an in-house-built swept source OCT (SS-OCT) system. The in vivo imaging study that uses home-built systems to image human subjects was reviewed and approved by the Institutional Review Board of University of Washington, and informed consent was obtained in writing from all subjects before imaging. This study followed the tenets of the Declaration of Helsinki and was conducted in compliance with the Health Insurance Portability and Accountability Act. Briefly in the SS-OCT, a 100-kHz vertical-cavity surface-emitting swept laser source (SL1310V1-10048, Thorlabs Inc., Newton, New Jersey) was used as the light source providing a central wavelength of 1300 nm and a spectral bandwidth of 68 nm. Light from the laser was first split into sample and reference arms through a coupler. In the sample arm, a objective lens (LSM03, Thorlabs Inc.) focused a beam spot into the skin with an incident power of 5 mW. The beam spot was scanned by a paired galvo scanner, forming raster sampling patterns that consisted of a series of fast (-axis) and slow (-axis) scans. The sample arm was configured as a handheld probe affixed with a sample spacer (central hole ) to keep a consistent distance between the objective lens and the skin. The interference signal was detected by a 1.6-GHz photodetector (PDB480C-AC, Thorlabs Inc.) and sampled by a 12-bit digitizer (ATS9350, Alazartech) at . The resulting axial resolution was measured to be in air, and the transverse resolution was measured to be at the focus. The system sensitivity was measured at 105 dB. Dual-volume datasets were sequentially acquired through a specifically designed C-scan protocol, as shown in Fig. 1(a), in which each volume consisted of a total of 2500 B-scans with five repetitions at one spatial location, leading to 500 B-scan positions. The C-scans were acquired over two volumes, in each, with a constant sampling voxel size of . The total acquisition time for two volumes was . Fig. 1C-scan protocol and resultant cross sections: (a) dual-volume OMAG scanning protocol, (b) a typical cross-sectional structure image, and (c) corresponding blood flow image.  Before registering the volume datasets, the acquired frames were preprocessed through the following steps. First, we coregistered the repeated B-scan frames through a subpixel image registration algorithm25 to minimize any small or slow motions. Thereafter, an optical microangiography (OMAG) algorithm7 was applied to extract dynamic blood flow information from the static tissue background. A typical cross-sectional structure image and its corresponding blood flow are presented in Figs. 1(b) and 1(c), respectively. Second, an automatic segmentation approach was adopted from Yin et al.26 to differentiate the papillary dermis layer, filled with an abundant superficial plexus, and the reticular dermis layer, which is dominated by larger arterioles or venules, as shown in Figs. 2(a), 2(d), and 2(g), respectively. Furthermore, the en face vasculatures were separated into two images according to the scanning protocol, as shown in Figs. 2(b) and 2(c), 2(e) and 2(f), or 2(h) and 2(i). Severe motion-derived artifacts are visualized in Fig. 2 as vertical lines marked by red arrows. Fig. 2En face skin vasculatures from different depths. (a) Motion affected en face arm skin vasculature obtained by two repeated C-scans with (b) and (c) representing single-volume datasets. (d) Dual-scanned en face skin vasculature of papillary layer with (e) and (f) representing single-volume datasets. (g) Dual-scanned en face skin vasculature of reticular layer with (h) and (i) representing single-volume datasets. Red arrows indicate severe motion-derived artifacts. 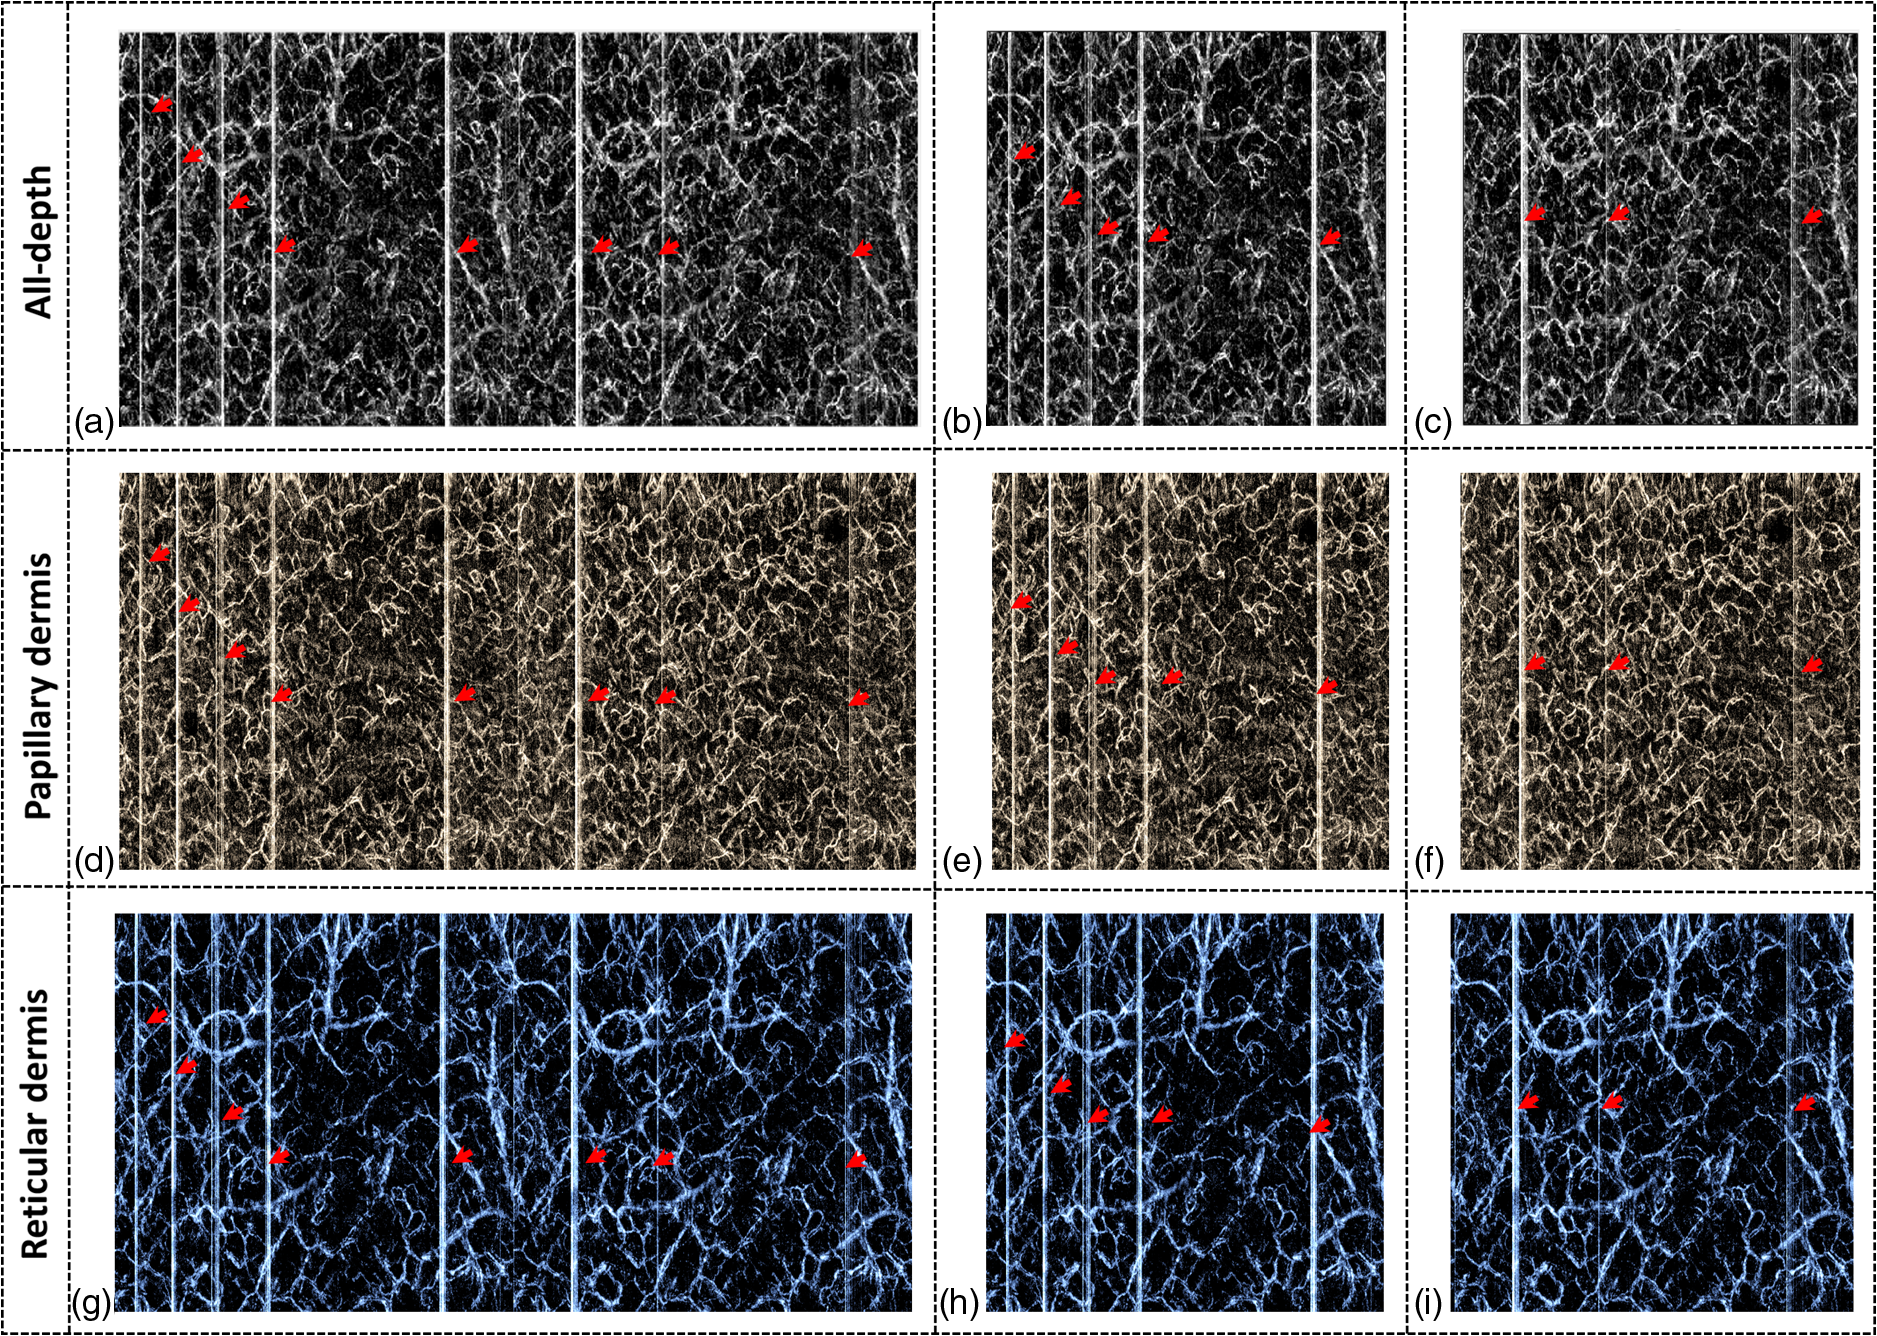 2.2.Image Registration MethodDuring image registration, two different approaches were utilized sequentially based upon the vascular network within the dual-volume datasets: a general registration that was mainly achieved by rigid affine registration plus rigid subpixel motion compensation and a precise registration that was mainly realized through nonrigid B-spline free-form deformation, as shown in Fig. 3 (dashed boxes). This section will outline in detail the step-by-step motion compensation procedure applied for human skin OCTA. The preregistration process introduced in Sec. 2.1 is summarized here as the elliptical blocks of Fig. 3. Fig. 3Flow chart outlining automatic motion compensation in skin OCTA. represents the papillary vasculature, represents the reticular vasculature, and represents the rescaling factor. Function of each process step is classified in the legend. 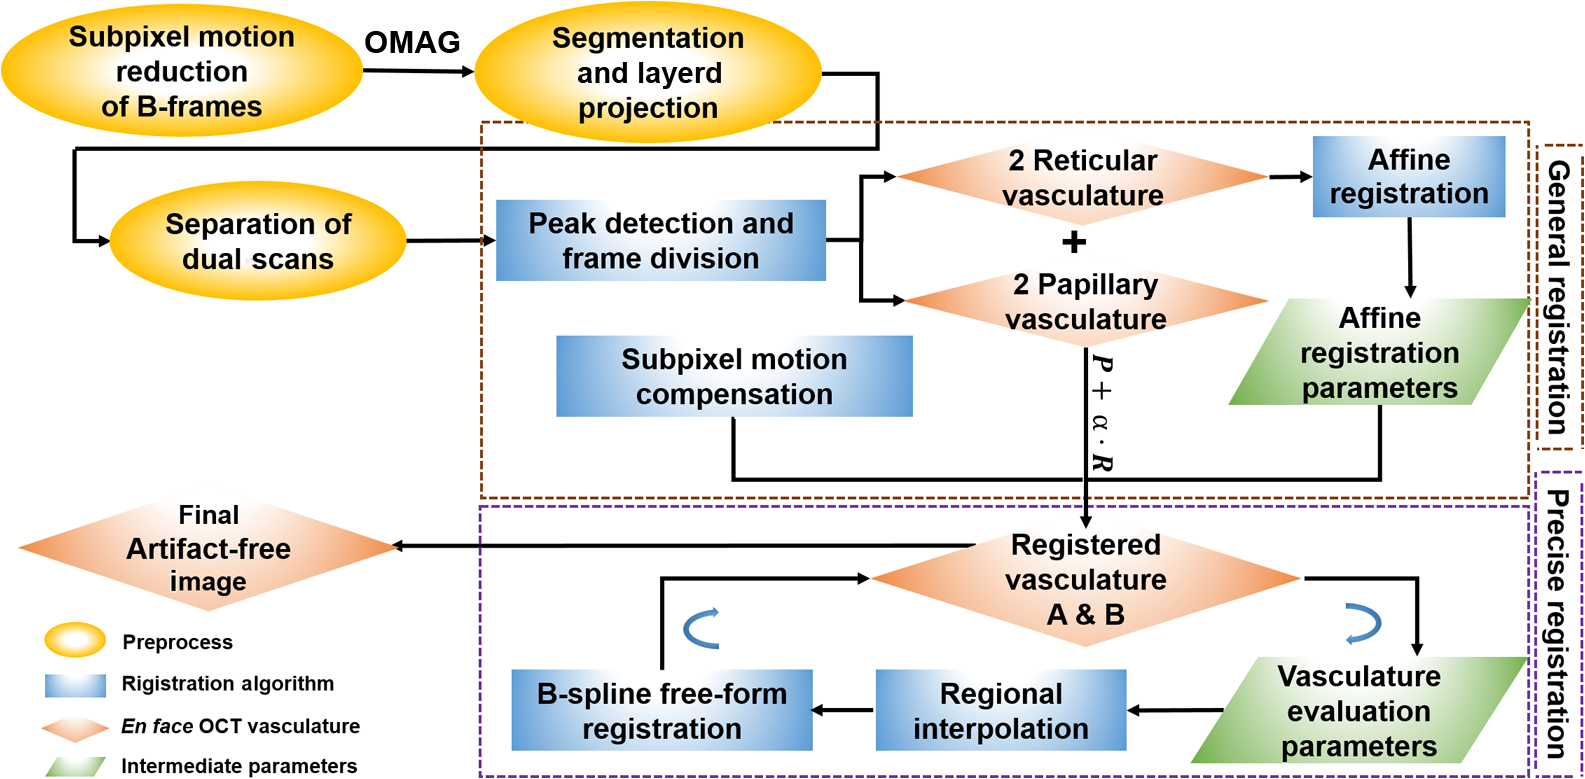 2.2.1.Peak detection-based frame divisionAfter separation of the dual scans, the en face vasculatures of both depths, the papillary layer and the reticular layer, were successfully acquired, but with severe motion-derived artifacts that appear as white lines. The locations of those artifacts were identified in the all-depth vasculatures by averaging pixel intensities along the -axis, as shown in the one-dimensional (1-D) projection curves in Figs. 4(a) and 4(b). Peak detection according to the peak prominence was used to identify which of the projected B-frames had suffered from motion-derived artifacts. The peak prominence was empirically selected as 0.3 times the maximum peak elevation above the mean intensity (mean refers to the average intensity of the whole image). The calculated peak widths were also utilized to indicate how many frames were affected by each motion, which were then accordingly removed. When two adjacent peaks were detected with overlapping widths, as shown in the dashed box of Fig. 4(a), they were automatically regarded as one peak to avoid confusion in the following frame division. Each vasculature was then divided at the location of the peaks, generating a sequence of frame groups that were free of artifact lines. Last, the peak detection results were extended to both the papillary layer and the reticular layer for registrations in the next step. This approach has several advantages over the previously published threshold-based motion detection,23,24 especially for human skin OCTA. As illustrated in Fig. 4(e), when local vascularity increases to a level beyond that of normal tissue, e.g., angiogenesis during wound healing, adopting a simple threshold technique could deliver inaccurate results by either mistakenly regarding a normal region as an artifact or by erroneously taking an artifact as true data. Moreover, the peak width also provided a better indicator for the occupied region of each specific motion-derived artifact compared with that using arbitrary thresholds. Fig. 4Peak detection-based frame division. (a) 1-D projection curve showing artifact peaks in vasculature with overlapping peak widths marked in a dashed box. (b) 1-D projection curve showing artifact peaks in vasculature . Detected peaks are marked with black dots. (c) Vasculature with artifact line removal and frame division. (d) Vasculature with artifact line removal and frame division. (e) An example showing the advantages of peak detection over threshold in detecting motion-derived artifacts. The threshold approach fails by regarding normal regions as artifacts (upper subgraph, threshold 1) or regarding artifact lines as normal (lower subgraph, threshold 2) due to regional signal variance. 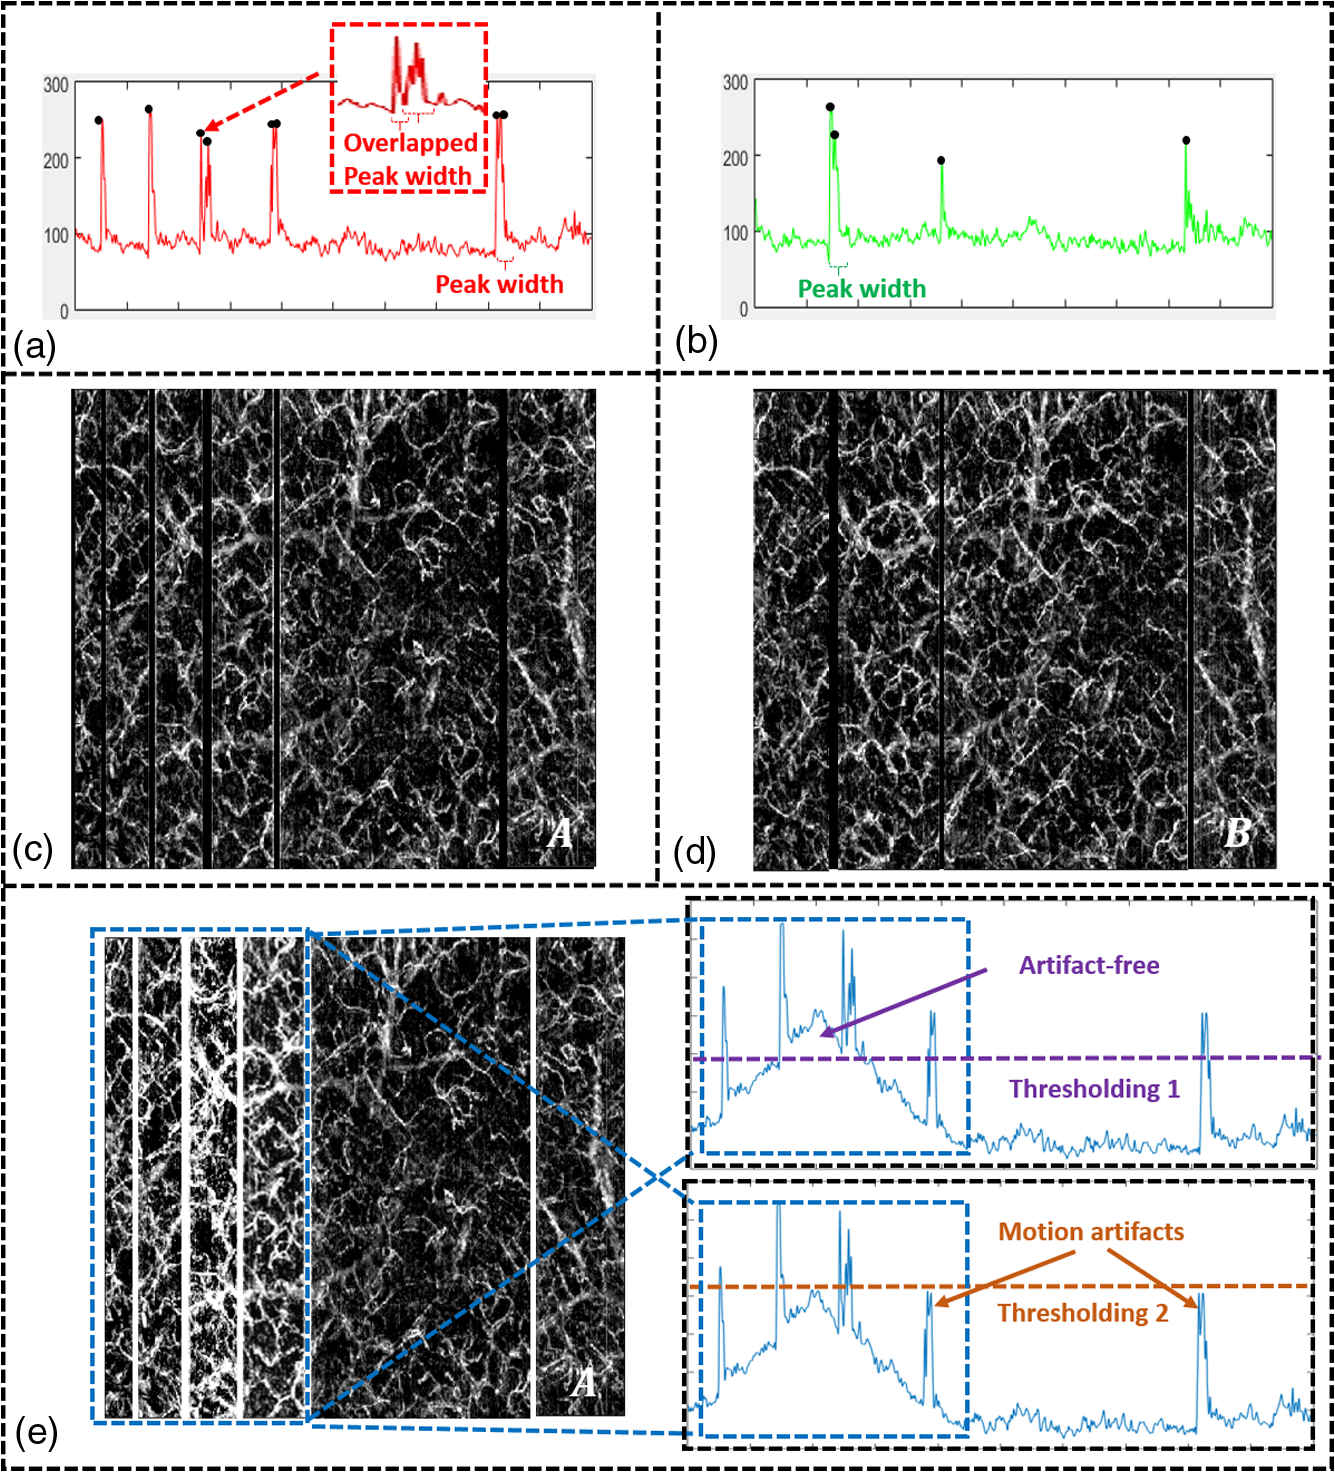 2.2.2.Sequential general registration of frame groupsThe divided groups of B-frames within both reticular layer volume scans were labeled in ascending order according to their original physical positions. Both reticular volumes were then sequentially coregistered into one through two-dimensional (2-D) affine transformation,27 as shown in Fig. 5(a). To represent the affine transformation with matrix operations, we adopted homogeneous coordinates in which 2-D coordinates along the - and -axes were represented by 3-D coordinates . Therefore, typical motion-induced distortions, such as shift, expand/contract, twist, or rotation, within the frame groups can be corrected through the combination of translation, scale, shear, or rotation transformations, as described in Figs. 5(b)–5(e), respectively. Fig. 5Affine registration of the reticular vasculature. (a) Schematic registration procedure of reticular vasculature. A_R represents the first reticular vasculature, B_R represents the second reticular vasculature, and Reg_R represents the affine registered reticular vasculature. (b) to (e) Affine transformation diagrams and matrix operations accounting for translation, scale, shear, and rotation, respectively. represents the reference vasculature as registration model and represents the moving vasculature to be registered.  The affine registration was evaluated by a gradient descent method, the limited memory Broyden–Fletcher–Goldfarb–Shanno (L-BFGS), which maximized the normalized mutual information between en face vasculatures of registered frame groups27,28 where represents the marginal entropy of static vasculature as the registration model, represents the marginal entropy of moving vasculature to be registered, and represents their joint entropy, as defined by Maes et al.29 The cost function reaches maximum when the two vasculatures are well aligned.During the affine registration of the reticular layer, affine parameters for each frame group were recorded and thereafter applied to the en face vasculatures of both depths, as expressed in Fig. 6(a). After each affine transformation, a rigid subpixel registration algorithm was added to compute the upsampled () cross correlation between the images to be registered and the reference static images by means of fast Fourier transform and correlation peak positioning; accordingly, subpixel shifts down to -pixel scale were compensated for. The computational burden for this subpixel compensation was acceptable when considering the sample size of for each vasculature. Notice that the all-depth vasculatures used here in general registration were rescaled as combinations of the papillary projection plus a visualization enhanced reticular projection, as shown in Fig. 6(b). The enhancement factor, , was empirically established as 2.0 to boost the weight of the large vessels in the registration in comparison to that of the small vessels. The generally registered vasculature composite, Gel_Reg, combining all the transformed frame groups, is shown in Fig. 6(c). Prior to precise registration, it was necessary to separately stitch the transformed frames (from vasculature or , respectively) into two vasculatures with the motion-derived artifact lines replaced by their counterparts in Gel_Reg. With that, two artifact-reduced images were obtained, denoted as Gel_Reg_A and Gel_Reg_B, as displayed in Fig. 6(c). Fig. 6Sequential general registration of the all-depth vasculature. (a) Transform equation to describe the application of affine parameters. (b) Intensity rescale of vasculature and . AD represents the all-depth vasculature, represents the papillary vasculature, represents the reticular vasculature, and represents the scale factor used to boost visualization of the reticular vasculature. (c) Schematic diagram of the general registration process. Gel_Reg represents the generally registered vasculature, Gel_Reg_A and Gel_Reg_B represent the generally registered vasculatures and with artifact lines replaced by counterparts in Gel_Reg.  2.2.3.B-spline free-form transformation for precise registrationFollowing sequential general registration, the two en face vasculatures were ready for coregistration. Skin is naturally highly susceptible to significant subject-dependent variations and microvasculature deformations. With that, such deformations cannot be described as parameterized transformations, and so, to compensate for this, we chose to apply a registration algorithm that uses nonrigid cubic B-spline free-form transformation.30–32 As shown in Fig. 7(a), a typical 1-D cubic B-spline is made up of four individual parts and in each, the curve can be expressed as a third-order polynomial function, as follows: The parameters, , , , and , vary from 0 (left) to 1 (right), and therefore, can be written as , , , , with representing the part length, i.e., the distance between adjacent control points located at , , 0, 32, and 64. This B-spline curve has two main properties: first, it is continuous at the connecting points between parts and at these points and has continuous first- and second-order derivatives. This characteristic provides superior smoothness for the B-spline curves and for any combinations or interpolations that are based on similar B-splines. For instance, in Fig. 7(b), the value at a given position (green arrow) can be interpolated by four neighboring B-splines curves, which are scaled by the corresponding control points (dashed arrows), as expressed by where represents the values of control points. Second, a single B-spline curve is nonzero only in a small region; for example, the B-spline in Fig. 7(a) has nonzero values only from to 64. This means that any changes based on B-spline are highly localized, so only limited surrounding points are influenced by a single control point, and the computational efficacy of B-spline-based interpolation is acceptable, even for a large number of control points. By comparing the dash curves in Figs. 7(b), , and 7(c), , the decreased value at control point 0 only leads to a decreased distribution around 0 without extending to regions under or beyond 64.Fig. 7Schematic explanation of cubic B-spline transformation. (a) A typical 1-D cubic B-spline with four pieces (piece length equals to 32) described by third-order polynomial functions , , , . (b) Schematic diagram of B-spline interpolation with a green arrow denoting where a value to be interpolated was scaled by the dashed arrows denoting four sounding control points. The transformed 1-D B-spline is visualized as a dash curve (). (c) Schematic diagram to show the localization of B-spline transformation with the sudden change of a control point at 0. The transformed 1-D B-spline is visualized as a dash curve (). (d) Schematic diagram of 2-D B-spline free-form deformation.  Further to that, 2-D B-splines can be simply derived from the products of two orthogonal 1-D B-splines and still possess the characteristics of smoothness and local controllability. Instead of using these weighted summations to interpolate pixel intensity, however, they could be used to characterize pixel displacement from the original position to the warped point; thereby, deforming the distribution of surrounding pixels through B-spline transformation. The transformation equation for each pixel can be described as a linear superposition of 2-D B-splines scaled by control points , which have two subscripts, and , indicating their positions within a grid of pixels in which , , , and are represented by transverse coordinates , as , , , . is a flooring operation toward the nearest integer. Consequently, the basic concept of 2-D B-spline registration comes down to designing a grid of control points with third-order basic splines, and using the combinations of those splines to adjust misaligned images. As schematically described in Fig. 7(d), the original image depicted by the black mesh grid can be deformed to the blue mesh grid, point by point, according to the transformation operator .After general registration, the vasculatures, Gel_Reg_A and Gel_Reg_B, were zero-padded all around with an extra 50 pixels (each vasculature reaching a sample size of ). Without loss of generality, Gel_Reg_B, being the moving image, was subjected to 2-D B-spline transformation to coregister with Gel_Reg_A, the static reference image. In the interest of calculation efficacy, a multiresolution gradient descent approach was utilized through the L-BFGS optimizer to refine the registration, starting from a grid of control points to a grid of points. To constrain the vasculature smoothness, a penalty term was applied to regulate the transformation function, expressed as where represents the transformed moving image, and and are the evaluated pixel numbers along the - and -axes, respectively. Additionally, a similarity criterion was designed to quantify the degree of alignment between the static image and the moving image, as expressed in the following sum of squared differences33 where represents the static vasculature.The B-spline coefficients were then searched out by repeatedly minimizing a combined evaluation function (EF) as where works as a weighting factor to balance the registration accuracy and vasculature smoothness, which was rationally chosen as , based on the size of the current control mesh grids. If no desirable registration coefficient was identified, the searching would automatically stop by exceeding the iteration number and reaching the maximum permissible grid size. In that case, the best approximations would be returned as the proper registration parameters. Here, a composite image was created by summing both the static image and the transformed moving image with equal weights. The composite image was further trimmed by removing previously zero-padded regions.2.2.4.Precise registration feedback controlled by vasculature evaluationThe effectiveness of the general and precise registration protocols was evaluated by a specifically designed vasculature evaluation process, as shown in Fig. 8. Taking the generally registered images, Gel_Reg_A and Gel_Reg_B, as an example, two images were normalized to the same mean intensity for objective comparisons to be made. A vessel subtraction map (VSM) was then obtained by subtracting Gel_Reg_B from Gel_Reg_A, as in Fig. 8(a). The VSM was subsequently segmented into blocks with the standard deviations between the vessels being calculated from pixel value variations within each block. Finally, a vasculature evaluation map (VEM) was obtained through bicubic interpolation of the blocks to form a regional evaluation criterion with the same sampling as the original vasculatures (). Fig. 8Vasculature evaluation process to assess the quality of registrations. (a) VSM obtained through the normalized subtraction between two coregistered vasculatures. Gel_Reg_A represents the generally registered vasculature and Gel_Reg_B represents the generally registered vasculature . (b) VEM obtained by calculating regional standard deviation of the VSM and smoothing through a bicubic interpolation. represents a typical pixel in the VSM, and represent the evaluated pixel numbers along - and -axes. 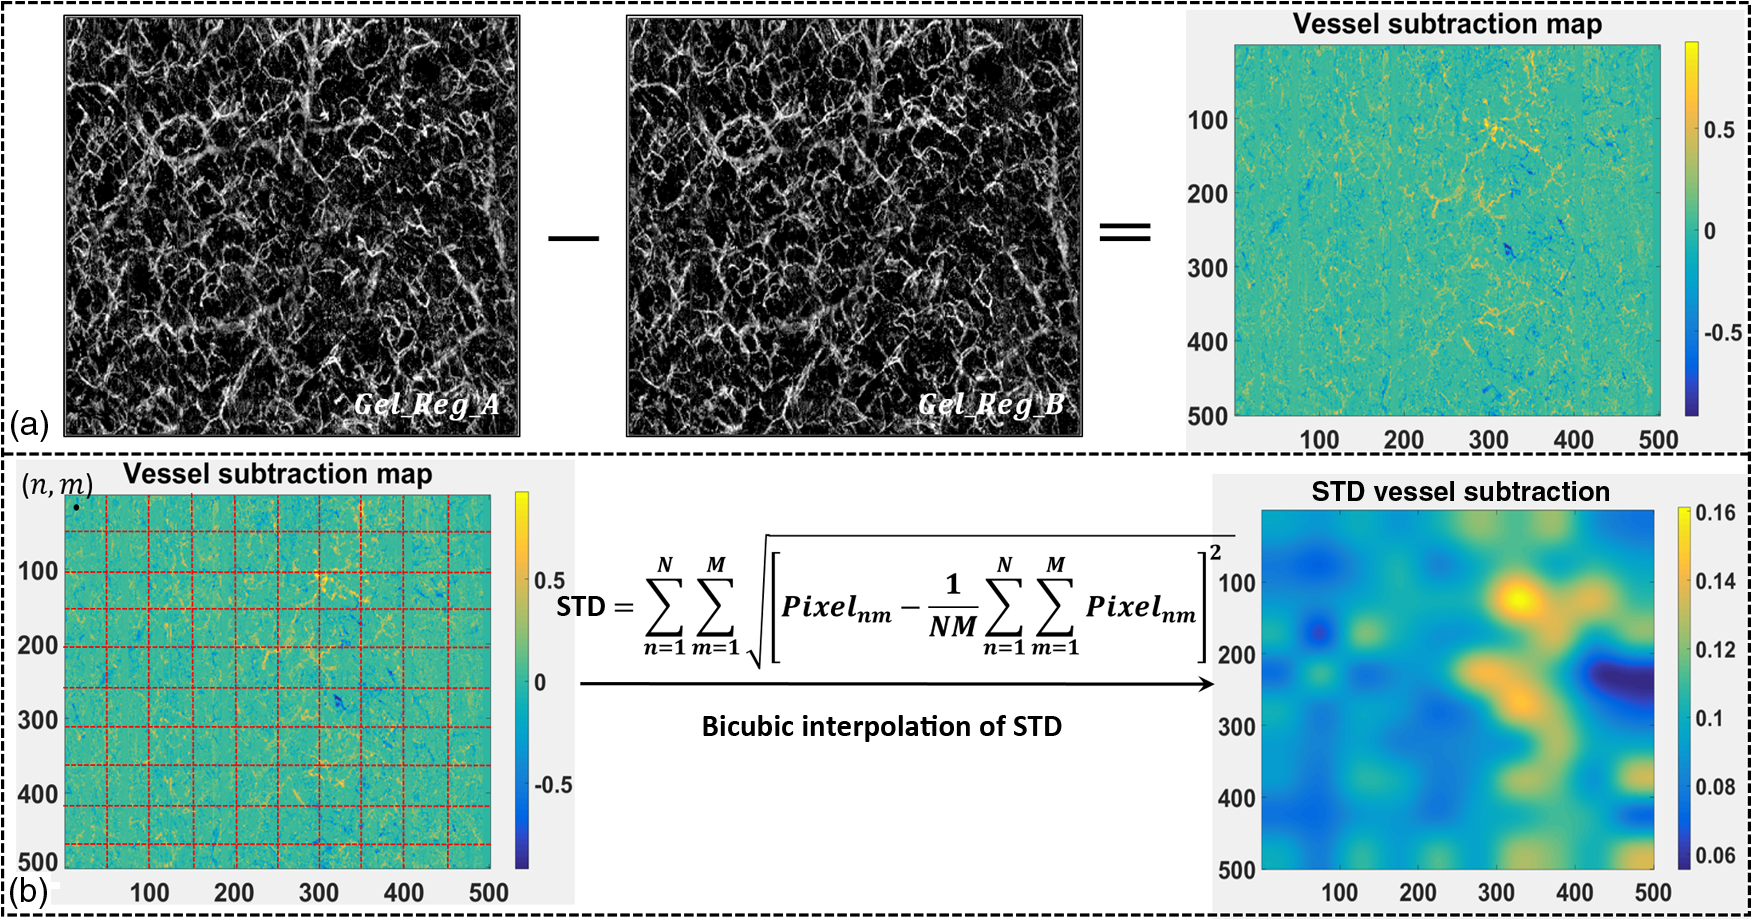 The VEM was calculated for the generally registered vasculatures, and , as shown in Fig. 9(a), with the associated vasculature composite (), shown in Fig. 9(b). Subsequently, a second VEM was obtained by comparing the B-spline deformed vasculature from the first-round precise registration with vasculature , as shown in Fig. 9(c), as well as the corresponding composite image, as shown in Fig. 9(d). A significant improvement in image quality was validated by the evaluation maps (see the reduced color bar values) and coregistered vasculatures [see the comparative vessel patterns indicated by the red arrows in Figs. 9(b) and 9(d)]. The precise registration, however, was not conclusively validated due to the relatively coarse B-spline interpolation grid (maximum points), which resulted from a trade-off with calculation efficiency. In its place, we used the VEM and identified the regions with mean values exceeding 50% of the maximum VEM value. Those regions within both vasculatures were then segmented out and zero-padded to their closest rectangle blocks. Then, a bicubic interpolation was applied to upsample those blocks twice along both - and -axes. Finally, the interpolated images were rerun through B-spline registration, and afterward downsampled back to the original transverse spacing. This feedback controlling process was repeated several times until reaching the limits where no such regions were detected, as illustrated in the precise registration element of Fig. 3. Using this method, the VEM values across the whole map were , as shown in Fig. 9(e). The corresponding final composite vasculature is shown in Fig. 9(f). Fig. 9Vasculature evaluation maps and associated composite vasculatures postregistration. (a), (c), and (e) Vasculature evaluation maps for the general registration, the first-round precise registration, and the second-round precise registration, respectively. (b), (d), and (f) The composite vasculatures obtained after the general registration, the first-round precise registration, and the second-round precise registration, respectively. 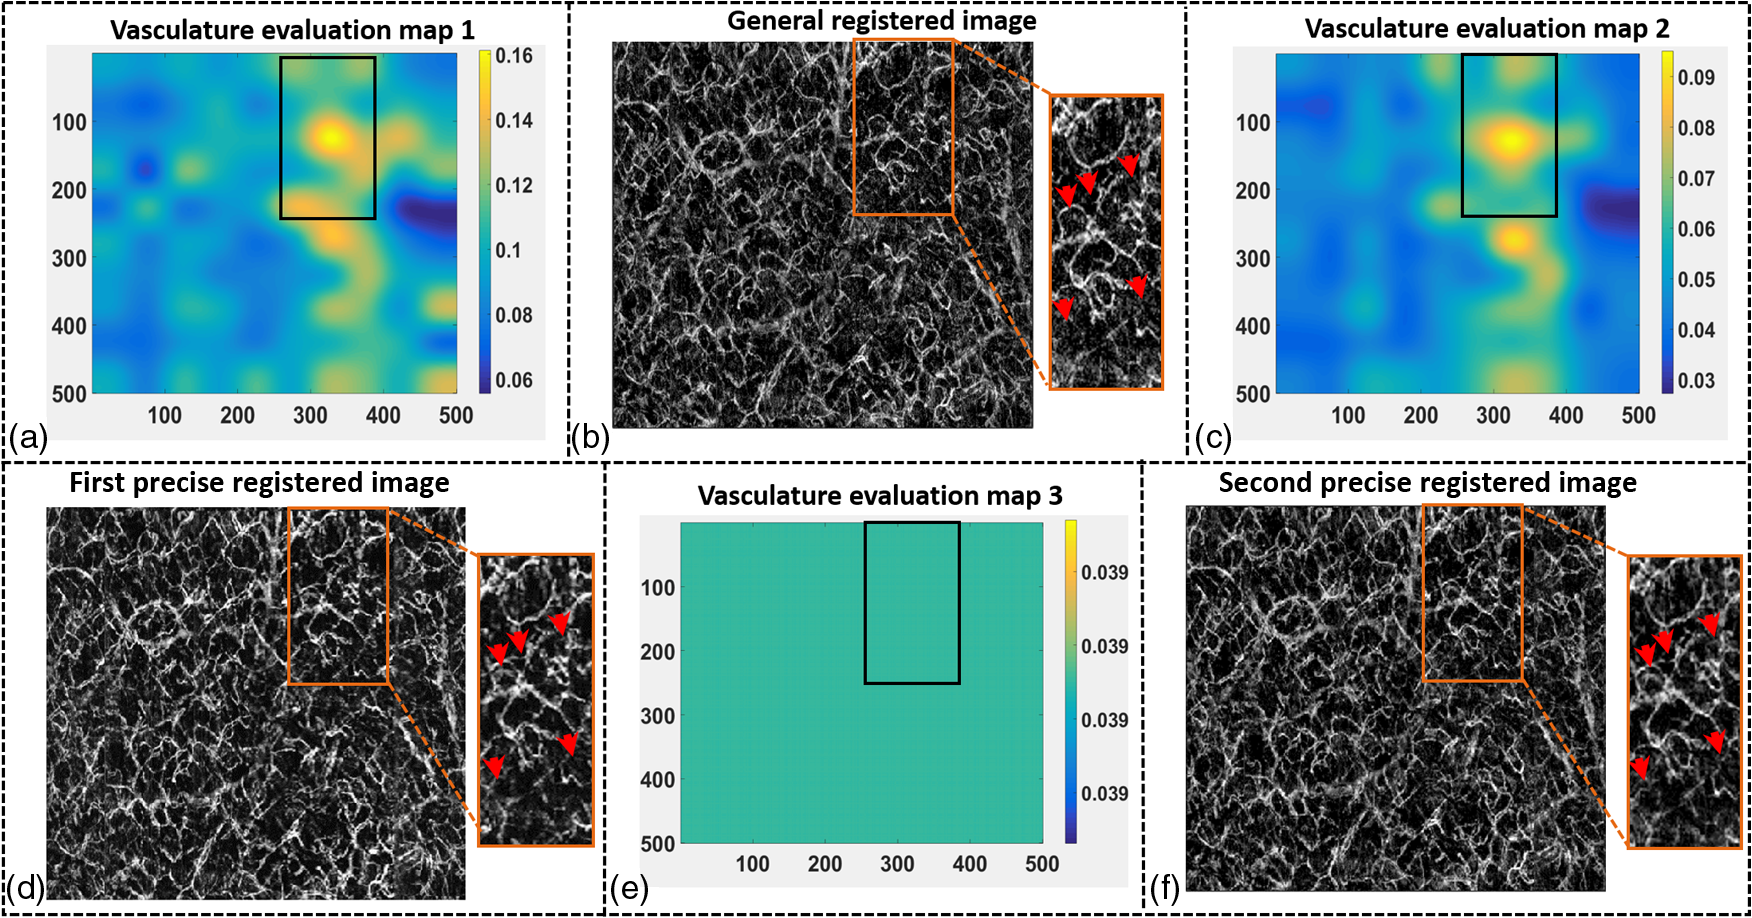 3.ResultsVisually, motion compensation and artifact reduction were successfully achieved through step-by-step rigid affine registration, rigid subpixel registration, and nonrigid B-spline free-form registration, feedback controlled by vasculature evaluation. Additionally, a considerable signal-to-noise improvement can be seen when comparing the registered vasculature composite, shown in Fig. 10(b), with the two original vasculatures, shown in Fig. 10(a). Two additional cases are shown in Figs. 10(d) versus 10(c) and Figs. 10(f) versus 10(e). As much data as possible from each vascular scan were carried forward to the artifact-free composite, as demonstrated in Figs. 10(a)–10(f) by arrows. To quantitatively evaluate the results of the registration process and to assess how much the motion compensation algorithm improved the quality of the vasculature, the CC and PSNR of both vasculatures, pre- and postregistrations, were calculated using Eqs. (8) and (9)34 where and represent individual pixel values within vasculatures and , respectively, and and represent the corresponding mean values. Comparative CC and PSNR values are listed in Table 1 for all three cases of Fig. 10. In all cases, the processes described in this study resulted in the simultaneous improvement of clarity and contrast within vasculature datasets, allowing for the subsequent production of artifact-free, signal-enhanced composite images that can be used to more accurately quantify important vessel parameters, such as vessel area density and blood flow flux.35Fig. 10Representative skin vasculatures before and after motion compensation. (a) Two en face vasculatures of case 1 preregistration. (b) Final artifact-free vasculature of case 1 postregistration. (c) Two en face vasculatures of case 2 preregistration. (d) Final artifact-free vasculature of case 2 postregistration. (e) Two en face vasculatures of case 3 preregistration. (f) Final artifact-free vasculature of case 3 postregistration. Red arrows highlight artifact lines in vasculatures preregistration. Zoomed images within boxes highlight positions with signal-to-noise improvement. 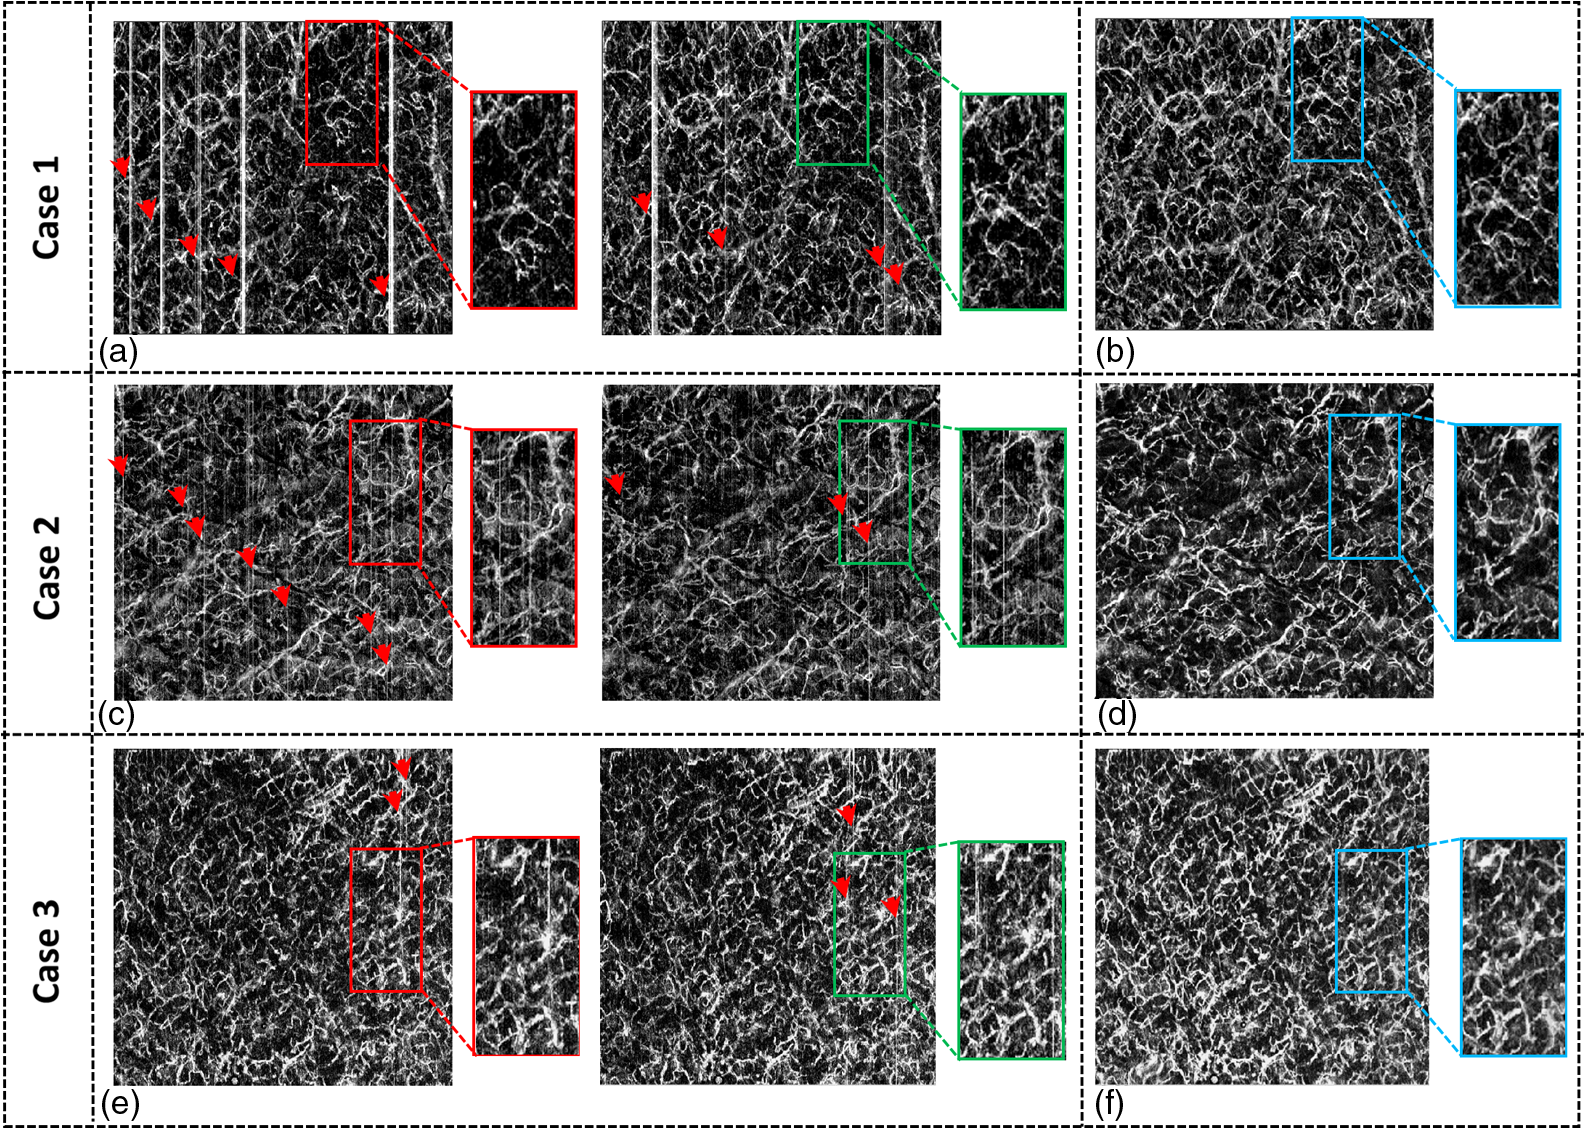 Table 1CC and PSNR values of vasculatures pre- and postregistration.
4.DiscussionThe proposed registration method was successfully utilized to eliminate motion-derived artifacts in human skin OCTA. While it is common practice to use an edge enhancement filter, such as Gabor filter or Hessian filter, to increase visual contrast (common approaches for visual enhancement36) prior to registration, no such filter was applied to the angiograms in this study. The decision was made to forego such a routine because it could have resulted in the misrepresentation of vessel textures. For instance, the Gabor filter is known to cause extensions of the vessel when used to smooth the vessel edge, which inevitably raises the quantification values of vessel area density and vessel flux. Such an occurrence can happen when capillaries or small-scale vessels are heavily involved in an evaluation, such as when imaging patients with diabetic dermopathy, necrobiosis lipoidica diabeticorum, or pruritus. Possible misreading to any degree would have been unacceptable here as accuracy is the key to this study. A more critical step in the motion compensation process, however, is accurately identifying the motion-derived artifacts. As discussed in Sec. 2.2.1, peak detection for frame group division is considered a more accurate technique when compared to arbitrary thresholds. This is justified if one considers peak analysis as peak prominence and peak width performing like dynamic thresholds on specific artifacts with consideration given to regional features. Additionally, such a technique allows for the detection of incomplete or mild artifacts. Moreover, to ensure the robustness of this technique, when no artifact was found to exceed our default prominence level, the highest peak was regarded as the point where frame groups would be divided. Although the default prominence of 0.3 times maximum elevation worked well for all cases here, further optimization could be achieved with the use of more regional characteristics, if desired. It should be noted this technique is not without a potential flaw. A conceivable problem exists in mistaking several frames as motion-derived artifacts when large vessels are orientated parallel to those frames, leading to high OMAG signals. Fortunately, however, this problem very rarely occurred here, for two reasons: first, the vessels present in the skin comprise high network distributions that typically would not be captured in single frames, and second, large unidirectional vessels in the skin typically reside in the hypodermis layer, which is almost inaccessible to the OCT beam. During affine registration, corresponding pixels were measured for statistical dependence via normalized mutual information, which is assumed to be maximal if the images are geometrically aligned. The mutual information equation was derived from the information theory, which calculates the amount of information that one image, , contains about another, , as37 Compared with the sum of squared differences used in the precise registration, the mutual information is proposed to be less sensitive to image intensity, and therefore, provided a certain robustness for the affine registration. This is especially important here because we did not apply histogram equalization to the original vasculatures, as its nonlinear manipulation may bias the quantitative analyses that follow.38 Additionally, to avoid any dependency of the registration on the vasculature overlap, an improved normalized mutual information28 was used as the standard for image alignment, as in Eq. (1). While, in practice, the affine registration still requires the two vasculatures to preserve some degree of overlap, the tolerance of such overlap will be measured in our future studies. During precise registration, the B-spline grid size was restricted to a maximum of control points. While this cannot satisfy the accuracy requirement down to a single pixel, a larger grid size would have exponentially increased the computation cost. To account for this less-than-ideal grid size, we chose to repeatedly reuse a limited grid of control points combined with interpolation of regions showing high registration deviation, which forewent the requirement for a high sampling grid of control points. Additionally, we equally segmented the vasculature subtraction map into blocks, with each block comprising . The relatively large pixel size was used to make sure the selected regions would have enough information for accurate registration in the next step of the protocol. While the protocol and accompanying data presented here are encouraging, a potential limitation for the current dual-volume scanning procedure could be that the motion-derived artifacts cannot be adequately handled when the same motions repeatedly occur across volumes. As discussed by Hendargo et al.,23 however, this may be more of a problematic issue in ophthalmology OCT scans because subjects tend to temporarily shift their eyes when the beam passes near the periphery of the fovea, causing motion-derived artifacts to be reproducible in successive volumes. In skin OCTA, the distribution of artifact lines is random with no conceivable association to the beam scanning pattern. This possible limitation decreases with, and may be overcome by simply increasing the number of acquired volumes (). Such a method would admittedly require increased computational power, but with further refinement, this increased demand could be limited. Additionally, a number of the methods outlined here may need reviewing if certain trends in OCT development continue. For example, the computation of current motion compensation is performed in 2-D, based on en face view of vasculatures, and the artifact lines used for frame group division are recognized from the projected OMAG signals of corresponding motion involved frames. While these are currently favorable methods, the skyrocketing speed of OCT A-scan acquisition means the OCTA algorithms are likely to rapidly change from interframe to direct intervolume.39 In that scenario, the artifacts would not appear as bright lines, and accordingly, proper artifact detection methods and image registration methods would need be developed from 2-D to 3-D domains. 5.ConclusionWe have proposed and demonstrated an automatic motion compensation method for robust motion-artifact removal in human skin OCT angiography. The compensation was achieved by sequentially performing rigid and nonrigid image registrations on dual-volume datasets to form an artifact-free and quality-enhanced vasculature composite. In general registration, a rigid affine registration was first performed on large vessels in the deep reticular dermis. The affine registration parameters were then applied to the all-depth vasculatures with a subpixel registration being added to refine the process ascribed to the involvement of smaller superficial plexus. Then, a precise registration algorithm based upon B-spline free-form deformation was used to adjust regional mismatches, which was feedback controlled through a loop of vasculature evaluation and regional interpolation. The final vasculature composites have shown considerable signal-to-noise improvement with substantial motion-artifact removed. We expect that this method would have great potential to improve the clinical diagnosis of OCT angiography in dermatology applications. AcknowledgmentsThe study was supported in part by the National Heart and Lung Institute (No. R01HL093140) and the National Eye Institute (No. R01EY024158). ReferencesE. Sattler, R. Kästle and J. Welzel,
“Optical coherence tomography in dermatology,”
J. Biomed. Opt., 18
(6), 061224
(2013). http://dx.doi.org/10.1117/1.JBO.18.6.061224 JBOPFO 1083-3668 Google Scholar
J. Qin et al.,
“In vivo volumetric imaging of microcirculation within human skin under psoriatic conditions using optical microangiography,”
Lasers in Surgery and Medicine, 43
(2), 122
–129
(2011). Google Scholar
T. Gambichler, A. Pljakic and L. Schmitz,
“Recent advances in clinical application of optical coherence tomography of human skin,”
Clin. Cosmet. Invest. Dermatol., 8 345
(2015). http://dx.doi.org/10.2147/CCID.S69119 Google Scholar
C. Blatter et al.,
“In situ structural and microangiographic assessment of human skin lesions with high-speed OCT,”
Biomed. Opt. Express, 3
(10), 2636
–2646
(2012). http://dx.doi.org/10.1364/BOE.3.002636 BOEICL 2156-7085 Google Scholar
W. Drexler and J. G. Fujimoto, Optical Coherence Tomography: Technology and Applications, Springer Science & Business Media, New York
(2008). Google Scholar
R. K. Wang et al.,
“Depth-resolved imaging of capillary networks in retina and choroid using ultrahigh sensitive optical microangiography,”
Opt. Lett., 35
(9), 1467
–1469
(2010). http://dx.doi.org/10.1364/OL.35.001467 OPLEDP 0146-9592 Google Scholar
L. An, J. Qin and R. K. Wang,
“Ultrahigh sensitive optical microangiography for in vivo imaging of microcirculations within human skin tissue beds,”
Opt. Express, 18
(8), 8220
–8228
(2010). http://dx.doi.org/10.1364/OE.18.008220 OPEXFF 1094-4087 Google Scholar
A. Zhang et al.,
“Methods and algorithms for optical coherence tomography-based angiography: a review and comparison,”
J. Biomed. Opt., 20
(10), 100901
(2015). http://dx.doi.org/10.1117/1.JBO.20.10.100901 JBOPFO 1083-3668 Google Scholar
C.-L. Chen and R. K. Wang,
“Optical coherence tomography based angiography [invited],”
Biomed. Opt. Express, 8
(2), 1056
–1082
(2017). http://dx.doi.org/10.1364/BOE.8.001056 BOEICL 2156-7085 Google Scholar
Y. Huang et al.,
“Swept-source OCT angiography of the retinal vasculature using intensity differentiation-based optical microangiography algorithms,”
Ophthalmic Surg. Lasers Imaging Retina, 45
(5), 382
–389
(2014). http://dx.doi.org/10.3928/23258160-20140909-08 OPSGAT 0022-023X Google Scholar
M. Ulrich et al.,
“Dynamic optical coherence tomography in dermatology,”
Dermatology, 232
(3), 298
–311
(2016). http://dx.doi.org/10.1159/000444706 DERMEI 0742-3217 Google Scholar
L. Themstrup et al.,
“Validation of dynamic optical coherence tomography for non-invasive, in vivo microcirculation imaging of the skin,”
Microvasc. Res., 107 97
–105
(2016). http://dx.doi.org/10.1016/j.mvr.2016.05.004 Google Scholar
U. Baran, W. Choi and R. Wang,
“Potential use of OCT-based microangiography in clinical dermatology,”
Skin Res. Technol., 22
(2015). http://dx.doi.org/10.1111/srt.12255 Google Scholar
S. J. Men et al.,
“Repeatability of vessel density measurement in human skin by OCT-based microangiography,”
Skin Res. Technol., http://dx.doi.org/10.1111/srt.12379 Google Scholar
Z. Zhi et al.,
“4D optical coherence tomography-based micro-angiography achieved by 1.6-MHz FDML swept source,”
Opt. Lett., 40
(8), 1779
–1782
(2015). http://dx.doi.org/10.1364/OL.40.001779 OPLEDP 0146-9592 Google Scholar
Q. Zhang et al.,
“Wide-field imaging of retinal vasculature using optical coherence tomography-based microangiography provided by motion tracking,”
J. Biomed. Opt., 20
(6), 066008
(2015). http://dx.doi.org/10.1117/1.JBO.20.6.066008 JBOPFO 1083-3668 Google Scholar
B. Braaf et al.,
“Real-time eye motion correction in phase-resolved OCT angiography with tracking SLO,”
Biomed. Opt. Express, 4
(1), 51
–65
(2013). http://dx.doi.org/10.1364/BOE.4.000051 BOEICL 2156-7085 Google Scholar
C. K. Sheehy et al.,
“High-speed, image-based eye tracking with a scanning laser ophthalmoscope,”
Biomed. Opt. Express, 3
(10), 2611
–2622
(2012). http://dx.doi.org/10.1364/BOE.3.002611 BOEICL 2156-7085 Google Scholar
F. P. Oliveira and J. M. Tavares,
“Medical image registration: a review,”
Comput. Methods Biomech. Biomed. Eng., 17
(2), 73
–93
(2014). http://dx.doi.org/10.1080/10255842.2012.670855 Google Scholar
M. F. Kraus et al.,
“Motion correction in optical coherence tomography volumes on a per A-scan basis using orthogonal scan patterns,”
Biomed. Opt. Express, 3
(6), 1182
–1199
(2012). http://dx.doi.org/10.1364/BOE.3.001182 BOEICL 2156-7085 Google Scholar
B. Antony et al.,
“Automated 3-D method for the correction of axial artifacts in spectral-domain optical coherence tomography images,”
Biomed. Opt. Express, 2
(8), 2403
–2416
(2011). http://dx.doi.org/10.1364/BOE.2.002403 BOEICL 2156-7085 Google Scholar
Y. M. Liew et al.,
“Motion correction of in vivo three-dimensional optical coherence tomography of human skin using a fiducial marker,”
Biomed. Opt. Express, 3
(8), 1774
–1786
(2012). http://dx.doi.org/10.1364/BOE.3.001774 BOEICL 2156-7085 Google Scholar
H. C. Hendargo et al.,
“Automated non-rigid registration and mosaicing for robust imaging of distinct retinal capillary beds using speckle variance optical coherence tomography,”
Biomed. Opt. Express, 4
(6), 803
–821
(2013). http://dx.doi.org/10.1364/BOE.4.000803 BOEICL 2156-7085 Google Scholar
P. Zang et al.,
“Automated motion correction using parallel-strip registration for wide-field en face OCT angiogram,”
Biomed. Opt. Express, 7
(7), 2823
–2836
(2016). http://dx.doi.org/10.1364/BOE.7.002823 BOEICL 2156-7085 Google Scholar
M. Guizar-Sicairos, S. T. Thurman and J. R. Fienup,
“Efficient subpixel image registration algorithms,”
Opt. Lett., 33
(2), 156
–158
(2008). http://dx.doi.org/10.1364/OL.33.000156 OPLEDP 0146-9592 Google Scholar
X. Yin, J. R. Chao and R. K. Wang,
“User-guided segmentation for volumetric retinal optical coherence tomography images,”
J. Biomed. Opt., 19
(8), 086020
(2014). http://dx.doi.org/10.1117/1.JBO.19.8.086020 JBOPFO 1083-3668 Google Scholar
D. L. Hill et al.,
“Medical image registration,”
Phys. Med. Biol., 46
(3), R1
(2001). http://dx.doi.org/10.1088/0031-9155/46/3/201 PHMBA7 0031-9155 Google Scholar
C. Studholme, D. L. Hill and D. J. Hawkes,
“An overlap invariant entropy measure of 3D medical image alignment,”
Pattern Recognit., 32
(1), 71
–86
(1999). http://dx.doi.org/10.1016/S0031-3203(98)00091-0 Google Scholar
F. Maes et al.,
“Multimodality image registration by maximization of mutual information,”
IEEE Trans. Med. Imaging, 16
(2), 187
–198
(1997). http://dx.doi.org/10.1109/42.563664 ITMID4 0278-0062 Google Scholar
D. Rueckert et al.,
“Nonrigid registration using free-form deformations: application to breast MR images,”
IEEE Trans. Med. Imaging, 18
(8), 712
–721
(1999). http://dx.doi.org/10.1109/42.796284 ITMID4 0278-0062 Google Scholar
A. Jorge-Penas et al.,
“Free form deformation-based image registration improves accuracy of traction force microscopy,”
PLoS One, 10
(12), e0144184
(2015). http://dx.doi.org/10.1371/journal.pone.0144184 POLNCL 1932-6203 Google Scholar
S. Lee, G. Wolberg and S. Y. Shin,
“Scattered data interpolation with multilevel B-splines,”
IEEE Trans. Visual Comput. Graphics, 3
(3), 228
–244
(1997). http://dx.doi.org/10.1109/2945.620490 Google Scholar
J. Ulysses and A. Conci,
“Measuring similarity in medical registration,”
in IWSSIP 17th Int. Conf. on Systems, Signals and Image Processing,
(2010). Google Scholar
S. Dhahbi, W. Barhoumi and E. Zagrouba,
“A cost efficient approach for automatic non-rigid registration of medical images,”
in Int. Workshop on Medical Image Analysis and Description for Diagnosis Systems MIAD,
(2009). Google Scholar
C.-L. Chen et al.,
“Optic nerve head perfusion in normal eyes and eyes with glaucoma using optical coherence tomography-based microangiography,”
Quantum Imaging Med. Surg., 6
(2), 125
–133
(2016). http://dx.doi.org/10.21037/qims Google Scholar
A. F. Frangi et al.,
“Multiscale vessel enhancement filtering,”
in Int. Conf. on Medical Image Computing and Computer-Assisted Intervention,
(1998). Google Scholar
P. Viola and III W. M. Wells,
“Alignment by maximization of mutual information,”
Int. J. Comput. Vision, 24
(2), 137
–154
(1997). http://dx.doi.org/10.1023/A:1007958904918 IJCVEQ 0920-5691 Google Scholar
A. Singh, S. Shibu and S. Dubey,
“Recent image enhancement techniques: a review,”
Int. J. Eng. Adv. Technol., 4
(1), 40
–45
(2014). Google Scholar
W. Wei et al.,
“Inter-volume analysis to achieve 4D optical micro-angiography for observation of dynamic blood flow,”
036005
(2016). http://dx.doi.org/10.1117/1.JBO.21.3.036005 Google Scholar
|
||||||||||||||||||||||||||||||||||


