|
|
1.IntroductionGlucocorticoids (GC) are frequently used for the topical therapy of inflammatory skin diseases. The most common adverse effect of topical corticosteroids is cutaneous atrophy, which is characterized by a decrease in skin thickness and loss of elasticity causing cutaneous transparency, increased fragility, and telangiectasia. Topical GC treatment is associated with an increased permeability and transepidermal water loss1 that indicates a disturbed skin barrier function.2,3 Histopathological findings include flattening of the dermoepidermal junctions4,5 and a reduction of epidermal thickness and number of fibroblasts.1,6,7 Transmission electron microscopic measurements showed a loss of ground substance after 6 weeks of occlusive clobetasol application leading to decreased spaces between collagen and elastic fibers resulting in a more compact papillary and reticular dermis, whereas collagen fibers appeared less woven but rather regularly arranged.8 Antioxidants neutralize free radicals and, therefore, protect the skin from free radical-induced oxidative stress. The equilibrium of both antioxidants and free radicals forms the antioxidant status of the skin. Using carotenoids as marker substance of the antioxidant status in the human skin changes in the antioxidant status of the skin due to free radical formation induced by UV exposure or further internal and external factors were assessed noninvasively as described previously.9,10 Previous data indicate that GC decrease the activity of glutathione peroxidase and enhance the accumulation of reactive oxygen species in hippocampal neurons,11,12 whereas the effect of topical GC treatment to the antioxidant status of the skin has remained unclear. Several noninvasive methods for assessment of aspects of skin atrophy have been described. Established imaging techniques, such as high-frequency ultrasound (US) and optical coherence tomography (OCT), are useful for evaluating dermal and epidermal thinning, respectively. Using OCT, it was shown that after 3 days of topical steroid treatment a significant reduction in epidermal thickness can be found.1,13 However, these techniques cannot deliver the subcellular resolution that is required to evaluate important features such as dyskeratosis, morphological changes of the epidermal cell layers, or changes in the dermal fibrillary network. Confocal laser scanning microscopy (CLSM) and multiphoton tomography (MPT) are in vivo imaging techniques with very high spatial resolution that allow assessment of cell morphology. MPT is based on the nonlinear excitation of endogenous fluorophores, among others NAD(P)H, flavoproteins, keratin, lipofuscin, elastin, collagen, melanin, and porphyrins. Due to their noncentrosymmetric structure, collagen fibers generate a strong second-harmonic generation (SHG) signal and can be imaged within the dermis with SHG microscopy.14 Recently, SHG was also used for the investigation of collagen-fiber orientation and their structural changes in fibrotic collagen,15 human dermis,16–19 and keloid tissue.20 The elasticity and tensile strength of the dermis is dependent on a fibrillar network consisting of mainly collagen and elastin, but also proteoglycans and glycoproteins. Some of the clinical features of GC-induced skin atrophy have been ascribed to the loss of dermal collagen and elastin.21,22 The fiber network density and morphology have been used to access age-related alterations found in the dermis, which are particularly related to alterations in the collagen network. Upon aging, the collagen fibers thicken while the elastin network shows fewer microfilaments and a loosening of the fibers.5,23 The second-harmonic-to-autofluorescence (SHG to AF) aging index of dermis (SAAID) is defined as (SHG − AF) / (SGH + AF) and has previously been described as a noninvasive way to measure the aging processes in the human skin in vivo.24 It is based on the simultaneous determination of AF and SHG signal intensities and indicates the fibrous status of the dermis. Previous investigations showed that the SAAID decreases with age24 and after photoaging processes in the sun-exposed skin areas.25 The aim of this study was to examine the effects of topical GCs on stratum corneum, epidermal, and dermal structures in vivo using high-resolution imaging techniques. In addition to that the antioxidant status of the epidermis was assessed as an indicator for free radical formation induced by GC treatment. 2.Materials and Methods2.1.Study DesignThis phase I, single-center, explorative, randomized, investigator-blinded, negative-controlled trial with intraindividual comparison was conducted at the Charité-Universitätsmedizin Berlin, Department of Dermatology and Allergy. Eligible subjects were recruited from January 29, 2015 to February 27, 2015. The last subject finished the trial on April 28, 2015. 2.1.1.Randomization and blindingRandomized assignment to two different measurement groups and treatment assignment to test sites was conducted prior to the first measurements. The four test sites A, B, C, and D (group 1: , each; group 2: , each) were marked on the lower volar surface of the arms, A and B on the right arm and C and D on the left arm. The subjects were exposed once daily over a 28-day treatment period including weekends to each of the following treatments with on the marked test sites: clobetasol propionate 0.05% (CP), betamethasone dipropionate 0.064% (BDP), and petrolatum ointment, which was used as the vehicle of the steroid formulations, as negative control. One test site remained untreated. The steroid treatment with CP and BDP was conducted over a 28-day period and followed by a 7-day treatment-free period starting at day 29 up to day 36. For allocation of the groups and treatments, a computer-generated list was used. Randomization was performed successively using sealed randomization envelopes. Investigators involved in the study assessments were blinded to the identity and allocation of the treatments. 2.1.2.SubjectsA total of 16 healthy male subjects of skin types I to III, aged between 20 and 40 years, entered treatment phase for the trial (Fig. 1). Informed consent was obtained from all subjects. Main exclusion criteria included clinical skin atrophy, telangiectasia or striae on volar arms, presence of any skin condition or coloring, e.g., marked suntan, hyperpigmentation, scars, tattoos, or body art, that would have interfered with test sites or the response or assessment. Further exclusion criteria were history or current evidence of infection, eczema, or other relevant skin diseases (e.g., atopic dermatitis or known contact allergy), significant history or current evidence of chronic infectious disease, system disorder (especially hypertension or circulatory disease), or organ dysfunction and known predisposition for hypertrophic scar formation. 2.1.3.Ethical approvalPrior to initiation of the study, the protocol and the subject informed consent form were approved by the independent Ethics Committee of the State Office of Health and Social Affairs Berlin (LAGeSo). The study was registered at the European Union Drug Regulating Authorities Clinical Trials Database (EudraCT 2014-001450-42). The study was conducted according to the principles of the Declaration of Helsinki (1996) and Good Clinical Practice Guidelines. 2.1.4.AssessmentsTreatments were applied, according to the randomization plan, once daily by study nurses on the respective test areas. The study products were administered by a 5-s lasting gently rubbing application independently and blinded from investigators. Measurements by US, OCT, LSM, MPT, and resonance Raman spectroscopy (RRS) were performed on the marked areas A, B, C, and D at baseline, day 29 [at end of treatment (eoT)], and day 36 (7 days after eoT). The obtained measuring parameters included stratum corneum thickness, epidermal thickness, full skin thickness (defined as the sum of epidermal and dermal thickness), keratinocyte size and density, nucleus-to-cytoplasm ratio, skin surface classification, cell nucleus visibility on the skin surface, SAAID, and cutaneous carotenoid concentration. All observers were blinded to the treatment group for the analysis of obtained images and spectra. 2.2.UltrasoundMeasurements using high frequency US were conducted in order to assess changes in full skin thickness defined as the sum of epidermal and dermal thickness. The DermaScan C (Cortex Technology, Denmark) and a 20-MHz transductor were utilized providing a signal penetration depth of , an axial resolution of , and a lateral resolution of . 2.3.Optical Coherence TomographyOCT was used for the determination of epidermal thickness. By this noninvasive interferometry-based coherent imaging technique, cross-sectional images from the skin can be obtained. The Swept Source OCT System VivoSight® (Michelson Diagnostics, Kent, United Kingdom) was used with a laser wavelength of 1305 nm as a light source. The maximum penetration depth was 2 mm on a maximum area of with a lateral resolution of up to and an axial resolution of up to .26 2.4.Confocal Laser-Scanning MicroscopyIn vivo laser scanning microscopy was applied to visualize epidermal structures and evaluate stratum corneum thickness and surface structure as well as keratinocyte size and density in the granular layer. The Vivascope® 1500 (MAVIG GmbH, Munich, Germany) provided noninvasive horizontal images of the skin with an optical resolution of about and an emitting laser wavelength at 488 and 576 nm. Natrium-fluorescein was applied for visualization of the stratum corneum in fluorescence mode. Reflectance mode was used to obtain stacks of steps into a depth of . The utilized CLSM was described in detail elsewhere.25 In order to evaluate the results from LSM images, changes in the stratum corneum were evaluated using a skin surface classification based on the structural observations of LSM images (Table 1). Similar classifications were successfully used previously.27,28 Within this classification, an abraded skin surface corresponds to irregularly shaped corneocytes with an overall more uneven skin surface and punctual areas of enhanced sodium fluorescence accumulation while a loss of the honeycomb structure and larger areas of sodium fluorescence accumulation as well as visibility of lower skin layers were ascribed to a damaged skin surface. Furthermore, the cell nucleus visibility within the stratum corneum was assessed as an indicator for changes corresponding to atrophy, enhanced transparency, or parakeratosis in the upper epidermal layers (Table 2). Table 1Skin surface classification used for analysis of changes in the stratum corneum by LSM.
Table 2Cell nucleus visibility classification used for evaluation of changes in the stratum corneum and upper epidermal layers by LSM. 2.5.Multiphoton TomographyIn this study, the MPT system “DermaInspect” (Jenlab GmbH, Jena, Germany) was used. Multiphoton tomography is based on the simultaneous nonlinear absorption of two photons and uses a tunable femtosecond titanium-sapphire laser as a light source. The laser was operated at 760 nm and generated 100 fs pulses at a repetition rate of 80 MHz. This technique provides high resolution ( lateral and axial resolution) images of different skin structures into a depth of in vivo without the use of fluorescent dyes. Using the AF mode, horizontal images were used for the determination of the morphological parameters of the granular and spinous layers, such as keratinocyte size and density and the nucleus-to-cytoplasm ratio. The morphological parameters were determined by manually analyzing each horizontal image, as previously reported.29 The SHG mode visualizes the fibrous network of collagen fibers within the dermis. The SAAID was additionally determined. Two image stacks of steps to a depth of were obtained. The single images measured a focused area of during 3 s to provide measurement stability,30 where the described parameters were consecutively analyzed. Due to the atrophic changes in the skin, the mean SAAID was calculated for adapted depth considering the changes in skin thickness. Measuring depths at baseline and day 29 were determined with regard to the dermoepidermal junction zone and the SAAID calculated for the upper dermal layers beneath this zone. The utilized MPT system was described in detail previously.29 2.6.Resonance Raman SpectroscopyUsing a Raman spectroscope developed by the Laser- und Medizin-Technologie GmbH, Berlin, and the Charité-Universitätsmedizin Berlin, Center of Experimental and Cutaneous Physiology, the assessment of the antioxidant status of the skin was carried out. It was shown in previous in vivo studies that carotenoids represent marker substances of the complete antioxidant status of the human skin epidermis.31,32 RRS was applied noninvasively to quantify changes in the carotenoid concentration of the skin by measuring the intensity of the prominent Raman peak at excited using the blue laser light at a wavelength of 488 nm.33 The utilized doses of reference light () were not sufficient to induce oxidative stress conditions or any changes in the skin.34 The RRS method was chosen due to its high sensitivity and measurement quickness in comparison to other available methods.35 The utilized RRS was described in detail elsewhere.33 2.7.Statistical AnalysisDescriptive evaluation and statistical analysis were conducted using SAS software. Two-way analysis of variance was applied, changes from baseline were subject to -test, in which -values of less than 0.05 were considered to indicate statistical significance without adjustments for multiplicity. 3.Results3.1.Skin ThicknessOverall, a reduction of both epidermal and full skin thickness was observed in GC- and vehicle-treated areas as well as in untreated skin () (Figs. 2 and 3 and Table 3). GC treatment induced an enhanced reduction in epidermal and full skin thickness compared to vehicle-treated and -untreated skin areas, whereas CP induced a slightly higher thinning of epidermal and full skin thickness compared to BDP after 28 days of treatment. Stratum corneum thickness was significantly reduced in GC and vehicle-treated sites, whereas only a slight thinning effect was observed in untreated skin. Fig. 2Effect of GC treatment on stratum corneum, epidermal, and full skin thickness assessed by OCT, CSLM, and US. Day 1 is at baseline, day 29 is the last day of treatment, and day 36 is a 1-week follow-up.  Fig. 3(a) Exemplary vertical images of epidermal thickness measured by OCT at baseline, (b) after 28 days of treatment at day 29, and (c) 7 days after eoT in a CP-treated skin area with arrows marking the dermoepidermal junction. A notable thinning of the epidermis can be observed after 28 days of CP treatment (b) with a partial recovery 7 days after eoT (c). 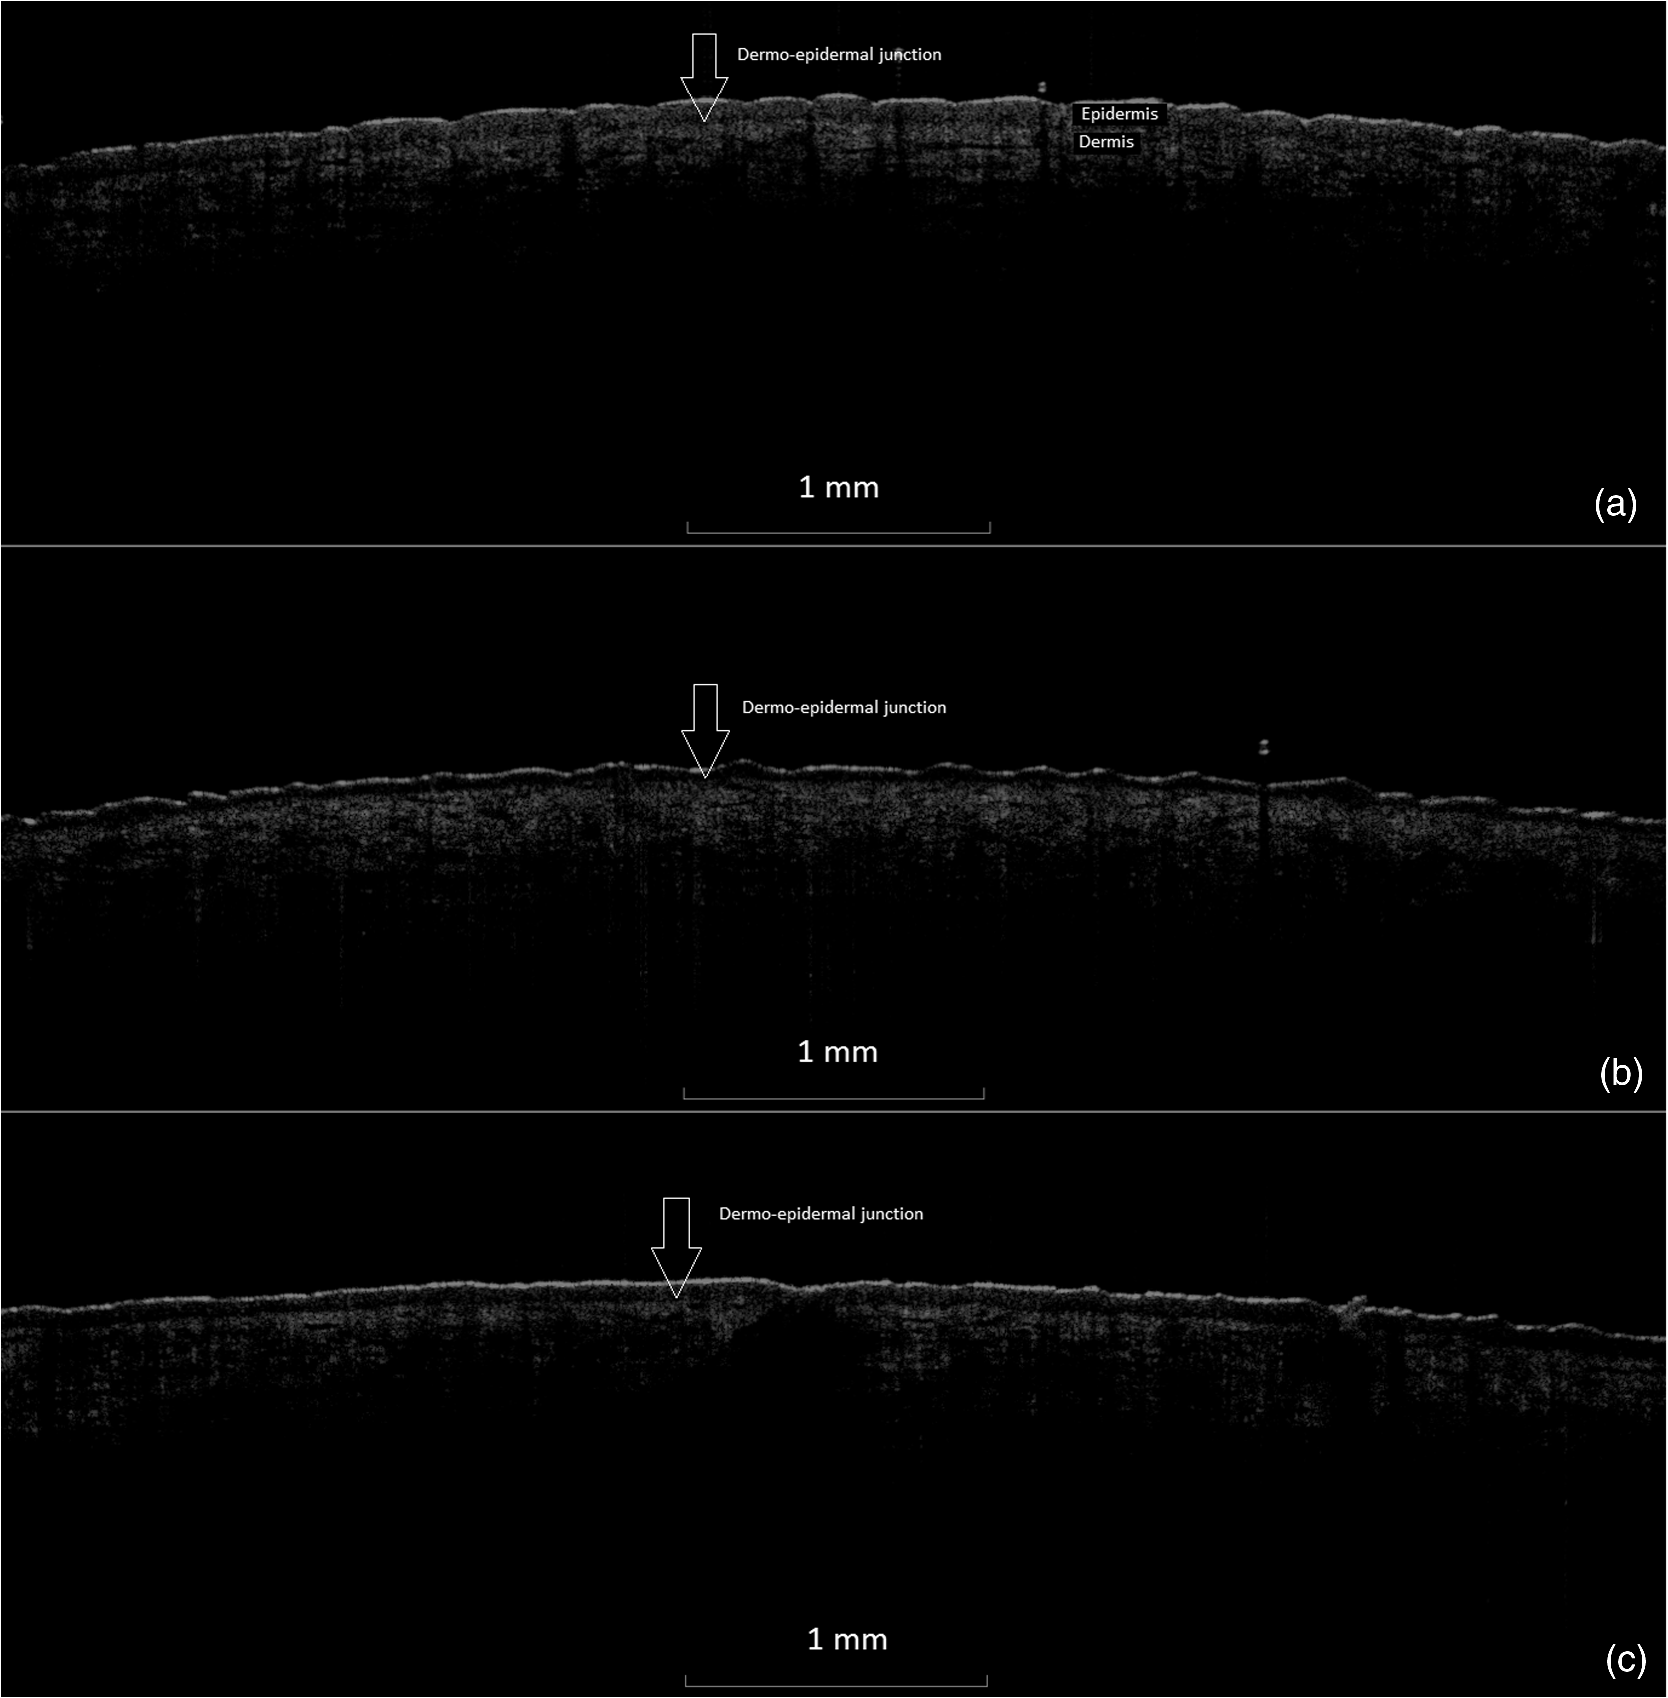 Table 3Mean value and standard deviation (SD) of changes (μm) from baseline to day 29 of full skin thickness by US, of epidermal thickness by OCT, and of stratum corneum thickness by LSM at baseline, day 29, and day 36. P-values describe the changes from baseline to day 29 after treatment of the skin with CP, BD, and petrolatum as well as in untreated skin areas.
All treatment areas showed a partial recovery 1 week after eoT at day 36, but none of them showed a complete recovery to baseline thickness. 3.2.Effect of GC Treatment on Epidermal Cell Density and MorphologyAnalysis of the MPT-AF images showed significant changes of epidermal cell number and size in GC-treated skin areas, as well as petrolatum-treated and nontreated areas, respectively (Table 4, Figs. 4Fig. 5–6). CP and BDP treatment induced a notably higher increase in cell density in treated areas compared to petrolatum-treated or nontreated areas, whereas CP showed higher structural effects than BDP. The increase in cell density was corresponding to a significantly reduced size of keratinocytes of the stratum granulosum in both GC-treated sites. The nucleus-to-cytoplasm ratio showed an overall increase in all skin sites at day 29 with the highest significant increase in GC-treated skin. All morphologic changes show a partial recovery 7 days after eoT. Table 4Mean values and SD of cell density, keratinocyte size, and nucleus-to-cytoplasm ratio in stratum granulosum and stratum spinosum per 100×100 μm2 measured by MPT-AF at baseline, day 29 (at the eoT), and day 36 (7 days after eoT).
aCell count of the stratum granulosum and spinosum per 100×100μm2 determined in twofold measurements using multiphoton autofluorescence excitation microscopy by multiphoton tomography (MPT-AF). Fig. 4Keratinocyte size in the stratum granulosum and stratum spinosum of the four treated sites at baseline, day 29 and day 36. The highest reduction in size was observed in clobetasolpropionate-treated areas. Moreover, a significant reduction in nontreated skin sites was observed.  Fig. 5(a) Exemplary horizontal images of upper stratum granulosum layers by MPT at baseline and (b) after 28 days of treatment at day 29 with characteristic keratohyalingranular morphology.  Fig. 6Nucleus-to-cytoplasm ratios and cell density counts in the stratum granulosum and stratum spinosum. The nucleus-to-cytoplasm ratio shows an overall increase at day 29 with the highest increase in CP-treated skin sites going along with an increased cell density in all skin sites at day 29. Both nucleus-to-cytoplasm ratio and cell density show partial recovery 7 days after eoT.  3.3.Cell Nucleus Visibility and Skin Surface ClassificationThe evaluation of CLSM images showed skin surface properties of abraded skin at baseline measurements in some individuals (Table 5 and Fig. 7). At day 29, an increased number of subjects with properties of abraded skin were observed regarding all four treatment sites. Damaged skin was more frequently observed in steroid-treated skin sites at both day 29 and day 36 with increased frequencies of damaged skin 7 days after eoT. Petrolatum-treated areas also showed an increase in abraded skin and even one case of damaged skin. Cell nuclei were, to a small extent, less than visible on the skin surface at baseline but were clearly distinguishable to more than at day 29 and day 36 in all four skin sites in all subjects indicating parakeratosis or thinning of the stratum corneum layer and enhanced transparency (Fig. 8). Table 5Frequencies of the evaluation of the skin surface classification observed at baseline, day 29, and day 36 determined by LSM.
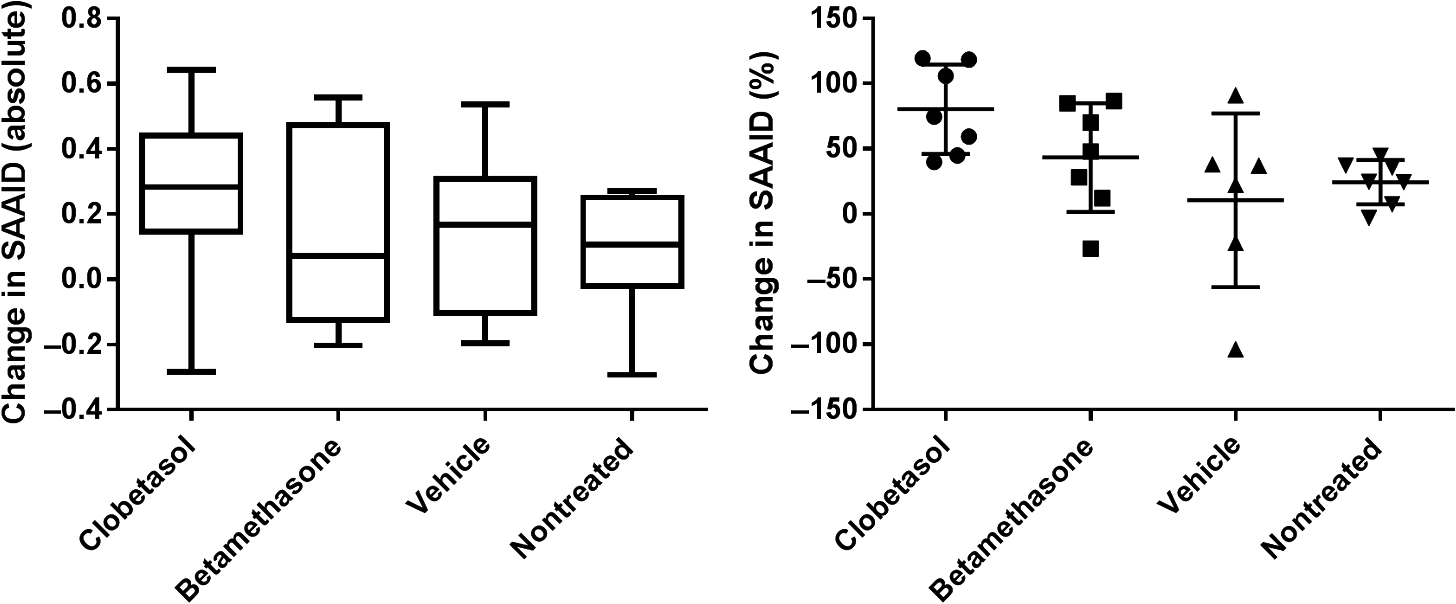
Fig. 7Exemplary images of the skin surface classification observed. In intact skin, the honeycomb pattern with evenly distributed fluorescent signals along the cell borders. Abraded skin exhibits several areas of fluorescent dye accumulation and disturbed honeycomb pattern, while in damaged skin large areas of disrupted skin layers are visible. 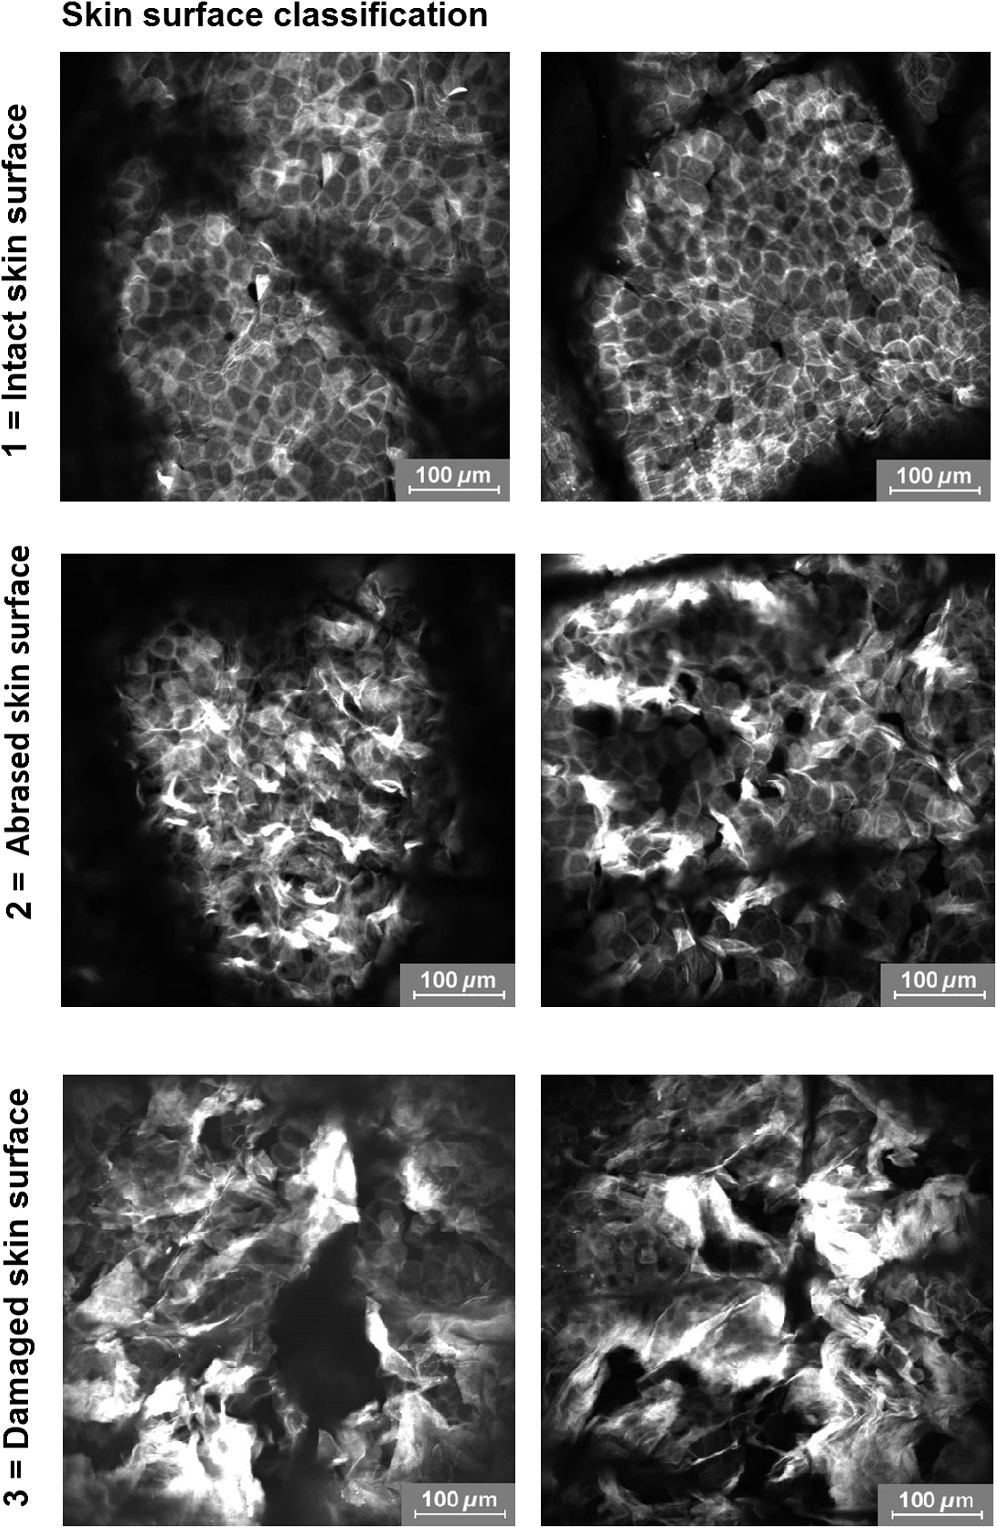 3.4.Effect of GC Treatment on the Collagen and Elastin Signal in the Upper DermisEpidermis and dermis differ notably regarding collagen and elastin fiber concentrations and, therefore, in SAAID. For analysis of numerical SAAID values, horizontal multiphoton images were obtained from the upper dermis. Due to the strong reduction in skin thickness, horizontal measurement depths for the SAAID had to be individually adapted to the upper dermis. Therefore, the SAAID were determined at individually determined depths, which was the first measured layer of the upper dermis as the consecutive deeper layer beneath the dermoepidermal junction zone in the horizontal MPT-stacks of two different areas. Despite this analytic procedure, a significant increase of SAAID values was observed in all treatment sites at day 29 compared to baseline with a partial but not full recovery at day 36. Results of SHG measurements showed a corresponding increase of MPT-SHG signal intensities at day 29 in all areas with a higher increase in steroid-treated areas, indicating a higher density of collagen fibers in CP- and BDP-treated skin sites (Fig. 9) with a sixfold increase of MPT-SHG signal intensities found in CP-treated areas, a sevenfold increase in BDP-treated areas, and a twofold increase in both petrolatum and untreated skin areas. 3.5.Effect of GC Treatment on the Antioxidant Status of the SkinThe mean carotenoid concentration was reduced during 28 days of topical CP and BDP treatment while changes in petrolatum-treated and nontreated skin sites were minor. At day 36, CP-treated skin areas showed no recovery, and BDP-treated skin areas showed a partial recovery. Moreover, petrolatum-treated and nontreated skin sites showed an increase within after eoT, whereas nontreated skin cutaneous carotenoids already increased during the steroid treatment phase (Table 6). Table 6Mean value and SD of carotenoid concentration (a.u.) at baseline, day 29 (at the eoT), and day 36 (7 days after eoT) determined by RRS.1 4.DiscussionThe reduction in skin thickness observed in this study corresponds to the known atrophic effect of corticosteroids demonstrated in previous studies.36–38 Moreover, the comparative analysis of skin atrophy using different high-resolution techniques provided more precise in vivo data regarding the different skin layers compared to histological investigations. Here, atrophic structural changes were shown in different skin layers: stratum corneum, epidermis, and dermis. In this study, reduction of skin thickness was also observed in vehicle-treated and nontreated skin areas. The reduction in epidermal and full skin thickness correlates to previous known data about systemic effects of topical applied corticosteroids measured by OCT.13 The obtained reduction of stratum corneum thickness after the treatment with petrolatum is on one hand contrary to the known data showing that petrolatum induces a significant swelling of the stratum corneum39 due to its strong occlusional effect.40 It is on the other hand explicable by systemic atrophic effects of topical corticosteroids. Petrolatum served as a vehicle basic formulation for both applied corticosteroids in this study. Since the decrease in stratum corneum thickness was observed in petrolatum treated skin, as well as untreated skin, the swelling effect of petrolatum seems to be neglectable. Furthermore, a lateral spreading effect of topically applied steroids is another potential influence factor, which was tried to be avoided by daily application of all ointments by trained medical staff. An abrasive effect by the daily rubbing application of the ointments might have contributed to the increasing number of subjects with signs of abraded skin, since morphological changes of the skin surface by friction can be sensitively detected by LSM without clinical changes of the skin. The high proportion of subjects with damaged skin in GC-treated sites at day 36, 7 days after eoT, although, was unexpected and might indicate a possible rebound-effect, which is well known due to the abrupt cessation of GC treatment.41 Corresponding to previous in vitro and in vivo studies, keratinocyte size was reduced after steroid treatment in vivo, and this effect was also observed in vehicle-treated and nontreated skin sites. The increased cell density in epidermal layers after steroid treatment seems to contrast with earlier reports on antiproliferative effects of steroids and an overall loss of cells in vitro and in vivo.36,41–43 It can be assumed that a reduction of the total number of cells occurs with a simultaneously increasing cell density due to the loss of intercellular matrix and ground substance, resulting in an overall reduction of epidermal and dermal tissue volume. The nucleus-to-cytoplasm ratio has often been used to describe differences in cell morphology. Here, the increase in nucleus-to-cytoplasm-ratio after GC, especially CP treatment, might be an effect of GC-induced atrophic changes.44 Corresponding MPT data on an increase in nucleus-to-cytoplasm ratio has been published previously for inflammatory, hyperplastic, or dysplastic skin lesions in comparison to pathohistological sections.29 The cell nucleus visibility was increased in all skin sites at days 29 and 36. This can be explained by the reduction of stratum corneum thickness, enhanced transparency, or structural changes comparable to parakeratosis. Both, MPT and CLSM provide a high resolution on a cellular level, and CLSM measurements are very suitable to visualize the corneocytes and skin barrier disruptions using the fluorescence mode in combination with a dye. With increasing depth, keratinocyte structures can hardly be seen due to the loss of resolution. Cell nuclei are difficult to see and even cell borders are not always distinguishable. Therefore, cell nuclei and morphologic changes in the epidermal layers, especially in the viable epidermis, can be evaluated with a notably higher precision using MPT. Numerous in vitro studies showed the reduction in collagen fibers that correlates to the clinical atrophic appearance after long-term steroid treatment.8,36 A decrease of the SAAID in age-atrophic skin in vivo was shown in previous investigations.24 Here, an increase in collagen signal intensities and a subsequent increase of SAAID values was observed, which seems to contradict these previous data. The findings of this study can be explained by a reorientation of the fibrous network to a more compressed structure. Using electron microscopy, Lehmann et al.8 had shown that 6 weeks of occlusive CP treatment lead to a loss in ground substance and reorientation of collagen fibers. While collagen fibers of healthy skin were randomly oriented bundles with separating voids, 6 weeks of occlusive steroid treatment led to a fibrous network with an orientation rather parallel to the skin surface and lacking interfibrous ground substance and voids. The topical application of CP and BDP seems to induce a reorientation of collagen fibers to a more compressed structure, resulting in the loss in total volume explaining the observed increase in collagen concentration and, as a result, in SAAID in the dermis. Steroid treatment affects the cell metabolism that can induce the increased generation of free radicals. Since free radicals and antioxidants of the skin are at equilibrium, the development of oxidative stress can be seen by the decline in carotenoid concentrations in the epidermis. Here, the steroid treatment itself or mechanical friction might cause the decrease in carotenoids. Furthermore, inflammatory processes especially due to the rebound effect can lead to the generation of free radicals. Moreover, nontreated skin exhibited even increasing antioxidant levels at day 29 and day 36, while both steroid-treated areas showed a significant decrease at day 29 and only partial recovery at day 36. Inferred from the results in nontreated skin at days 29 and 36, it can be assumed that higher amounts of antioxidants are provided by the organism in order to compensate a high radical production in steroid-treated areas as part of a regenerative mechanism of the skin. The investigation of atrophic, morphological, and antioxidative changes in human skin after steroid treatment was conducted on the volar forearm to avoid additional external influence factors, such as sun exposure, mechanical friction, or occlusion. These results may be comparable to other body parts; skin thicknesses vary depending on body sites, and steroids are known to have stronger effects in intertriginous areas. A confirmatory study including a higher number of subjects and treatment on different skin areas is needed to further investigate the results found in this study. DisclosuresMads Almose Røpke and Claus Bang Pedersen are employees at Leo Pharma, who funded the study. ReferencesL. Kolbe et al.,
“Corticosteroid-induced atrophy and barrier impairment measured by non-invasive methods in human skin,”
Skin Res. Technol., 7
(2), 73
–77
(2001). http://dx.doi.org/10.1034/j.1600-0846.2001.70203.x Google Scholar
J. S. Kao et al.,
“Short-term glucocorticoid treatment compromises both permeability barrier homeostasis and stratum corneum integrity: inhibition of epidermal lipid synthesis accounts for functional abnormalities,”
J. Invest. Dermatol., 120
(3), 456
–464
(2003). EXDEEY 0906-6705 Google Scholar
H. M. Sheu, H. S. Yu and T. C. Sheen,
“Histochemical and ultrastructural studies on cutaneous side effects due to topical corticosteroids. I, Changes in epidermis,”
Dermatol. Sin., 7 143
–153
(1989). Google Scholar
T. Kimura and K. Doi,
“Dorsal skin reactions of hairless dogs to topical treatment with corticosteroids,”
Toxicol. Pathol., 27
(5), 528
–535
(1999). http://dx.doi.org/10.1177/019262339902700506 Google Scholar
A. K. Langton et al.,
“A new wrinkle on old skin: the role of elastic fibres in skin ageing,”
Int. J. Cosmet. Sci., 32
(5), 330
–339
(2010). http://dx.doi.org/10.1111/j.1468-2494.2010.00574.x Google Scholar
C. M. Mills and R. Marks,
“Side effects of topical glucocorticoids,”
Curr. Probl. Dermatol., 21 122
–131
(1993). http://dx.doi.org/10.1159/issn.1421-5721 Google Scholar
H. Saarni and V. K. Hopsu-Havu,
“The decrease of hyaluronate synthesis by anti-inflammatory steroids in vitro,”
Br. J. Dermatol., 98
(4), 445
–449
(1978). http://dx.doi.org/10.1111/j.1365-2133.1978.tb06539.x Google Scholar
P. Lehmann et al.,
“Corticosteroid atrophy in human skin. A study by light, scanning, and transmission electron microscopy,”
J. Invest. Dermatol., 81
(2), 169
–176
(1983). http://dx.doi.org/10.1111/1523-1747.ep12543603 Google Scholar
J. Lademann et al.,
“Cutaneous carotenoids: the mirror of lifestyle?,”
Skin Pharmacol. Physiol., 27
(4), 201
–207
(2014). http://dx.doi.org/10.1159/000357222 Google Scholar
M. E. Darvin et al.,
“Influence of sun exposure on the cutaneous collagen/elastin fibers and carotenoids: negative effects can be reduced by application of sunscreen,”
J. Biophotonics, 7
(9), 735
–743
(2014). http://dx.doi.org/10.1002/jbio.v7.9 Google Scholar
R. Patel et al.,
“Disruptive effects of glucocorticoids on glutathione peroxidase biochemistry in hippocampal cultures,”
J. Neurochem., 82
(1), 118
–125
(2002). http://dx.doi.org/10.1046/j.1471-4159.2002.00948.x JONRA9 0022-3042 Google Scholar
L. P. Reagan and B. S. McEwen,
“Controversies surrounding glucocorticoid-mediated cell in the hippocampus,”
J. Chem. Neuroanat., 13
(3), 149
–167
(1997). http://dx.doi.org/10.1016/S0891-0618(97)00031-8 JCNAEE 0891-0618 Google Scholar
M. Cossmann and J. Welzel,
“Evaluation of the atrophogenic potential of different glucocorticoids using optical coherence tomography, 20-MHz ultrasound and profilometry; a double-blind, placebo-controlled trial,”
Br. J. Dermatol., 155
(4), 700
–706
(2006). http://dx.doi.org/10.1111/bjd.2006.155.issue-4 BJDEAZ 0007-0963 Google Scholar
R. M. Williams, W. R. Zipfel and W. W. Webb,
“Interpreting second-harmonic generation images of collagen I fibrils,”
Biophys. J., 88
(2), 1377
–1386
(2005). http://dx.doi.org/10.1529/biophysj.104.047308 BIOJAU 0006-3495 Google Scholar
M. Strupler et al.,
“Second harmonic imaging and scoring of collagen in fibrotic tissues,”
Opt. Express, 15
(7), 4054
–4065
(2007). http://dx.doi.org/10.1364/OE.15.004054 OPEXFF 1094-4087 Google Scholar
P. Stoller et al.,
“Polarization-modulated second harmonic generation in collagen,”
Biophys. J., 82
(6), 3330
–3342
(2002). http://dx.doi.org/10.1016/S0006-3495(02)75673-7 BIOJAU 0006-3495 Google Scholar
P. J. Su et al.,
“Discrimination of collagen in normal and pathological skin dermis through second-order susceptibility microscopy,”
Opt. Express, 17
(13), 11161
–11171
(2009). http://dx.doi.org/10.1364/OE.17.011161 OPEXFF 1094-4087 Google Scholar
Y. Sun et al.,
“Investigating mechanisms of collagen thermal denaturation by high resolution second-harmonic generation imaging,”
Biophys. J., 91
(7), 2620
–2625
(2006). http://dx.doi.org/10.1529/biophysj.106.085902 BIOJAU 0006-3495 Google Scholar
T. Yasui, Y. Tohno and T. Araki,
“Characterization of collagen orientation in human dermis by two-dimensional second-harmonic-generation polarimetry,”
J. Biomed. Opt., 9
(2), 259
–264
(2004). http://dx.doi.org/10.1117/1.1644116 JBOPFO 1083-3668 Google Scholar
V. Da Costa et al.,
“Nondestructive imaging of live human keloid and facial tissue using multiphoton microscopy,”
Arch. Facial Plast. Surg., 10
(1), 38
–43
(2008). http://dx.doi.org/10.1001/archfacial.2007.18 Google Scholar
K. R. Cutroneo, R. Rokowski and D. F. Counts,
“Glucocorticoids and collagen synthesis: comparison of in vivo and cell culture studies,”
Collagen Relat. Res., 1
(6), 557
–568
(1981). http://dx.doi.org/10.1016/S0174-173X(81)80037-4 Google Scholar
P. Nuutinen et al.,
“Glucocorticoid action on skin collagen: overview on clinical significance and consequences,”
J. Eur. Acad. Dermatol. Venereol., 15
(4), 361
–362
(2001). http://dx.doi.org/10.1046/j.0926-9959.2001.00272-4.x JEAVEQ 0926-9959 Google Scholar
M. Bonta, L. Daina and G. Mutiu,
“The process of ageing reflected by histological changes in the skin,”
Rom. J. Morphol. Embryol., 54
(3), 797
–804
(2013). RRMEEA 1220-0522 Google Scholar
M. J. Koehler et al.,
“In vivo assessment of human skin aging by multiphoton laser scanning tomography,”
Opt. Lett., 31
(19), 2879
–2881
(2006). http://dx.doi.org/10.1364/OL.31.002879 OPLEDP 0146-9592 Google Scholar
M. E. Darvin et al.,
“Comparison of in vivo and ex vivo laser scanning microscopy and multiphoton tomography application for human and porcine skin imaging,”
Quantum Electron., 44
(7), 646
–651
(2014). http://dx.doi.org/10.1070/QE2014v044n07ABEH015488 QUELEZ 1063-7818 Google Scholar
S. Schuh et al.,
“Comparison of different optical coherence tomography devices for diagnosis of non-melanoma skin cancer,”
Skin Res. Technol., 22
(4), 395
–405
(2016). http://dx.doi.org/10.1111/srt.2016.22.issue-4 Google Scholar
M. C. Meinke et al.,
“Characterization of atopic skin and the effect of a hyperforin-rich cream by laser scanning microscopy,”
J. Biomed. Opt., 20
(5), 051013
(2015). http://dx.doi.org/10.1117/1.JBO.20.5.051013 JBOPFO 1083-3668 Google Scholar
T. Vergou et al.,
“Comparison between TEWL and laser scanning microscopy measurements for the in vivo characterization of the human epidermal barrier,”
J. Biophotonics, 5
(2), 152
–158
(2012). http://dx.doi.org/10.1002/jbio.201100067 Google Scholar
M. Klemp et al.,
“Comparison of morphologic criteria for actinic keratosis and squamous cell carcinoma using in vivo multiphoton tomography,”
Exp. Dermatol., 25
(3), 218
–222
(2016). http://dx.doi.org/10.1111/exd.12912 Google Scholar
S. Springer et al.,
“Optimization of the measurement procedure during multiphoton tomography of human skin in vivo,”
Skin Res. Technol., 22
(3), 356
–362
(2016). http://dx.doi.org/10.1111/srt.2016.22.issue-3 Google Scholar
S. F. Haag et al.,
“Determination of the antioxidative capacity of the skin in vivo using resonance Raman and electron paramagnetic resonance spectroscopy,”
Exp. Dermatol., 20
(6), 483
–487
(2011). http://dx.doi.org/10.1111/j.1600-0625.2010.01246.x EXDEEY 0906-6705 Google Scholar
M. C. Meinke et al.,
“Influence of dietary carotenoids on radical scavenging capacity of the skin and skin lipids,”
Eur. J. Pharm. Biopharm., 84
(2), 365
–373
(2013). http://dx.doi.org/10.1016/j.ejpb.2012.11.012 EJPBEL 0939-6411 Google Scholar
M. E. Darvin et al.,
“Noninvasive detection of beta-carotene and lycopene in human skin using Raman spectroscopy,”
Laser Phys., 14
(2), 231
–233
(2004). LAPHEJ 1054-660X Google Scholar
S. Vandersee et al.,
“Blue-violet light irradiation dose dependently decreases carotenoids in human skin, which indicates the generation of free radicals,”
Oxid. Med. Cell. Longevity, 2015 579675
(2015). http://dx.doi.org/10.1155/2015/579675 Google Scholar
M. E. Darvin et al.,
“Optical methods for noninvasive determination of carotenoids in human and animal skin,”
J. Biomed. Opt., 18
(6), 061230
(2013). http://dx.doi.org/10.1117/1.JBO.18.6.061230 JBOPFO 1083-3668 Google Scholar
S. Schoepe et al.,
“Glucocorticoid therapy-induced skin atrophy,”
Exp. Dermatol., 15
(6), 406
–420
(2006). http://dx.doi.org/10.1111/exd.2006.15.issue-6 Google Scholar
L. Barnes, G. Kaya and V. Rollason,
“Topical corticosteroid-induced skin atrophy: a comprehensive review,”
Drug Saf., 38
(5), 493
–509
(2015). http://dx.doi.org/10.1007/s40264-015-0287-7 DRSAEA 0114-5916 Google Scholar
H. A. El Madani et al.,
“In vivo multiphoton imaging of human skin: assessment of topical corticosteroid-induced epidermis atrophy and depigmentation,”
J. Biomed. Opt., 17
(2), 026009
(2012). http://dx.doi.org/10.1117/1.JBO.17.2.026009 Google Scholar
C. Choe, J. Lademann and M. E. Darvin,
“Analysis of human and porcine skin in vivo/ex vivo for penetration of selected oils by confocal Raman microscopy,”
Skin Pharmacol. Physiol., 28
(6), 318
–330
(2015). http://dx.doi.org/10.1159/000439407 Google Scholar
A. Patzelt et al.,
“In vivo investigations on the penetration of various oils and their influence on the skin barrier,”
Skin Res. Technol., 18
(3), 364
–369
(2012). http://dx.doi.org/10.1111/srt.2012.18.issue-3 Google Scholar
A. Coondoo et al.,
“Side-effects of topical steroids: a long overdue revisit,”
Indian Dermatol. Online J., 5
(4), 416
–425
(2014). http://dx.doi.org/10.4103/2229-5178.142483 Google Scholar
A. Abraham and G. Roga,
“Topical steroid-damaged skin,”
Indian J. Dermatol., 59
(5), 456
–459
(2014). http://dx.doi.org/10.4103/0019-5154.139872 IJDEAA 0019-5154 Google Scholar
U. R. Hengge et al.,
“Adverse effects of topical glucocorticosteroids,”
J. Am. Acad. Dermatol., 54
(1), 1
–15
(2006). http://dx.doi.org/10.1016/j.jaad.2005.01.010 JAADDB 0190-9622 Google Scholar
J. Q. Del Rosso and K. Cash,
“Topical corticosteroid application and the structural and functional integrity of the epidermal barrier,”
J. Clin. Aesthetic Dermatol., 6
(11), 20
–27
(2013). Google Scholar
BiographySora Jung studied medicine at Charité-Universitätsmedizin Berlin, Germany and Université Denis Diderot Paris, France. After a research stay at Dartmouth Medical School, USA, and at the World Health Organization headquarters in Geneva, Switzerland, she has been working as resident and research assistant at the Department of Dermatology, Venerology, and Allergology at Charité-Universitätsmedizin Berlin. Her main research focuses on the interaction of antioxidants and free radicals in the skin, clinical, and cosmetic studies and preventive strategies of chemotherapy-induced palmoplantar erythrodysesthesia. Jürgen Lademann studied at the Quantum Electronics Department of the Physics, Moscow State University, Russia, where he completed his master’s degree. In the year 2000, he was appointed as a professor of dermatology at the Charité-Universitätsmedizin Berlin, Germany. He is an editor of the international journal “Skin Pharmacology and Applied Skin Physiology” and board member of the German Federal Institute of Risk Assessment, Berlin, Germany. Maxim E. Darvin studied at the Moscow State Engineering Physics Institute, Faculty of Experimental and Theoretical Physics, Department of Medical Physics, where he completed his master’s degree in physics. After a postgraduate study, he was awarded the titles Dr. rer. med. in 2007 at the Humboldt University of Berlin, Germany and Dr. rer. nat. in 2010 at the Saratov State University, Russia. His main interests are medical physics, laser techniques, quantum electronics, spectroscopy, biophysics, and skin physiology. Claudia Richter received her master’s degree in English philology from the University of Halle-Wittenberg in 2007 and worked as study coordinator of clinical studies in the field of dermatology. In 2014, she started her PhD at the Clinical Research Center for Hair and Skin Science at the Department of Dermatology and Allergy at the Charité-Universitätsmedizin Berlin. Her research focuses on skin barrier function, skin physiological measurement techniques, and dermatological disorders, e.g., acne vulgaris. Claus Bang Pedersen graduated in statistics and mathematics as cand.scient. at Aarhus University. He has currently been working since 2003 in medical and pharmaceutical research in industry and academia. Heike Richter was trained as a communications engineer. From 1990 to 1991 she underwent professional development as a technical assistant (physics). From 1986 to 1991, she worked at the Academy of Sciences. Since 1992, she has been working with the Center of Experimental and Applied Skin Physiology of the Department of Dermatology at the Charité-Universitätsmedizin Berlin. Her main focus is on optical and spectroscopic investigations. Sabine Schanzer studied at the Berlin University of Applied Sciences and graduated as a chemical engineer, specialized in organic and inorganic chemistry, in 1987. From 1980 to 1991, she worked at the Academy of Sciences in Berlin. In 1992, she joined the Center of Experimental and Applied Cutaneous Physiology at the Department of Dermatology at the Charité-Universitätsmedizin Berlin, where she is in-charge of skin physiological measurements as well as cosmetic and clinical studies. Jan Kottner is the scientific director of the Clinical Research Center for Hair and Skin Science in the Department of Dermatology and Allergy at the Charité-Universitätsmedizin Berlin. His research interests are skin barrier maintenance, protection, restoration, and skin problems and skin care interventions in aged and care-dependent subjects. He also has special expertise in the development and validation of clinical diagnoses, classifications, scores, and outcomes. Ulrike Blume-Peytavi is a full university professor and the acting director in the Department of Dermatology and Allergy at the Charité-Universitätsmedizin Berlin. She is the director of the Clinical Research Center for Hair and Skin Science. In 2013, she became the president of the German association of pediatric dermatology. Her research focuses on skin and hair physiology, pediatric dermatology, follicular targeting, and transcutaneous vaccination. Mads Almose Røpke graduated as human biologist from the University of Copenhagen. After finishing his PhD, he completed a post doc in cellular immunology. In 1996, he joined DAKO, where he developed diagnostics and precision medicine assays in oncology. In 1999, he moved to Maxygen working in discovery and clinical pharmacology. Since 2007, he has been working at LEO Pharma as a senior scientist in Translational Medicine being responsible for developing biomarker strategies in drug development programs within inflammatory skin diseases. |
|||||||||||||||||||||||||||||||||||||||||||||||||||||||||||||||||||||||||||||||||||||||||||||||||||||||||||||||||||||||||||||||||||||||||||||||||||||||||||||||||||||||||||||||||||||||||||||||||||||||||||||||||||||||||||||||||||||||||||||||||||||||||||||||||||||||||||||||||||||||||||||||||||||||||||||||||||||||||||||||||||||||||||||||||||||||||||||||||||||||||||||||||||||||||