1.IntroductionIn the clinical environment, optical techniques (microscope, ophthalmoscope, endoscope, and colposcope) have been used for hundreds of years.1 2 3 4 5 The integration of spectroscopic devices into existing optical examinations has the potential to substantially improve clinical practice. Fiber optic cables provide a flexible solution for an adequate optical interface between the spectroscopic device and the sample to be interrogated in situ. Fiber optic probes can be advanced into cavities and tubular structures, put in contact with epithelial surfaces, and inserted into structures that can be punctured by rigid devices such as needles. Fiber optic devices for optical spectroscopy can be manufactured as flexible catheters with an outer diameter of less than 0.5 mm. This paper reviews fiber optic probes for fluorescence and elastic and inelastic scattering spectroscopy of turbid tissues. After describing the fiber optic interface, we describe probes for reflectance spectroscopy (diffuse reflectance and polarized reflectance), probes for fluorescence measurements, probes that combine fluorescence and reflectance measurements, and probes for Raman spectroscopy. Finally, we review optical designs for side-looking probes, diffuser tips, and refocusing optics. The fiber optic probes in this paper are discussed with a biomedical application in mind. Probes with sensing elements for indirect measures such as pH and temperature are not reviewed here. 2.Fiber Optic InterfaceA spectroscopic system incorporates a light source, an optical analyzer with a detector, and a light transport conduit, which, in many cases, is made of fiber optic cables. A separate illumination and collection channel minimizes background signals produced in the illumination fiber [Figure 1(a)]. The excitation or illumination light source is typically a laser or a filtered white light source, such as a xenon or mercury lamp. Dielectric bandpass filters, monochromators, or double monochromators can be used as filters according to the requirements for spectral purity. For fluorescence excitation with bandpass filters, xenon lamps with more than 150 W power consumption require additional mirrors removing infrared (IR) light from the beam path (a cold mirror is used if the mirror deflects the main beam path by 90 deg) to protect the optical parts from excessive radiation. Pulsed light sources, such as lasers (e.g., nitrogen-pumped dye laser and optical parametric oscillators) or arc lamps release photons in short bursts and, combined with a gated detector, enable measurements under ambient light conditions. The coupling optics adapt the f -number of the light source to the numerical aperture of the fiber and guarantee optimal irradiance into the fiber. Laser radiation can be focused on a small spot compared to the imaging of a light source arc onto a fiber bundle. The probe transports the remitted light from the tissue to the spectroscopic system. New techniques, such as holographic transmission gratings (Holospec, Kaiser Optical Systems Inc, Ann Arbor, Michigan) and back-illuminated thinned charge-coupled devices (CCDs) with high quantum efficiencies, enable short integration times and sufficient spectral and spatial resolution. Additional filter stages that are placed in front of the spectrograph reduce the influence of stray light originating from the excitation light source. For fluorescence applications, this filter stage holds long-pass filters, and, for Raman spectroscopy, holds notch filters. Figure 1(a) Fiber optic-based spectroscopy system with separate illumination and collection path is based on an excitation source, which is a laser, a white light source (reflectometry), or a monochromator filtered arc lamp (fluorescence). Optical elements couple the excitation light into the flexible probe, a probe collects the emitted light, coupling optics adapt the numerical aperture of the probe to the spectrograph or filter system, and an optical detector (CCD, photodiode array, or photomultiplier tube) is read out and digitized.6 (b) Fiber optic spectroscopy system with a probe that incorporates one optical fiber requires a dichroic beamsplitter and well-aligned optics to separate excitation and fluorescence light.6  To achieve the smallest probe diameters, single fiber solutions are used in combination with a dichroic beamsplitter and well-aligned coupling optics [Figure 1(b)]. Single-fiber solutions are limited because of the difficulty of reducing backscattered excitation and illumination light at the fiber coupling site, and the suppression of autofluorescence induced in the fiber optic cable by excitation light. Nevertheless, single-fiber-based probes require a minimal amount of components for the probe and can be used to create the smallest illumination spots as well as having excellent light collection efficiency. 2.1.Fiber Optic LightguidesAn optical fiber for spectroscopy consists of a core, a doped cladding, and a protective jacket. Light is transmitted based on the principle of total internal reflection. The half-angle (α) of the light cone that a fiber can accept is characterized by the numerical aperture (NA), which is defined by the difference in the refractive indices (n) of the core and the cladding material (Figure 2): Figure 2Fiber optic cable for spectroscopy consists of a core and a cladding with a lower refractive index and a rugged supportive jacket. Light is transported by total internal reflection. The light acceptance angle of the fiber (α) is defined by the refractive indices of the media, core, and cladding (n media , n core , n cladding ) . 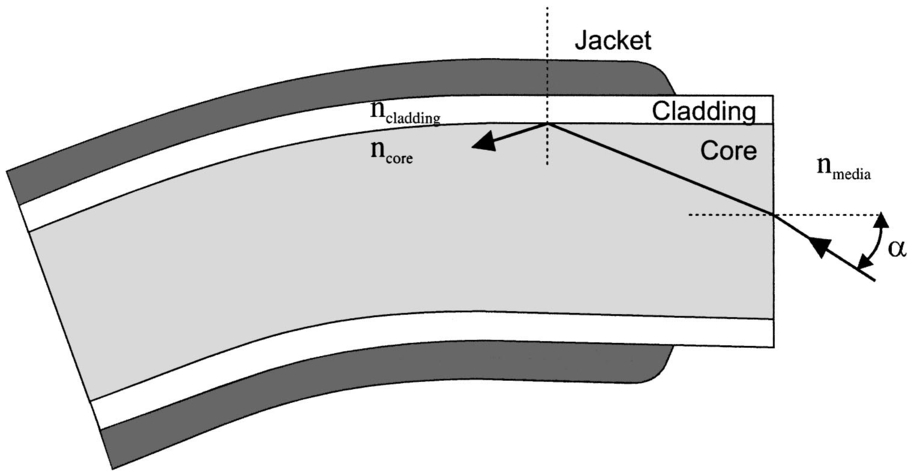 For transmission in the visible wavelength range, the optical fiber core is made out of glass or plastic (e.g., acrylic or polystyrene). The doped cladding is usually made of a similar material but with a lower refractive index. Since light is not propagating in the cladding, losses due to absorption are less important. As soon as background signals introduced by the fiber itself become critical for the application, or the wavelength range must be extended to the ultraviolet (UV) and infrared (IR), high-grade fused silica are used for the core material. All-silica fibers have a doped silica cladding, while plastic clad fibers have a silicone cladding. Optimized fiber preform manufacturing7 8 9 10 11 enables transmittance from 200 nm (solarization-resistant-UV grade fiber, Polymicro Technologies Inc., Phoenix, Arizona, or Ceramoptec, East Longmeadow, Massachusetts) up to 2500 nm (low-hydroxyl fiber) and sapphire fibers (Saphikon, Milford, New Hampshire) extend the transmission in the IR above 3000 nm. This enables the application of fiber optic probes for UV resonance Raman (UVRR) and IR Raman spectroscopies.12 Due to bending of the fibers and defects in the fibers causing scattering, light may exit the core and hit the jacket. Most plastic jackets, such as Nylon and Tefzel®, produce significant autofluorescence when irradiated with UV light. Polyimide- and metal-coated fibers, such as gold and aluminum, exhibit minimal fluorescence. During intense UV irradiation, defects may form in quartz fibers that are accompanied by autofluorescence in a broad band at13 both 450 and 650 nm. The formation of these defects is partly reversible through diffusion processes occurring in the quartz glass. It is further known that silica produces intrinsic Raman signals at near-IR (NIR) excitation which interfere with in vivo Raman spectroscopy. If background signals in spectroscopic measurements are present, the dynamic range of the detector can become critical.14 For spectroscopic applications, multimode fibers with core diameters of 50 to 600 μm are usually used. Short pieces (1 to 2 m) of fibers with larger diameters can be produced in custom runs. The bending radius of quartz fibers in which no long-term defects result is approximately 100 times the fiber diameter and the momentary bending radius is approximately 50 of the long-term bending radius. 2.2.Fiber PackingTo manufacture flexible fiber optic cables with a large optically active area, fibers with diameters of 100 to 200 μm are packed into bundles. The amount of fibers (n fiber ) that can be packed into a round cross section is illustrated in Figure 3. If fibers are packed hexagonally, according to ring a in Figure 3, the number of fibers is determined with where m is the amount of rings around a central fiber. The total outer diameter (OD) is calculated by For hexagonal packing with additional fibers, according to ring b in Figure 3, Eq. (2) changes to and the total OD is calculated by However, this is based on optimal arrangement of fibers, which usually is not achieved under real manufacturing conditions. For a given bundle cross section, the dead space (inactive area) in between the fibers increases when the fiber diameter is reduced and reaches an upper value of 25 when more then three fiber rings are used (leaving the bundle diameter constant). The inactive area additionally includes the area of the cladding and the jacket, which normally consumes more than 30 of the individual fiber cross section. If the jacket is stripped, this inactive area is reduced and the cladding accounts for approximately 17 of the fiber cross section. This leaves a total active area of approximately 60 to 65 in a tightly packed and optimized fiber bundle with stripped jacket material.2.3.Beveled versus Flat Exit SurfaceTo ensure optimal coupling, the end of the fiber optic cable is cleaved or polished. If the exit surface is polished with an oblique angle with respect to the fiber axis, the output will be deflected [Figures 4(a) to 4(c)] (beveled fibers). If the critical angle for total internal reflection is reached, the light will leave the fiber through the cylindrical side15 16 17 [Figures 4(d) and 4(e)]. The critical angle [Figure 4(d)] for the silica-air interface is 43.3 deg and for the silica-water interface is 66 deg. A fiber with a combination of a beveled and a flat polished tip18 (Gaser Technology, Visionex Inc., Georgia; product no longer available) can also be used for deflection [Figure 4(f)] as one part of the beam exits in the direction of the fiber axis while another part is guided sideways. To enable a larger range of steering angle, the beveled surface of the fibers can alternatively be coated (e.g., aluminum). Figure 4(a) Output of an optical fiber is described by the opening half angle α or the NA; (b) and (c) oblique polishing of the fiber tip deflects the output beam; (d) when total internal reflection is achieved for a part of the light, the output will be split into two parts, one exiting in the axial direction and the other in the radial direction; (e) when all light is totally internally reflected at the fiber end surface or the beveled end surface is reflectively coated, light leaves the fiber through the side wall; (f) a fiber based on a combination of a beveled and flat polished surface has a partially deflected output beam; (g) a fiber optic probe that illuminates and collects through the same fiber has the highest collection efficiency; (h) a dual-fiber bundle is used for many spectroscopy application, and this concept can be easily extended to hexagonal packed fiber bundles; (i) a dual-fiber probe based on beveled fibers achieves a better collection efficiency compared to the flat tip dual fiber configuration, while collection and illumination channels are still separated; (j) fiber probes based on a fiber with a combination of a flat tip and a beveled surface have excellent collection efficiencies; and two probe designs for submersion (k) and measurements on surfaces (l). Here a central fiber (labeled a) illuminates the sampling volume or the surface and six surrounding fibers (labeled b) collect the emitted light. Collection and illumination channels are interchangeable. Housing with a thin shield (quartz, sapphire) enables a constant sampling distance for surface measurements.6  Beveled fiber applications for probe designs have been theoretically and experimentally analyzed by Cooney et al.;19 20 The sensitivity and sampling volume of beveled fibers was compared to other designs, such as single fibers [Figure 4(g)] flat tipped probes [Figure 4(h)], and probes with lenses. The sensitivity and sampling volume were measured in a clear medium and results were reported for the collection of Raman-scattered light and are also applicable for fluorescence collection. A probe consisting of two beveled fibers [Figure 4(i)] is at least by a factor of 1.5 more efficient than a dual fiber with a flat tip probe (NA=0.22) and the sampling volume is smaller and located closer to the probe tip. A single fiber probe [Figure 4(g)] is 1.8 to 4 times more efficient, depending on fiber diameter, than a dual fiber with a flat tip probe [Figure 4(h)]. The efficiency of a “Gaser-type” collection fiber [Figure 4(f), 300-μm core] combined with a flat tip illumination fiber [Figure 4(j), 400-μm core] were measured by Shim et al.;18 with a sapphire Raman standard. Two configurations were considered. First, the light deflection angle of the “Gaser” fiber was between 13 and 32 deg (low deflection), and second, the deflection angle was between 35 and 55 deg (high deflection). Compared to a flat tip probe, Shim et al.; found that, in air, a low deflection probe measures a 4 times and the high deflection probe a 16 times increased signal. In water, the factors were 6.5 and 28, respectively. Similar values were found in 0.25 and 0.50 Intralipid™ solution. For a flat tip probe with a 400-μm illumination fiber and a 300-μm pickup fiber, maximal signal was picked up at a distance between 1.7 and 1.4 mm from the tip in water or in the Intralipid™ solution. The low deflection probe received the largest signal at a distance of approximately 0.5 mm, and the high deflection probe at 0.25 mm from the fiber tip in water or the Intralipid™ solution. The concept of dual-fiber arrangement for separate illumination and collection can easily extend to a multifiber design, as shown in Figures 4(k) and 4(l). The sampling volume of a single excitation fiber overlaps with concentrically arranged collection fibers. Six collection fibers can be arranged around a single illumination fiber, which is equivalent to six dual-fiber arrangements. To construct the probe tip, the fiber bundle is glued together and polished to a cone shape by rotating the probe axially while polishing. This design can be optimized for immersed operation [Figure 4(k)] or for the interrogation of a surface [Figure 4(i)]. For surface measurements, the tip needs to be enclosed and a quartz or sapphire window placed at the distal end [Figure 4(i)]. In general, collection and illumination channels are exchangeable. 2.4.Material Choice and Safety ConsiderationsAll fiber optic probes in this paper are reviewed and presented with a biomedical application in mind. The probe tip is either at a close distance to or in contact with the tissue surface or body fluids and, therefore, should be analyzed for potential hazards. An analysis of potential risks and protection against those risks is a requirement of human subject studies funded by the National Institutes of Health (NIH). A guidance document, which is also helpful for the evaluation of hazards of fiber optic probes, was developed by the U.S. Food and Drug Administration (FDA) for electro-optical detection of cervical cancer.21 The list of potential adverse events that are applicable to the use of fiber optic probes are optical radiation hazards, thermal hazards, electrical shock hazards, clinical hazards (transmission of diseases), and material toxicity hazards. According to a general evaluation of medical devices,22 fiber optic probes are most likely categorized as transient surface or transient external communicating devices and their materials should be tested for cytotoxicity, sensitization, and irritation, and depending on the application, for acute systemic toxicity. If the fiber optic probe is made of materials that have been well characterized in published literature and have a history of safe use, there is adequate justification to not conduct some or all of the suggested tests. Optical threshold limit values (TLV) or maximum permissible exposure (MPE) have been established to assist in the control of health hazards23 24 by the American Conference of Governmental Hygienists (ACGIH) and the American National Standard Institute (ANSI). The biologically effective radiation (device emission weighted by the action spectrum, which is normalized at 270 nm) should not exceed the TLV for skin and eye (which is 3 mJ/cm 2 at 270 nm for non-laser-based devices). The TLV for skin and eye has also been recommended for the cervix. Potential temperature increases should be evaluated using endpoints or by potential peak tissue temperature. Since materials (fused silica, acrylic, polystyrene, or silicone) used for fiber manufacturing are good electric isolators, a fiber optic probe with minimal shock hazard can be manufactured. To avoid clinical hazards, such as the transmission of diseases, the fiber optic probe needs to be disinfected or sterilized prior to its use with common clinical practice. If the fiber optic probe cannot be detached from the spectroscopic equipment, the parts which may be in contact with tissue need to be soaked; for example, in a solution based on 2.4 gluteraldehyde (CIDEX, Advanced Sterilization Products, Irvine, California) or 0.55 orthophthalaldehyde solution (CIDEX OPA). If a fiber optic probe is used during a surgical procedure, it can be covered with sterile drapes developed to cover ultrasound probes. Low-temperature sterilization with ethylene oxide or hydrogen peroxide gas can be applied to a detachable probe. Most critical is the compatibility of the probe materials with the disinfectant. CIDEX OPA is a disinfectant that is compatible with most materials used to manufacture fiber optic probes, including adhesives cyanoacrylate (Super Glue) or Epotek 353 and Epotek 301 (Epoxy Technology, Billerica, Massachusetts). A variety of materials that can be used to enclose the fiber optic probe have been well characterized and their biocompatibility has been previously published in the literature. Safe choices are materials created for implants or materials that were tested for U.S. Pharmacopoeia (USP), class VI. USP, class VI, is a base requirement for medical device manufacturers. A summary of materials that could be used to create fiber optic probes are listed in Table 1. One of the first alloys created for human use was stainless steel type 302 and the corrosion resistance improved25 stainless steel type 316 (hypodermic steel). A large variety of standard tubing diameters and wall thicknesses are available to enclose fiber optic cables and optical elements. Aluminum oxide (Al 2 O 3) is an inert bioceramic and, when grown to a crystal (sapphire), is chemically inert and almost insoluble. Sapphire has a high thermal conductivity and is optically transparent between 200 nm and 3 μm. Epotek produces a variety of glues with excellent transmission (301-2 and 307) and with low autofluorescence (301-2FL) that can be used to bond optical elements within the fiber optic probe. Several glues from Epotek were tested for USP, class VI, and are autoclavable (e.g., 353 and 375). Many thermoplastic polymers have been used in the body, for example, polyethylene (PE), polytetrafluoroethylene (PTFE, Teflon), polymethylmethacrylate (PMMA), and polyester (PET). These materials can be used to create flexible and heat shrink tubing or plastic enclosures for fiber optic probes. High-temperature-resistant polymers include polyimide (220 °C), PTFE (230 °C), and silicone rubber (200 °C). Table 1
3.Reflectance ProbesThe elastically scattered light that escapes the surface of the sampling volume is called reflectance.26 The transport mean free path (MFP) length of a photon in a turbid media is defined as where μa is the absorption coefficient and μs ′ is the reduced scattering coefficient, which represents the isotropic approximation of anisotropic scattering.The reduced scattering coefficient is defined as where g is the average cosine of the scattering angle probability, and μs is the scattering coefficient. The optical properties μs, μa, and g depend on the chemical and structural composition of the sample. The absorption coefficient is a superposition of individual chromophores. Since the major chromophores in tissue are oxy, deoxygenated hemoglobin,27 28 and water, as well as other absorbers such as melanin and bilirubin, it is possible to derive diagnostic parameters from the absorption coefficient, such as total blood concentration and average blood oxygenation.29 The structural composition of the sample is reflected in the shape, structure, size distribution, and concentration of the scattering particles. The reduced scattering coefficient shows a linear dependency with wavelength when transformed in double logarithmic space. The power constant (slope in double log space) is related to the average scattering size,30 31 and the average scattering size may be related in tissue to the ratio of the nucleus to cytoplasm. All these characteristics vary spatially and are wavelength dependent.There are several methods to measure absorption and scattering properties in the time domain, frequency domain, and steady state by analyzing reflected or transmitted light. Here, we focus on steady-state spatially resolved measurements of a reflectance profile from a point source or a narrow collimated light beam. This profile can be measured with a contact fiber optic probe. Measurements with fiber optic probes are simple and inexpensive, however, they require contact to the tissue, which can induce variations because the applied pressure affects local blood content in tissue.32 3.1.Diffuse Reflectance ProbesSeveral recent studies have suggested that differences in the optical properties assessed using diffuse reflectance spectroscopy can be used to discriminate normal and abnormal human tissues in vivo in the urinary bladder,33 34 pancreas,35 esophagus,36 37 colon,38 39 ovaries,40 breast,41 and the skin,42 using simple fiber optic probes. To extract absorption and scattering properties from reflectance measurements, spatially resolved reflectance intensities must be obtained. These data are then fitted to an analytic expression, which is based on diffusion theory with the assumption that the sample is homogenous and semi-infinite.29 32 43 44 When this approximation is compared with Monte-Carlo-based photon propagation simulations,45 46 47 it can shown that at source detector separations smaller than 1/μs (Ref. 43) to 1.5/μs (Ref. 44), significant deviations occur. Therefore, optical properties are normally derived from reflectance profiles measured at six to nine source detector separated locations. For tissue, the separation distances are in the range of 2 to 20 mm. The fiber optic probes used for these studies consist of a single excitation source and several spatially distributed collection fibers [Figures 5(a), 5(b), and 5(c)]. A probe with linear alignment was constructed by Wang and Jacques48 and Lin et al.;49 and places the detection fibers over a range of 1 to 10 MFP [Figure 5(a)]. Bays et al.;50 used a scanning approach with a side-deflected illumination fiber and collection fiber that can be translated axially [Figure 5(b)]. A black mask was printed on the measurement window and defined measurement locations. The scanning range was 27 mm. Alternatively, a circular fiber arrangement [Figure 5(c)] by Nichols et al.;51 enables a simple calibration of the system by placing a source fiber in the center of all fibers. Measuring the spectrally resolved reflectance of all fibers simultaneously requires a dynamic range of four orders of magnitude. Neutral density filters in the fiber optic path reduce the required dynamic range of the detector. Our approach to measure reflectance with a source-detector separation from 200 μm to 3 mm requires three different integration time settings (150 ms and 2 and 9 s), sufficient spacing in between the fibers on the CCD detector to prevent blooming, and an increased number of detection fibers for larger source-detector separations. Fiber tracks are electronically binned on the CCD to detect lower light levels.52 Lin et al.;49 and Marquez and Wang53 modified their linear probe design with an oblique incident source fiber and measured the shift of the reflectance profile. This removes the necessity of measuring in absolute units. All fiber optic probes that measure reflectance profiles in the diffusion regime have a diameter of approximately 2 cm, and the assumption is made that the optical properties do not vary over this range. However, the optical properties of currently investigated target areas (e.g., cervix, ovaries, and oral cavity) vary over orders of millimeters (lesion size), and the organ size is similar to the diameter of the proposed probes. Therefore, an accurate measurement of optical properties from small, premalignant lesions requires other approaches. Figure 5(a) Fiber optic probe for reflectometry. The light scattered from a single excitation fiber is detected by a linearly arranged array of collection fibers. Tilting the excitation fiber shifts the profile along the surface by an amount that is determined by the sample optical properties. The distance between the source and detector fibers must be adjusted for the expected intensity profile sampling.6 (b) Scanning fiber optic probe for reflectance measurements: label a, illumination fiber; label b, SELFOC lens; label c, deflecting prism; and label d, photomask on exit surface (with permission from Ref. 49). (c) Fiber optic probe with a circular fiber arrangement for reflectometry. A 2-cm probe head consists of a central calibration fiber, an illumination fiber, and non–equally spaced fibers. A variable neutral density filter adapts the light intensity in a transfer array to a smaller dynamic range (with permission from Ref. 51 and suggestions from M. Patterson and coworkers). Parts are a, illumination fiber; b, circular probe head; c, calibration fiber; d, detection fibers; e and f, linear transfer array; g, neutral density filter; and h, a spectrograph input ferrule. (d) Fiber optic probe for single point reflectance measurements. Hexagonal packed fibers are randomly assigned for collection (label a) and illumination (label b). An outer tubing (label c) combines the fiber bundle (label d) with a spacing wedge (label e). An absorbing coating (label f) based on carbon powder or black paint absorbs specular reflected light from the tissue glass interface. (e) Polarized reflectance system. White light is transported from the light source with a fiberoptic cable, collimated (label a) and passes a polarizer. Reflectance is collected (label b) with an imaging system. In the collimated beam path, reflectance is filtered with rotatable polarizer (label c) for parallel or cross polarization. (f) Frontal view of a fiber optic polarized reflectance probe. A simple probe consisting of one illumination channel (label a), two detection channels for parallel (label b), and cross-polarized (label c) light detection. (g) Frontal view of a fiber optic polarized reflectance probe. Ideally all four possible polarization combinations are measured. This can be achieved when the illumination fiber (label a) and two detector fibers (labels b and c) covered with the parallel polarization filter and two fibers (labels d and e) with the cross-polarized filter. Note that the intensity of channel (label c) will be lower than channel (label b). (h) Schematic of a backscattering event on a small particle and the intensities associated with various pick up geometries. The scattering probability is indicated by the mesh surface and the distance from the center (particle) to the surface is equivalent with the scattering probability in that direction. Incident light is polarized in vertical direction. Detectors are positioned at the same location as in (f). (i) Simple polarized reflectance probe consists of optical fibers (label a), a mechanical placeholder for the fibers (label b), the polarization filter (label c), a cover glass (label d), and a housing (label e). Two fibers are covered with the same polarization filter while the other fiber is covered with a 90 degrees rotated filter. (j) An assembled version of the probe described in (i). The probe tip consists of three 200-μm-diam fibers. The gap formed by the two perpendicularly oriented polarization filters can be identified in both pictures. (k) To measure at the same spot on a surface, a polarized reflectance probe could be constructed with a conical reflector. There is a large difference in angle of incidence and angle of collection with this design and the polarization state changes at the reflecting surface.  To overcome limitations of the diffusion theory, heuristic approaches, such as Monte-Carlo-trained neural networks32 54 55 were investigated to obtain optical properties. Accurate numerical light propagation can be modeled outside the diffusion regime with various forms of multivariate analyses.56 Also hybrid approaches57 58 were proposed that combine diffusion theory and Monte Carlo calculations to predict reflectance profiles over a wide range of source-detector separations. Recently, Dam et al.;59 presented a probe design with six short source-detector separations between 0.6 and 7.8 mm. The probe measures at four different wavelengths. Using a multiple polynomial regression model, absorption and scattering could be predicted with an error of roughly 3 for absorption and 1.5 for scattering. Bevilacqua et al.;60 and Bevilacqua and Depeursinge61 investigated short source-detector separated reflectance measurements and explained their sensitivity to the scattering phase function. Their probe diameter is 2.5 mm and incorporates eight linearly aligned 300-μm-diam fibers. They found that for source detector separations between 0.5/μs ′ and 10/μs ′, the reflectance profile not only depends on the average cosine of the scattering phase function, but also on the second momentum of the phase function. It is still difficult to determine absorption accurately if only reflectance profiles are available,60 however, if the ratio of second and first momentam is known, absorption and scattering can be derived accurately from the reflectance intensity and the spatial slope of the reflectance intensity profile. Mourant et al.;62 63 showed that for certain source-detector separations, the path length of the collected photons does not depend on scattering parameters. For experimentally verified μa of 0 to 0.86 cm −1, a source-detector separation of approximately 1.75 mm is mainly sensitive to changes in absorption. Scattering parameters for this investigation were in the tissue-relevant range for visible light (7.5<μa ′<15 cm −1 and 0.8<g<0.95) . The NA (0.2 or 0.34) of the fibers did not affect these findings. Drezek et al.;64 found that changes in neoplastic cells mainly affect high scattering angles, which can best be detected with a source-detector separation smaller than 500 μm and an NA of the fibers smaller than 0.4. Both scattering and absorption properties of tissue can contain diagnostic information relevant to tissue pathology. Variations in scattering are due to inhomogeneities in the refractive index; recent results64 65 have shown that tissue backscattering is altered as the size of the nucleus increases and the nuclear texture becomes coarser. In case of spherical scatterers, a periodic structure in the reflectance spectrum is characteristic and depends on relative scattering size and collection and illumination geometry.37 66 This periodic structure can be theoretically derived by evaluating the scattering phase function at the angle corresponding with the angle between illumination and collection direction for every wavelength. A probe to collect data which measures reflectance at a single point is shown in Figure 5(d). A wedge is put in front of a fiber bundle to reduce specular reflection in the detection path.67 Reflected light from the glass-tissue interface is absorbed on the sides of the wedge (black paint or glue mixed with carbon powder). If the angle of the wedge is larger then the acceptance angle of the fiber (e.g., >9 deg for an NA of 0.22), light that is specularly reflected back onto the fiber bundle will reach it with an angle that will not be transported to the detector. 3.2.Polarization Reflectometry ProbesPolarization techniques have been successfully used to gate detection depth in reflectometry. This is particularly interesting because the origin of epithelial neoplastic changes is within the first 100 to 300 μm of tissue and neovascularization originates in deeper tissue layers. Reflectance measured in a parallel-polarized fashion contains mainly light scattered from upper tissue layers, since light from the deeper tissue layers is multiply scattered, which randomizes the polarization status. Light loses its original polarization status after approximately 20 scattering MFP lengths (1/μs) and becomes unpolarized in the diffusing regime.68 69 Cross-polarized reflectance originates from deeper tissue layers since the polarized illumination light must undergo several scattering events until significant components are created in perpendicular polarization direction. Subtracting the perpendicular polarized reflectance from the parallel polarized, removes 90 of light originating from deeper tissue layers.70 Dividing this subtracted reflectance by the sum of the parallel and perpendicular polarized reflectance cancels common attenuation and the spectral characteristics of the light source and detector. Jacques et al.;70 used this technique for polarization imaging to detect basal cell carcinoma in highly pigmented tissues. Syris Scientific, LLC (Gray, Maine) and Cytometrics, Inc. (Philadelphia, Pennsylvania) use an orthogonal polarized imaging technique to enhance signal from deeper tissue layers and to reduce surface specular reflections.71 Fiber optic probes that measure polarized reflectance consist of a polarization-filtered white light source and a polarization-filtered detection system with an optical multichannel analyzer [Figure 5(e)]. Since multimode fibers do not conserve the polarization status of light, the polarization filters must be placed at the fiber optic probe tip. Johnson and Mourant72 presented a system that measures reflected light at four positions through a linear polarizer. Linear polarizing laminated film (Edmund Scientific, Barrington, New Jersey) was placed in front of the fibers. Suppression of different polarization modes was in the order of 98 to 99. Ideally, in a polarization filtered probe, two or more pieces of polarization film are placed on the probe tip [as shown in Figures 5(f) and 5(g)]. It is expected that light from fibers b and c do not return the same intensities. Also fiber positions d and e will collect less light than locations b and c. This is illustrated in Figure 5(h) for the case of one small scattering particle. It can be deducted that parallel polarized location (label b) will exhibit the highest intensity. In this simplified model, location c should receive sin 2 (θ) less light and locations d and e would require several other scattering events until the scattering plane is aligned with the polarizing filter. The light intensities detected in these fibers can be calculated with Monte Carlo simulations that consider the propagation of polarized light.73 74 The probe design from Johnson and Mourant72 incorporates a single polarization film covering all five fibers. For diagnostic purposes, the polarization ratio of light collected from fiber b and c was formed. This design is similar to that in Figure 5(g), with fibers d and e covered with the same polarization film as fibers b and c. The distance between the fibers is critical for such measurements, as described by Gurjar et al.;75 and Backman et al.;76 It is desirable to keep the angle between the axis of the illumination and collection path small. This prevents photons from entering the detection channel after one scattering event in a cross-polarized setup. If the angle is larger, after one scattering event, the projection of the field vector can result in a component that passes the polarization filter. Small source-detector fiber separations are most sensitive to changes in the scattering phase function at high angles.64 Sokolov et al.;77 presents in vitro results with a system similar to that in Figure 5(e). Data from phantoms and cell suspensions was represented in a linear combination of forward and backward scattering components which were determined by the Mie theory. A fiber optic probe was designed based on this study [Figures 5(i) and 5(j)] and characterized in vivo.78 A laminated polarization film was mounted with microscope guidance onto a fixture holding three 200-μm-diam fibers. Clear tape with adhesive on both sides was very useful in mounting the filters, because the tape is transparent and the filters could be visualized with a light microscope. A glass cover and rigid tubing encapsulate the construction. If the measurement and illumination spot must overlap on the sample surface, the shield thickness could be increased. An increased shield thickness results in specular reflections from the shields exit surface. Tilting the reflective surface, with respect to the optical axis, prevents reflected light from coupling back into the fibers. Alternatively, an optical lens can be placed in front of the probe similar to Figure 14(a) in Sec. 8.1, or a conical reflector [Figure 5(k)] could align the beam path. If reflectors are used to align the illumination and measurement path, linear polarized light will be converted into elliptical polarized light if the light is not purely linear polarized. This will make construction with mirrors challenging. 4.Fluorescence ProbesA growing number of clinical studies have demonstrated that fluorescence spectroscopy can be used to distinguish normal from abnormal human tissues in vivo in the head and neck,79 80 81 82 83 84 85 86 87 88 89 cervix,90 91 92 93 94 95 96 97 98 99 100 skin,89 101 102 103 104 105 106 bladder,107 108 109 110 111 112 113 bronchus,114 115 116 117 esophagus,117 118 119 120 121 122 123 colon,117 120 121 122 123 124 125 126 127 128 129 130 131 132 133 134 135 136 137 138 139 breast,140 141 142 143 144 145 146 brain,147 148 149 150 151 152 and artery.79 152 153 154 155 156 157 158 159 160 161 162 163 Recent reviews87 92 121 128 131 146 164 165 166 167 168 169 170 171 172 provide an overview of studies using fluorescence spectroscopy. It is well known that fluorescence intensity and line shape are a function of both the excitation and emission wavelength in samples such as human tissue containing multiple chromophores. Major fluorescence contributors are structural proteins such as elastin and collagen, pyridine nucleotide [NAD(P)H], flavoprotein (FAD), tryptophan, and porphyrins.165 172 4.1.Single-Pixel MeasurementsThe classic fiber optic probe to measure fluorescence consists of at least one excitation and one collection fiber [Figures 4(h) or 6(a)]. A quartz shield placed at the distal end of the fibers [Figure 6(a), item f] enables the illuminated and probed area to overlap. The fraction of overlapping increases with an enlargement of the numerical aperture of the fibers and the thickness of the shield. A larger shield thickness requires a larger diameter shield. A typical shield thickness is 1 to 7 mm. If a shield is omitted, fluorescence can still be detected but will originate from deeper layers because the average photon path length is increased. Such a design has been used to measure skin fluorescence.106 Figure 6(a) Classic fiber optic probe for fluorescence spectroscopy is based on two or more fibers. Hexagonal packing is a dense arrangement and enables the selection of multiple fibers for different excitation sources and collection channels. A quartz shield permits the overlap of excitation and collection areas. Parts include a, excitation fibers; b, collection fibers; c, tubing; d, carbon-filled glue; e, sleeve; and f, shield.6 (b) Single-fiber fluorescence probe with a spacer (optical shield). (c) typical fluorescence probe for single point sampling [legend according to (a) (Ref. 6)].  The collection efficiency βt for the fiber optic probe described in Figure 6(a) can be described as where z is the position along the optical axis of the probe, and β0 is a constant that includes the detector efficiency.98 Previous studies performed in arterial tissue demonstrated empirically that tissue does not emit isotropically as a result of highly forward scattering.173 174 For arterial specimens, tissue fluorescence power decreases with the shield thickness as 1/shield t n, where n is approximately 1.1.Pfefer et al.;175 showed the influence of the fiber diameter and shield thickness to probing depth and remittance at 337-nm excitation and 450-nm emission and at 400-nm excitation and 630-nm emission. The simulation consisted of a single fiber delivering excitation and collecting fluorescence [Figures 4(g) and 6(b)]. The Monte Carlo simulations assumed typical optical properties for esophageal tissue. The remittance (337-nm excitation, 450-nm emission) increased with increasing fiber diameter and was 0.11 for 0.1-mm fiber diameter and was 0.4 for 1-mm fiber diameter when the fibers were placed in direct contact with the tissue. Eighty percent of the fluorescence signal originated between the tissue surface and a depth of 0.175 mm when a 0.1-mm-diam fiber was used. A 1-mm-diam fiber collected from deeper tissue layers and 80 of the fluorescence signal originated between the tissue surface and a depth of 0.375 mm. Placing a shield in front of the fibers increased the probing depth further. With a 5-mm-thick shield, 80 of the fluorescence was collected between the surface and 0.425 mm for fibers with 0.2 to 1-mm diameters, while the collected fluorescence dropped by a factor of 20 for the 0.2-mm fiber and by a factor of 5 for the 0.6-mm-diam fiber. Similar results were found at 400-nm excitation wavelength with the probing depth increased by approximately 20. This indicates that by varying the excitation and emission aperture one may be able to identify depth variations in fluorophore concentrations. A typical probe with the design presented in Figure 6(a) consists of excitation fibers, collection fibers, carbon-filled or low-fluorescent epoxy, and tubing. A rigid type uses metallic tubing and a flexible type uses shrink tubing (Zeus Industrial Products, Inc). A probe with an outer diameter of 4 mm, as presented in Figure 6(c), was successfully used by Ramanujam et al.;95 in a study with more than 100 patients. The shield and a sleeve are detachable to disinfect the probe. With the classical design, a probe based on seven 200-μm fibers has a diameter of at least 1.5 mm. 4.1.1.Minimizing the outer diameterFor an improved detection and illumination spot overlap, the shield in front of the probe is replaced with a coated glass rod or a thick piece of optical fiber [Figure 7(a)], which acts as a mixing element homogenizing the output of the probe with two major benefits. During manufacturing, illumination and collection fibers can be randomly mixed and the outer diameter of a probe is reduced and limited by the number of excitation and emission fibers only. Simple probes with minimal diameter can be assembled by stripping the jacket from the excitation and emission fibers, bundling the fibers with glue, and attaching a glass rod with shrink tubing [Figure 7(b)]. The length of this rod should exceed 2R fiber /NA to enable a uniform illumination. Figure 7(a) Reduced outer diameter is achieved with a mixing element instead of a quartz shield. The mixing element consists of a coated quartz rod or a thick piece of optical fiber. The outer diameter does not exceed the diameter of the hexagonal packing. The parts are a, excitation fibers; b, collection fibers; c, tubing; d, epoxy; and e, coated glass rod (mixing element). (b) Assembling of a reduced diameter fiber probe: Illumination and collection fibers (label a), are packed hexagonally (label b) and glued together (label c). The glass rod (label d) is placed in front of the polished fiber bundle and held in place with shrink tubing (label e).  Innova Quart (Phoenix, Arizona) successfully manufactured fiber optic tips using CO 2 laser micromachining. Melting and compressing fibers in a fiber bundle eliminates the dead space in between the fibers. An increase of power density and an almost complete overlap in between illumination and collection areas was reported. However, this technique is currently limited to fiber bundles with only a few fibers. 4.2.Multipixel MeasurementsWith a single-pixel measurement one can obtain spectroscopic information of a small tissue volume, and, based on the performed analysis, a classification of the measurement location is possible. However, for many biomedical applications, a tissue surface area must be investigated, either to determine the extent of a lesion or to identify the location of potential lesions. Pitris176 and Agrawal177 successfully adopted the principle of single-pixel fluorescence spectroscopy measurement to a measurement that interrogates 31 locations simultaneously [Figures 8(a) and 8(b)]. For that purpose, the traditional single-pixel measurement is conducted in parallel and data are obtained from a static pattern of pixel locations. Several spectroscopic measurements can be conducted simultaneously with modern aberration-corrected imaging spectrographs. Combined with a large focal plane CCD detector (e.g., 30×12 mm) , these spectrographs can disperse up to 30 and more input channels with minimal crosstalk. The average precancerous lesion size, for example, of the cervical epithelium is between 1 and 2 mm. This means that for the screening of the cervix one does not require a high spatial resolution and can use fiber optic multipixel probes. The outer diameter of the probe in Figure 8(b) is 1 in. and the shield thickness is in. To cover the whole cervix (which is approximately 3 cm in diameter), this probe was placed onto four quadrants separately.178 Figure 8(a) shows a schematic arrangement of a multipixel probe consisting of several 6 around 1 single-pixel probes, while Figure 8(b) shows the actual implementation with a single excitation and collection fiber. As proposed in Figure 8(a), using several excitation fibers for each collection fiber increases the illumination intensity. An estimation based on commonly used equipment and the previously introduced formula for hexagonal packing shows that more than 500 fibers with a core diameter of 200 μm can be successfully located in a spot created by a standard 300-W xenon lamp. The focal spot size of the excitation source at the coupling site is determined by the arc size, which is typically of the order of 0.5 to 3 mm. A 300-W xenon lamp with a parabolic reflector (Compact Illuminator 6000CI, ORC) produces a spot diameter of approximately 7 mm when a focusing lens with a focal length of 50 mm is used. Figure 8(a) Multipixel fiber optic design based on the design of Figure 6(a) (frontal view). At each sample spot, one collection fiber is surrounded by one to six illumination fibers. Crosstalk in between sample spots can be influenced by the separation distance of the collection and emission fibers.6 (b) Typical fluorescence probe for simultaneous multipixel measurements with 32 sampling locations. Black shrink tubing holds the quartz shield. Emission and collection fiber pairs are arranged hexagonally.6 (c) Separated illumination and collection spot. Fluorescence generated in a 1-mm spot area spreads by scattering inside the tissue and is also detectable outside the illumination area. Since the average path length of the light detected outside the illumination spot is larger, absorption processes are increased and can be observed at increased oxyhemoglobin absorption valleys at 540 and 580 nm (adapted from Ref. 158). 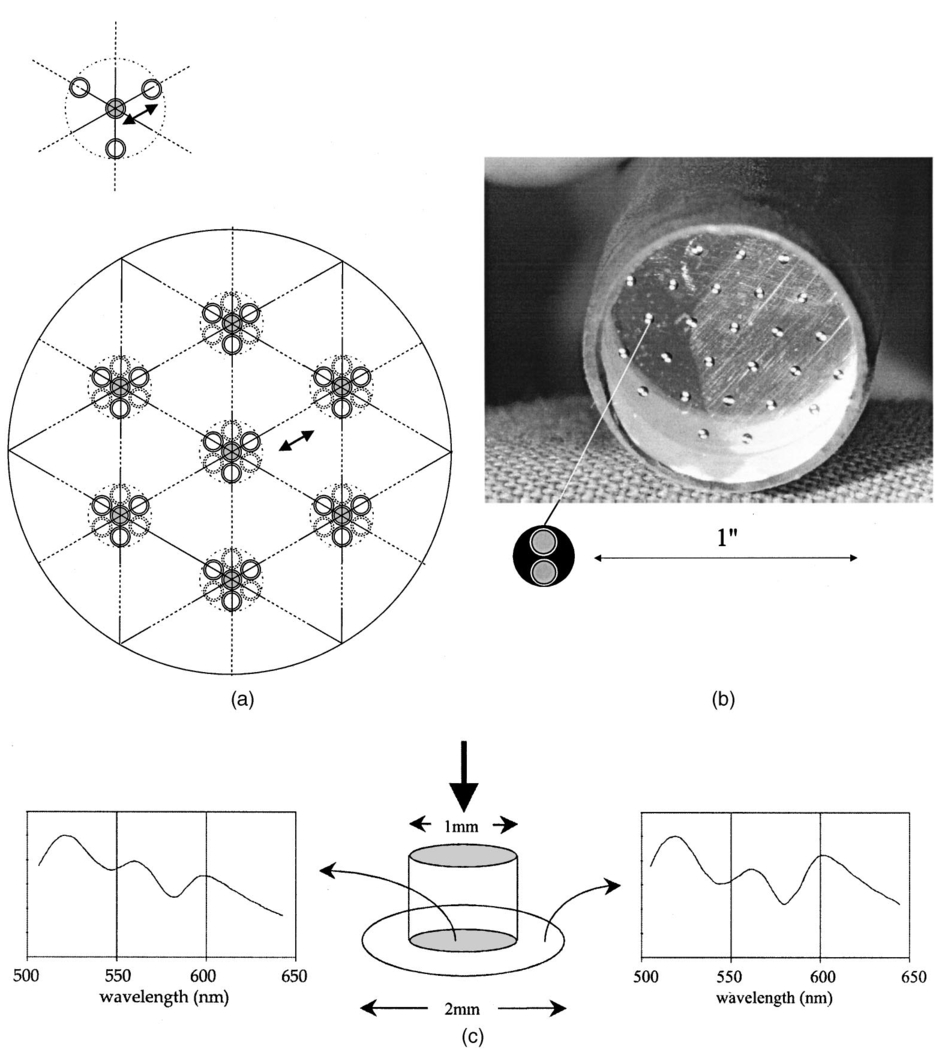 Fiber optic multipixel systems were recently presented by the private sector.179 180 An advanced system that can measure fluorescence and reflectance spectra at 120 locations was introduced by Nordstrom et al.;179 This system incorporates imaging optics and a laser scanning device that can simultaneously illuminate six excitation channels out of 120 rectilinear aligned fibers. To investigate even larger surface areas, researchers have proposed systems that do not rely on fiber optic probes, such as a flying spot scanner,181 or the use of imaging techniques.182 4.3.Influence of Illumination and Detection Spot SeparationKeijzer et al.;158 described scattering and detection of fluorescence from arterial tissue outside the illumination spot experimentally and theoretically [Figure 8(c)]. The β and α absorption bands of oxygenated hemoglobin alter the fluorescence spectra. Avrillier et al.;183 described the same effect and called the fluorescence distortions a “media function.” In experiments with a separate excitation and fluorescence collection fiber (200 μm in diameter), they showed that when brain is excited at 308 nm, the fluorescence ratio at 360- and 440-nm emission decreases with increased fiber separation (2.8 for 250 μm, 2.5 for 500 μm, and 2.4 for 750 μm). Pfefer et al.;175 investigated the average probing depth in esophageal tissue when fluorescence is collected outside the excitation spot. They simulated an excitation fiber with a diameter of 100 μm and found that inside the excitation fiber area, the collected fluorescence was very sensitive to superficial layers, however, the first 50 μm outside the excitation area, the detected fluorescence, is mainly originates from a depth of 125 μm, while the intensity dropped by approximately a factor of 2.5 compared to the intensity within the excitation area. Absorption in the fluorescence distortion function and, hence, the spectral shape variations are enhanced when the excitation and collection fibers are separated further.183 This may be useful to detect neovascularization with fluorescence spectroscopy. In contrast, when multipixel fluorescence measurements are conducted in parallel, the spacing of the collection spots and the shield thickness must be chosen carefully to minimize crosstalk between the measurement channels. 4.4.Combined Probes for Fluorescence and Reflectance SpectroscopyIt is well known that the absorption and scattering properties of tissues in vivo affect both the intensity and line shape of measured fluorescence spectra.165 Furthermore, measuring both fluorescence and diffuse reflectance spectra may provide additional information of diagnostic value.184 Durkin184 described a probe that combines the measurement of fluorescence and optical properties. Scattered light is collected with a white light “transmission” measurement. This light travels through the same tissue volume, which is excited for fluorescence measurements. The probe, as illustrated in Figures 9(a) and 9(b), consists of a total of 21 optical fibers (200-μm diameter, NA=0.2) arranged in concentric bundles. The center bundle contains 7 fluorescence excitation fibers and 12 fluorescence collection fibers. At the distal end of the probe, the fibers that excite and collect fluorescence are sealed with a quartz shield. This shield is placed in contact with the sample surface and ensures that the area from which fluorescence is collected is the same as that illuminated for reflectance measurements. The reflectance fibers are flush with the tip of the central shield. Similar attempts are described in the literature.169 185 Figure 9(a) Fiber optic probe that combines fluorescence and reflectance measurements: White light scatters through the volume interrogated during fluorescence measurements. Parts include a, excitation fibers; b, fluorescence collection fibers; c, carbon-filled glue; d, outer tubing; e, quartz shield; f, reflectance collection; and g, white light illumination.6 (b) Manufactured probe according to the design of (a). Parts included are the same as in Figure 8(a). (c) Combined fluorescence and reflectance probe. Illumination of the area around the measured spot enables visual feedback during measurement: (label a) Fluorescence fibers (label b) and reflectance fibers (label c) are arranged in the center of the probe. An integrated glass rod minimizes the outer diameter (label d) of the fluorescence channel. The reflectance fibers (label c) are flush with the tissue. (d) Frontal view of the probe and its connectors from (c). Fluorescence excitation and collection fibers (label b) are randomly arranged behind the quartz rod. Reflectance illumination (label E) is facilitated with one fiber, and reflectance is collected at four different source-detector separations (0, 1, 2, and 3). (e) Fluorescence excitation fibers from the design represented in (c) and (d) are arranged in two lines and coupled to the output of a monochromator filtered xenon light source. Fluorescence and reflectance collection fibers are linearly arranged for the imaging spectrograph ferrule. Sufficient spacing between the fibers eliminates blooming on the CCD detector, while measuring low light levels with fiber positions 2 and 3. (f) Compatibility of probe with laparoscopic equipment. A trocar shaft (label a) enables the passage of probe with a diameter smaller than 5 mm for measurements during abdominal surgery. The probe (label b) and shaft are sealed with a flexible lip (label c). Illumination fibers (label d) enables a remote-controlled illumination of the measured spot while endoscopic illumination is dimmed. A second trocar must be placed for endoscopic supervision. 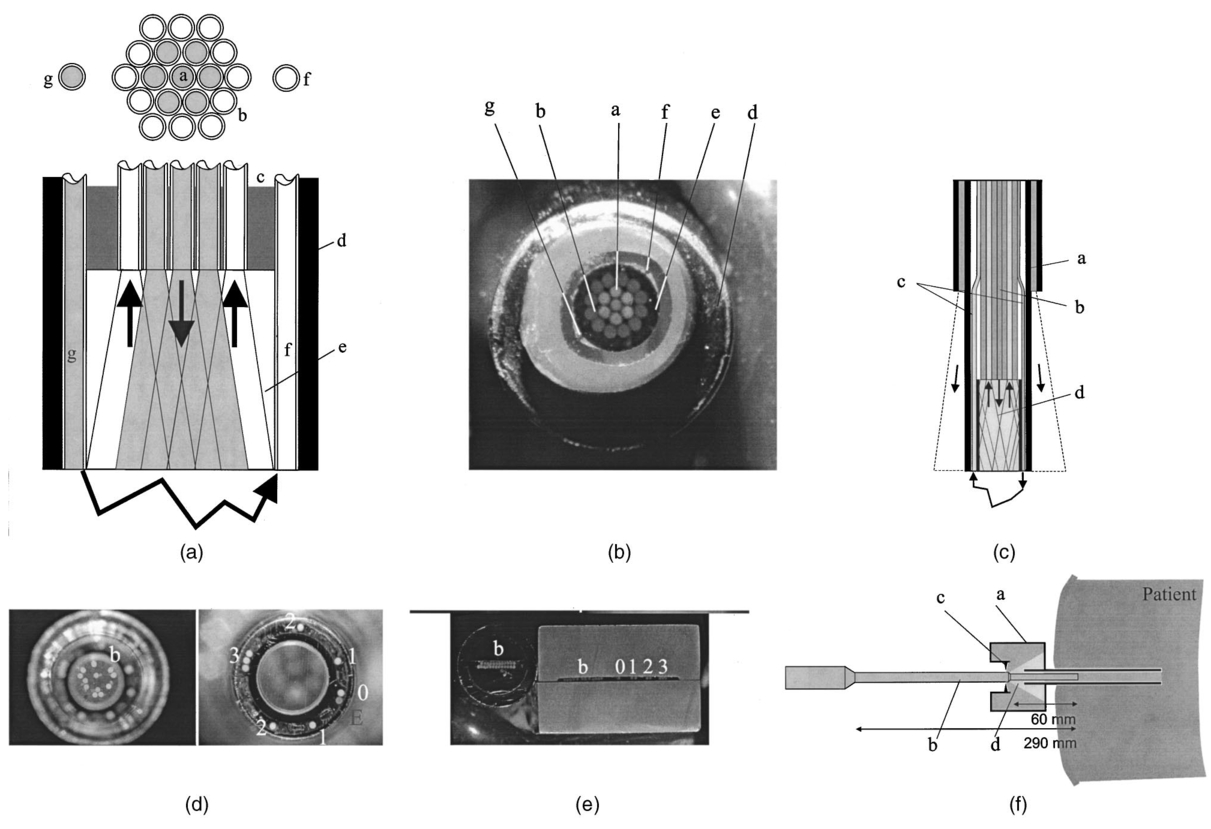 The author’s attempt51 186 to measure combined fluorescence and reflectance resulted in a probe with a mixing element for the fluorescence channel, four different source-detector separations and visual illumination for probe placement [Figure 9(c)]. The current probe consists of 46 fibers: 25 for fluorescence excitation, 12 for fluorescence, and 9 for reflectance collection. Reflectance is measured in a circular fashion with fibers placed at 200 μm and 1.1, 2.1, and 3 mm distances to the source fiber [Figure 9(d)]. The detection fibers are linearly aligned in the spectrograph ferrule [Figure 9(e)]. For fluorescence measurements, all emission collection fibers are binned on the CCD chip, while for reflectance measurements all fibers are imaged with appropriate resolution. The outer diameter is smaller than 5 mm, which enables us to measure through a trocar shaft in the peritoneal cavity [Figure 9(f)]. 5.Probes for Raman SpectroscopyNIR Raman scattering can be used as a tool to perform in situ histochemical analysis.12 14 187 188 189 190 191 192 193 194 195 196 197 198 199 200 201 202 203 204 205 206 In biological applications, approximately 10−10 of the incident light is Raman scattered and the Raman signal is normally six orders of magnitude weaker than typical fluorescence signals. The amount of light that can be delivered to the sample area is limited due to heating hazards. The design of a fiber optic probe for Raman spectroscopy is driven by maximal light collection. Additionally, background signal originating from the laser source, the fibers, and all optical components can fill the dynamic range of the detector and overwhelm the Raman signal.14 207 These signals must be reduced with filters to accomplish sensitive in vivo measurements. The dynamic range of the detector can also be enlarged with multiple readings that reduce the noise by the square root of the number of readings. Currently, Raman spectra of tissues are recorded208 in vivo in less than 5 s. A design developed by Myrick et al.;209 and Myrick and Angel210 [Figure 10(a)] is based on graded-index (GRIN) lenses. Filters are placed in the excitation and emission path and enabled remote analysis with fiber optic cables. The light source is bandpass filtered to eliminate signals produced in the fibers, and a long-pass filter reduces specular reflections and elastically scattered light that enters into the collection fibers. Figure 10(a) Fiber optic probe for Raman spectroscopy based on separate illumination and collection fibers. The output of the fibers is collimated and filtered and then projected onto the same area on the sample. Bandpass filters (label a) are used for the excitation fibers and long-pass filters (label b) for the collection fibers. GRIN lenses (label c) are assembled into the probe to maintain small diameters (adapted from Ref. 210). (b) Fiber optic probe based on the design in Figure 4(l). Inline filters (labels a and b) are mounted into spring-loaded SMA connectors. The fiber length in between the tip and the filters is kept short (adapted from Ref. 211). (c) CPC Raman collection system. Parts include a, NIR diode laser; b, collimating lens; c, reflective mirror; d, dichroic mirror; e, focusing lens; f, parabolic concentrator; g and h, field lenses; to prevent vignetting; i, a focusing lens to couple the Raman signal into a collection fiber bundle (label j); and k, a high-efficiency spectrograph with a LN-cooled CCD (with permission from Refs. 14 and 212). (d) Raman probe. The excitation light is transported through a single fiber (label a) and imaged with a biconvex lens (label b) through a dielectric bandpass (BP) filter via a mirror (label c) onto the sample area. The inelastic scattered light is collected behind a quartz window (label d) and imaged with two plano convex lenses (labels e and f) through an aperture stop (label g), and a holographic notch filter onto a flexible fiber bundle (label h) (with permission from Ref. 194). (e) Commercial Raman probe. Excitation light (label a) is collimated (label b) and bandpass filtered through a transmission grating (label c) and aperture stop (label d). The excitation intensity can be monitored (label e). Raman-scattered light is collected with a microscope objective and imaged on a collection fiber bundle (label f). Two holographic notch filters (label g) are placed in the collimated beam path to remove reflected excitation light (adapted from Ref. 213). (f) UVRR spectroscopy probe incorporates a smaller diameter solarization-resistant UV grade quartz fiber for excitation and an oblique polished fiber to collect scattered light close to the excitation fiber. The oblique polished fiber is coated with aluminum (R) to achieve side looking in liquid samples (with permission from Ref. 17). 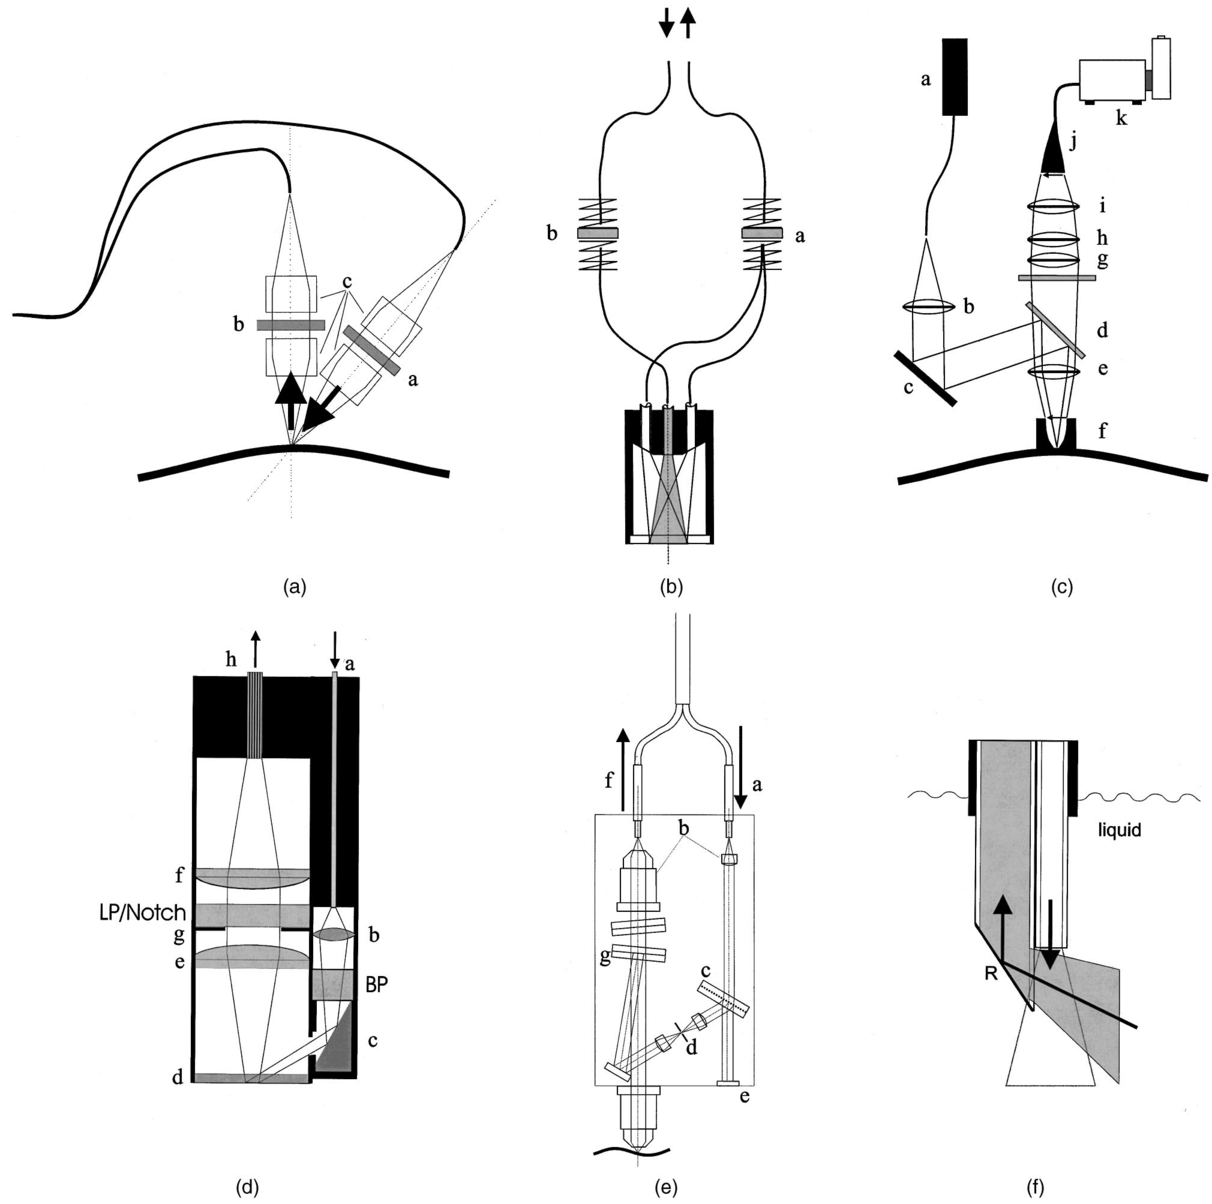 A similar approach is shown in Figure 10(b). A probe developed by Savannah River Technology Center211 (Aiken, South Carolina) consists of dielectric filters placed in between fibers that are held together with spring-loaded SMA connectors. Six collection fibers are arranged around an excitation fiber. They are arranged according to the drawings in Figure 4(l). A sapphire window isolates the probe from the surrounding environment. Berger et al.;189 and Tanaka et al.;212 developed a design for improved signal collection to enable spectral acquisition in a short time. A compound parabolic concentrator (CPC) was used at the distal end of the probe. They produced a hollow shell, based on a mandrel, electrolytically. The mandrel followed an optimized parabolic form that was cut with a numerically controlled lathe. Small CPC dimensions with an input aperture of 0.57, an exit aperture of 2.1 mm, and a length of 4.1 mm were achieved [Figure 10(c)]. The probe design with the CPC improved the collection efficiency sixfold. This system incorporates a 500-mW tunable 830-nm diode laser that was coupled with a mirror and a dichroic beamsplitter onto the sample site. Inelastic scattered light exiting the CPC is further collimated with a lens and filtered by the dichroic mirror and additional filters. Field lenses prevent vignetting of the signal. The last lens images the output onto 200 100-μm fibers, which illuminate an f/1.8 spectrograph. The signal is detected with a back-illuminated liquid nitrogen (LN)-cooled CCD. Spectral resolution is 13 cm −1. Mahadevan-Jansen et al.;194 195 and Mahadevan-Jansen and Richards-Kortum214 successfully measured Raman spectra on the cervix with a fiber optic probe in less than 3 min (Figure 10d). A diode laser is coupled into a single 200-μm fiber. A small-diameter dielectric filter (3 to 4 mm) rejects out of band light (OD 5) and a gold mirror deflects the focused beam onto the specimen site. The beam must pass a quartz window that is a part of the housing. Scattered light from the same area is imaged with two biconvex lenses on a fiber bundle. Elastically scattered and specular reflected light is rejected with a beam aperture stop and a holographic notch filter (OD 6). The optics in the detection arm are 8 mm in diameter and the whole probe diameter is less than 2 cm. A similar spectroscopic detection system is used, as described in Figure 10(c). The spectrograph with the holographic transmission grating (Holospec, Kaiser Optical Systems, Ann Arbor, Michigan) and the deep depletion, back-illuminated, LN-cooled CCD enable optimal system performance. A similar two-legged probe is commercially available from InPhotonics (Norwood, Massachusetts). The design is further optimized by inserting a dichroic mirror that combines the excitation and collection light before focusing it onto the sample. Kaiser Optical Systems has presented a commercially available fiber optic Raman probe213 [Figure 10(e)]. Excitation light is filtered though a transmission grating and can be monitored outside the probe head. The sample spot is imaged with two microscope objectives onto a fiber optic cable. Two Raman notch filters remove excitation light in the collimated beam path. The filters are arranged symmetrically to remove interference signals. All of the described Raman probes include imaging optics to enhance the collection efficiency. This makes it difficult to correct the spectral throughput of the system with standardized light sources such as the tungsten filament lamp. The NA of the probe should be filled with light similar to tissue measurements. Therefore, the calibration light source must be placed in focus of the imaging optics of the probe. This can be accomplished by measuring the diffusely scattered light from a reflectance standard placed at the tissue location. If the calibration light source is not placed at the location of the measured tissue, light passes the probe optics differently than during tissue measurement conditions. This may result in the transmission of light outside the designed blocking areas of the bandpass filters or in increased scattering of light on nonoptical surfaces inside the probe. The reflectance standard can be a flat Spectralon disk or an integrating sphere with an entrance port for the calibration light source and an exit port for the probe. Visionex Inc. developed a biomedical Raman probe based on fibers with beveled and flat tips [Figure 4(j)]. A central flat delivery fiber (400-μm diameter) is surrounded by seven beveled collection fibers (300-μm diameter). Furthermore, filters are incorporated onto the core of the fibers approximately 2.5 cm from the probe tip: a bandpass filter is placed in line with the delivery fibers and a longpass filter in line with the collection fibers. The fibers have an NA of 0.22. Small probe diameters and excellent collection efficiency has been reported from this probe.18 It can easily be configured for fluorescence and reflectance measurements. The scattering cross section for Raman interactions is increased dramatically if excitation is in resonance with the electronic transitions of the chromophore involved in the vibration. For many biologically relevant chromophores, these transitions are in the UV. Resonance enhancements are of the order of 104 to 105 for UV absorption bands.12 To measure these phenomena with fiber optic probes, the inherent signals produced in the delivery and collection system are problematic. The Raman group17 at the University of British Columbia has successfully built a fiber optic probe for UV resonance Raman spectroscopy [Figure 10(f)]. UV-grade and solarization-resistant UV-grade optical fibers10 are used for the collection and excitation paths, respectively. Their design incorporates an excitation fiber and an oblique polished fiber with a larger diameter to collect the scattered light (600 μm). This configuration minimizes inner filtering (sample self-absorbance). Because solutions are investigated, a reflective surface based on a metallic coating is required on the collection fiber. Aluminum reflects more than 90 at 250 nm. 6.Side-Looking Probes and Their ApplicationAs described earlier, oblique polishing of individual fibers deflects the output of the fiber in respect to the fiber axis [Figures 4(b) to 4(e)]. At the critical angle for total internal reflection, light will leave the fiber through the cylindrical side, which focuses the beam in an angular direction, resulting in an elliptical focal spot close to the fiber surface. To enable the light to leave the fiber sideways at the tip, the jacket must be stripped. Depending on the jacket material, it can be dissolved in acid, mechanically abraded, or burned away with a lighter. Illumination analysis software ASAP (Breault Research Organization Inc., Tucson, Arizona) shows maximal irradiance at a polishing angle of 40 deg in air as the surrounding media.215 The distance between the focal spot and the fiber wall is 1.3 times the cladding radius. In water, this distance increases to 3.17 times the cladding radius. Since the critical angle for total internal reflection on the silica-water interface is 66 deg, a 40 deg polishing angle is not sufficient. For a side deflection with this geometry, the beveled fiber end surface must be coated with a reflective material. The increase of irradiance is 2.4 in air and 1.6 in water [Figures 11(a) and 11(b)]. Figure 11(a) Illumination analysis of beveled fibers with a uniform spatial and angular light distribution inside the fiber shows a focusing in air. When light leaves the fiber through the cylindrical wall, it is focused. In air, the irradiance increases to a factor of 2.4 in the focal spot compared to the intensity within the fiber. The focus spot has an elliptical shape. (b) Illumination analysis of a beveled fiber in water: The refractive power of the cylindrical surface is reduced compared to the silica-air interface in (a) and the irradiance in the focal spot is 1.6 times larger than in the fiber core. (c) Oblique polished fiber (label a) is enclosed in quartz capillary tubing (label b) for minimal diameter side looking probes (Innova Quartz). A two-fiber arrangement for separate illumination and collection path can also be manufactured.6 (d) Circular arrangement of oblique polished fibers allows the fabrication of a ring probe with separate illumination and excitation channels. Alignment is a tedious task.6 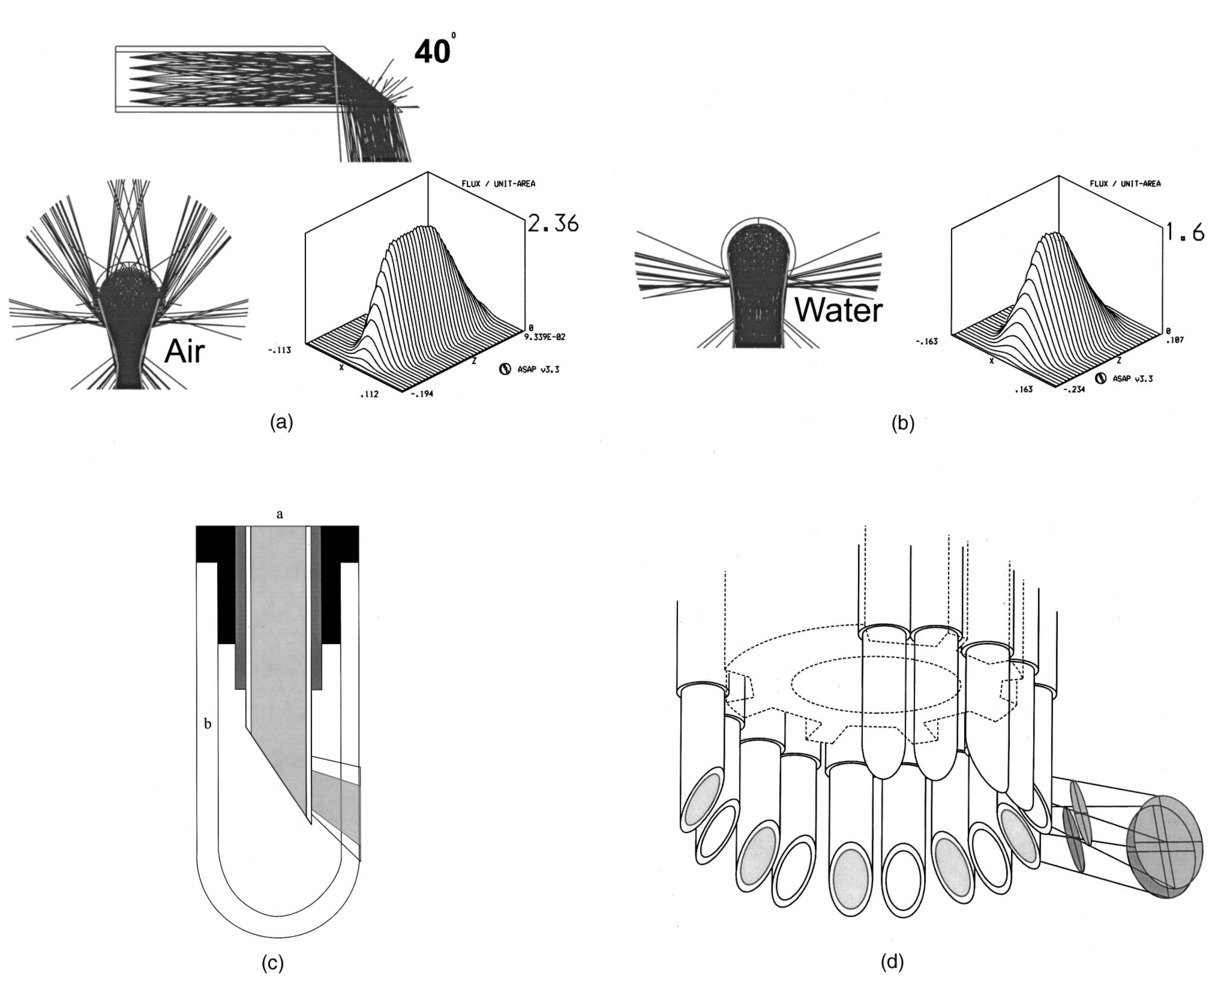 Enclosing a single oblique polished fiber into a glass capillary tube enables the production of minimal diameter deflecting probes. These off-the-shelf products (Innova Quartz, Phoenix, Arizona) are manufactured for vaporization and coagulation of tissue but can also be used for spectroscopic applications [Figure 11(c)]. If separate illumination and collection fibers are required, the alignment of these fibers will be a tedious task. An example of separate illumination and collection fibers is shown in Figure 11(d). To produce this probe, fiber pairs are mounted in a cylindrical tube with grooves. A simultaneous investigation of sites along the circumference of the probe is possible (ring probe). The fiber pairs must be aligned flush and rotated so that the illumination and collection spot overlap. Shrink tubing or elastic bands could assist in this task. 6.1.A Sapphire-Tip-Based Ring ProbeSampling along the circumference of the probe is useful to identify the angular position of obstructions in tubes (e.g., arteriosclerosis) or for identification of lesions in tubular structures (e.g., dysplasia in the endocervical canal). A probe initially designed for radial ablation and simultaneous spectroscopic analysis215 is illustrated in Figures 12(a) and 12(b). The fibers are glued onto a metallic ring (OD 2.4 mm, ID 2.05 mm). A hollow plug attaches internal flexible tubing for flushing and a guide wire. A custom-made sapphire prism (Swiss Jewel, Tenero, Switzerland) is attached to the plug. The output of the fibers with a NA of 0.22 is totally deflected at the back surface of the prism. An outer flexible silicone tube seals the tip from the liquid environment. Two different outer diameters were realized: 1.4 and 2.8 mm. Figure 12(b) shows the individual parts partially assembled. In the upper picture, the outer tubing is not completely mounted. For spectroscopic measurements, smaller 100-μm fibers were integrated in between the ablation fibers (lower picture). The sealing of such a tip is a tedious task since only small amounts of glue can be used. Similar tips can be produced with vee-, ring-, orifice-, cup-, and chisel-jewels (Swiss Jewel, Tenero, Switzerland; Sapphire Engineering Inc., Pocasset, Massachusetts; SWIP, Biel, Switzerland). Figure 12(a) Sapphire prism deflects the output of a fiber ring into a radial direction. The probe consists of a plug (label a) holding the prism (label b) and inner tubing. Fibers (label c) are glued into a metallic ring (label d). Outer tubing (label e) and glue seals the fiber tip.6 (b) Upper picture, the sapphire prism and the fibers are partially assembled; lower picture, a cross-sectional view showing the arrangement of illumination and smaller collection fibers in a metallic ring (label d).6  7.Diffuser TipsWith the approval of photosensitive drugs such as Photofrin® (QLT Photo Therapeutics Inc., Vancouver, Canada) by the FDA and clinical trials of many others, there is a requirement for fiber optic probes that provide a homogeneous illumination of large areas in canals and on surfaces. Diffusely scattering elements mounted at the end of fibers or fiber bundles distribute light over large areas. In addition to therapeutic applications, such as photodynamic therapy216 217 218 219 220 221 222 223 224 225 226 227 228 229 and coagulation,230 diffuse light delivery systems can also be used for illumination during spectral measurements. The scattering particles included in the diffuser elements are titanium (TiO 2) or aluminum oxide (Al 2 O 3), which are embedded in a transparent matrix such as optical glue (Epotek 307, Epoxy Technology, Inc. Billerica, Massachusetts). Flexible containment is produced with microtubing based on fluorpolymers (PTFE, FEP from Zeus, Orangeburg, South Carolina). Rigid tips are based on ceramics or materials similar to Spectralon (Labsphere, North Sutton, New Hampshire). If these materials are used in the UV wavelength range to deliver fluorescence excitation, the autofluorescence and transmission is of importance. FEP tubing (0.3-mm wall thickness) shows good transmission from 250 nm up to 2 μm [40 at 250 nm, visual (VIS), 80 to 90], while autofluorescence is an order of magnitude lower than tissue fluorescence. Some oxides such as Al 2 O 3 or BaSO 4 emit fluorescence in the UV-VIS and can contribute to background signals. An example diffuser is presented in Figure 13(a). Light exits the fiber optic bundle and enters a turbid cylindrical volume. Scattered light leaves this volume in a radial direction. A uniform light distribution along the optical axis is achieved with a reflector mounted at the end of the scattering volume. Light that would leave the probe in an axial direction is reflected back into the scattering material and undergoes further scattering events.230 The length of the probe determines the concentration of scatterers [Figures 13(a) and 13(b)]. Figure 13(b) illustrates a diffuser with a length of 30 mm and a diameter of less than 2 mm. A probe to measure fluorescence spectra inside the endocervical canal was proposed by the authors and consists of a diffuser element and side looking fibers. In addition to the diffuser already described [Figures 13(a) and 13(b)], a reflective foil (aluminum or gold) placed around a diffuser tip restricts illumination in an angular direction. The foil is attached to the diffuser with thin-walled shrink tubing [Figure 13(c)]. For spectroscopic measurements inside the canal, oblique polished fibers probe the light emitted from the sample area. The collection fibers are bundled and, to probe different positions along the axis, each beveled fiber is retracted to a different axial position. The diffuser and the bundle with the collection fibers are placed adjacent. Since the illumination light exits the diffuser and must pass collection fibers, the absorbing jacket of the fibers must be removed. Figure 13(a) Diffuser is mounted on the tip of a fiber bundle which allows uniform illumination along the probe axis (CardioFocus Inc., formerly Rare Earth Medical, Inc.). A reflector (label a) at the diffuser end and the local concentration of scattering particles (label b) determine the intensity profile. Tubing (label c) made of fluorpolymers has a high transmission and good heat resistance.6 (b) “Lightstic” manufactured according the design in (a) with a length of 3 cm and a reflector enables radial illumination with a relatively flat intensity profile along the axis. (c) This line-sampling probe is based on a combination of a diffuser illuminator (label a) and oblique polished fibers (label b). The light emitted by the diffuser passes the collection fibers, which have the jacket striped. A metallic foil (label c) restricts the illumination to a reduced angle.6 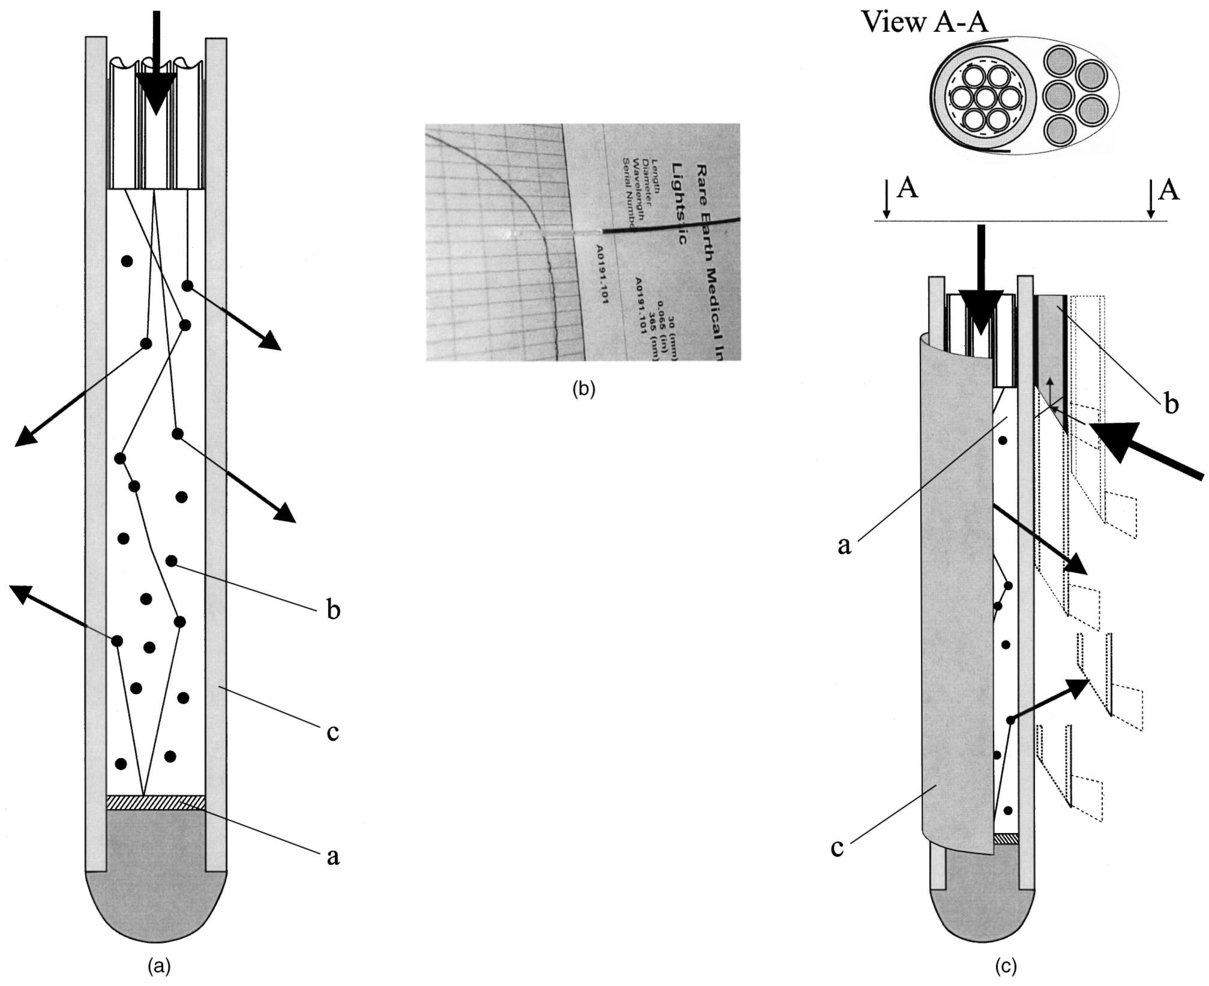 8.RefocusingRefocusing the illumination or collection beam paths can serve several purposes: (1) to decrease the sample volume if the target is placed in focus or (2) to increase the illuminated area if the target is placed outside the focus. A focused beam samples a smaller area and leads to increased illumination intensity. If light is collected through a focusing optic, it will encompass a larger solid angle. In contrast, if the area to be illuminated is large, a rapidly diverging beam is desirable. This can be accomplished by placing the sample behind the focal spot where light diverges. Concave and convex optical surfaces can be placed between the fiber exit and the tissue. In the following, we present three different solutions with increasing complexity to refocus the beam of a fiber optic cable. First, the fiber tip is altered into a spherical shape, which is equivalent to adding a plano convex lens in front of the fiber. Second, spherical lenses image and concentrate the fiber output. Last, mirrors are used to redirect and focus the fiber output. 8.1.Spherical Fiber TipsMelting the end of the fiber shapes the exit surface of optical fibers. An almost spherical surface will be created by the surface tension of liquid quartz.231 Its form is determined by the volume of melted quartz, which is related to the amount of absorbed thermal energy. A number of techniques are used to achieve this deformation: a microfurnace, a Bunsen microburner, an electrical arc, and a CO 2 laser beam.232 The smallest possible surface curvature is a hemisphere. Theoretical results of a beam exiting a hemispherical fiber tip in air and water are shown in Figures 14(a) and 14(b) (modified from Ref. 15). Because the refractive index of silica is 1.46, the focusing power is limited in aqueous media. Figure 14(c) illustrates the focusing of a fiber with a 200-μm core diameter and a NA of 0.22 in water. The beam in water is reduced to a quasi-parallel beam. A light intensity concentration was found at a distance 3 times the distal radius of curvature from the vertex. In simulations215 the maximal irradiance was found to be 3 times the irradiance within the fiber. A fiber optic probe for spectroscopic measurements could be manufactured with a single fiber [Figure 1(b)]. The sampling area would be smaller then the fiber diameter and the solid angle of collected light larger than the NA of the fiber. Figure 14(a) and (b) Hemispherically shaped ends of fibers focus the output beam in air and collimate the output beam in water (Ref. 6). (c) Maximal irradiance is found at a distance of 3 times the fiber radius in water for quartz fibers with a NA of 0.22. The irradiance increases6 by a factor of 3.  8.2.Ball LensesSpherical ball lenses have been used as collimators in fiber optic connectors.233 Sapphire spheres with a high refractive power are industrially produced in a wide range of diameters (Sandoz SA, Cugy, Switzerland; Rubis Precis, Charquemont, France). Light emitted from a fiber can be focused with this lens type onto the sample site [Figures 15(a) and 15(b)]. Rol and Niederer et al.;15 found a maximal illumination intensity when the ratio of the back surface distance to the fiber and the radius of the sphere is in between 1.8 and 2.8 in water and air. Illumination analysis shows a maximal increase of the irradiance by a factor of 4.8 in water [Figure 15(c)] and 5.7 in air [Figure 15(d)]. With increased fiber diameter, spherical aberrations will degrade the focusing of the beam because light will propagate outside the paraxial regime. Figure 15(a) Ball lenses image the output of a fiber and focus it. The ball lens is centered and placed at a fixed distance to the fiber with metallic holder. If this probe is used in a fluid, focusing is limited. (b) Side-deflecting probe can be manufactured with a half sphere. The flat surface is inclined to the probe axis. If this surface is a sapphire-air interface, total internal reflection will occur. The flat surface could also be coated with aluminum to achieve a similar effect. The deflecting optic is housed in quartz tube. Focusing in water is not affected, since the beam path is determined inside the probe.6 (c) and (d) Illumination analysis demonstrates an up to fivefold increase of irradiance in the focal spot in (c) water and (d) air.6  An example fiber optic probe [Figure 15(a)] with a 200-μm core diameter fiber and a sphere with a radius of 0.4 mm will not exceed an outer diameter of 0.9-mm (modified from Ref. 16). The sphere and fiber can be held in a cylinder with a conic inner shape. For side-looking applications, the same principle is used with a half sphere. If the plane is inclined by 45 deg and the step in the refractive index is equivalent to sapphire-air, the beam will be deflected with total internal reflection at the interface and leave the probe at 90 deg with respect to the probe axis. A microquartz tube encloses the half sphere and provides air as refractive media. For spectroscopic measurements a setup as described in Figure 15(b) would be required. 8.3.Spherical and Parabolic ReflectorsMirrors can concentrate light.234 The complex refractive index of a dielectric material defines the absorption and the reflectance of a mirror. An example of a nonimaging parabolic light concentrator is presented in Figure 9(c). For side-looking applications, parabolic or spherically polished mirrors focus the output of several fibers onto the same area [Figures 16(a) and 16(b)]. Best performance is achieved with a parabolic surface [Figure 16(b)]. The manufacturing of such mirrors requires a high-precision, numerically controlled lathe. Surfaces with optical quality can be manufactured with single-point, diamond-cutting machines. Figure 16(a) Spherical or (b) parabolic mirror focuses and deflects the fiber output. Rotationally symmetric mirrors with optical surface quality can be manufactured with numerically controlled diamond-turning machines.6 (c) and (d) Fiber optic ring probe with a parabolic reflector according to (b). A plug with the reflective surface (d) is mounted into a ring of fibers and flexible tubing. A short piece of a quartz tube isolates the mirror from the probe environment.6 (e) Illumination analysis of the output from five fibers was performed with a reflector according the design of (c). The analysis shows a good overlap of the fibers on the exit surface (B) of the probe. The spot diagram on the exit surface (B) shows that the output of the optical fibers is spread in a circumferential direction.6 (f) Flux density profile was measured at the exist surface (B) and the five fibers produced an increase of a factor of 2 compared to the intensity inside a single fiber. A ray trace projection (A) shows that the output is focused to a small spot in radial direction.6  An example of a probe illuminating a ring is shown215 in Figures 16(c) and 16(d). Multiple fibers are glued into a metallic ring. A plug with the optimized polished surface is centered into the ring and deflects the axial fiber output in a radial direction. A quartz tube shields the reflective surface. Illumination analysis shows that the output of five fibers (two fibers were arranged on an inner concentric ring and three on an outer location) overlaps on the circumference of the probe [Figures 16(e) and 16(f)]. The rotational symmetric design spreads the light from the fibers in an elliptical spot around the circumference. The inner ring of fibers could be used as collection fibers and the outer ring as illumination fibers. This design confines the sampling volume close to the probe surface since the light diverges rapidly outside the focal spot [Figure 16(f)]. 9.SummaryA large variety of optical designs enables optimal illumination and light collection for spectroscopic applications. Specific solutions for fluorescence, reflectance, and Raman spectroscopy are available and the possibility of combining them in a single probe is feasible. Future technology development will lead to integrated, multifunctional, and highly optimized fiber optic probes. AcknowledgmentsResearch on fiber optic devices was supported in part by the Swiss National Science Foundation (Laser Coronary Angioplasty, 32-27888.89) and the Swiss National Science Foundation (fiber optic probes for in vivo spectroscopy, postdoctoral fellowship 1995 and 1996). This work would not have been possible without Pascal Rol (1956 to 2000) (University of Zurich, Department of Ophthalmology, Switzerland). REFERENCES
B. Bernheim
,
“Organoscopy,”
Ann. Surg. , 53 764
(1911). Google Scholar
H. Hinselman
,
“Verbesserung der Inspektionsmoeglichkeiten von Vulva, Vagina and Portio,”
Muenchner Medizinische Wochenschrift , 73 1733
(1925). Google Scholar
V. P. Pashinin
,
N. Konstantinov
,
V. G. Artjushenko
,
V. I. Konov
,
A. S. Silenok
,
G. Muller
,
B. Schaldach
, and
R. Ulrich
,
“Mechanism of UV laser-induced absorption in fused silica fibers,”
Fiber Integr. Opt. , 10
(4), 365
–372
(1991). Google Scholar
V. G. Artjushenko
,
A. A. Lerman
,
E. G. Litvinenko
,
A. O. Nabatov
,
V. I. Konov
,
R. I. Kuznetsov
,
V. G. Plotnichenko
,
I. L. Pylnov
,
V. A. Shtein-Margolina
,
A. A. Urusovskaja
,
V. V. Vojtsekhovsky
,
N. D. Zaharov
,
W. Neuberger
, and
K. Moran
,
“Mechanisms of optical losses in polycrystalline fibers,”
Proc. SPIE , 1591 83
–89
(1992). Google Scholar
H. Fabian
,
U. Grzesik
,
K. H. Worner
,
H. Henschel
,
O. Kohn
, and
H. U. Schmidt
,
“Radiation resistance of optical fibers: correlation between UV attenuation and radiation-induced loss,”
Proc. SPIE , 1791 297
–305
(1993). Google Scholar
J. Vydra
and
G. F. Schoetz
,
“Improved all-silica fibers for deep-UV applications,”
Proc. SPIE , 3596 165
–175
(1999). Google Scholar
L. Grant
,
G. Schoetz
,
J. Vydra
, and
D. G. Fabricant
,
“Optical fiber for UV-IR broadband spectroscopy,”
Proc. SPIE , 3355 884
–891
(1998). Google Scholar
G. Muller
,
H. Kar
,
K. Dorschel
, and
H. Ringelhan
,
“Transmission of short pulsed high power UV laser radiation through depending on pulse length, intensity and long term behavior,”
Proc. SPIE , 906 231
–235
(1988). Google Scholar
J. F. Brennan III
,
W. Yang
,
R. R. Dasari
, and
M. S. Feld
,
“Near-infrared Raman spectrometer systems for human tissue studies,”
Appl. Spectrosc. , 51
(2), 201
–208
(1997). Google Scholar
P. Rol
,
U. Utzinger
,
D. Beck
, and
P. Niederer
,
“Fiber beam shaping and ophthalmic applications,”
Proc. SPIE , 2330 56
–62
(1995). Google Scholar
L. Greek
,
H. Schulze
,
M. Blades
,
C. Haynes
,
K. Klein
, and
R. Turner
,
“Fiber-optic probes with improved excitation and collection efficiency for deep-UV Raman and Raman resonance spectroscopy,”
Appl. Opt. , 37
(1), 170
–180
(1998). Google Scholar
M. G. Shim
,
B. C. Wilson
,
E. Marple
, and
M. Wach
,
“Study of fiber-optic probes for in vivo medical Raman spectroscopy,”
Appl. Spectrosc. , 53
(6), 619
–627
(1999). Google Scholar
T. F. Cooney
,
H. Trey Skinner
, and
S. M. Angel
,
“Comparative study of some fiber-optic remote Raman probe designs. I. Model for liquids and transparent solids,”
Appl. Spectrosc. , 50
(7), 836
–848
(1996). Google Scholar
T. F. Cooney
,
H. Trey Skinner
, and
S. M. Angel
,
“Comparative study of some fiber-optic remote Raman probe designs. II. Tests of single-fiber, lensed, and flat- and bevel-tip multi-fiber probes,”
Appl. Spectrosc. , 50
(7), 849
–860
(1996). Google Scholar
W. G. Zijlstra
,
A. Buursma
, and
W. P. Meeuwsen-van der Roest
,
“Absorption spectra of human fetal and adult oxyhemoglobin, de-oxyhemoglobin, carboxyhemoglobin, and methemoglobin,”
Clin. Chem. , 37
(9), 1633
–1638
(1991). Google Scholar
W. G. Zijlstra
,
A. H. Maas
, and
R. F. Moran
,
“Definition, significance and measurement of quantities pertaining to oxygen carrying properties of human blood,”
Scand. J. Clin. Lab. Invest. , 224 27
–45
(1996). Google Scholar
R. M. P. Doornbos
,
R. Lang
,
M. C. Aalders
,
F. W. Cross
, and
H. J. C. M. Sterrenborg
,
“The determination of in vivo human tissue optical properties and absolute chromophore concentrations using spatially resolved steady-state diffuse reflectance spectroscopy,”
Phys. Med. Biol. , 44 967
–981
(1999). Google Scholar
A. M. K. Nilsson
,
C. Sturesson
,
D. L. Liu
and
S. Anderson-Engels
,
“Changes in spectral shape of tissue optical properties in conjunction with laser-induced thermography,”
Appl. Opt. , 28 2331
–2336
(1997). Google Scholar
J. R. Mourant
,
T. Fuselier
,
J. Boyer
,
T. M. Johnson
, and
I. J. Bigio
,
“Prediction and measurements of scattering and absorption over broad wavelength ranges in tissue phantoms,”
Appl. Opt. , 36 949
–957
(1997). Google Scholar
A. Kienle
,
L. Lilge
,
M. S. Patterson
,
R. Hibst
,
R. Steiner
, and
B. C. Wilson
,
“Spatially resolved absolute diffuse reflectance measurements for noninvasive determination of the optical scattering and absorption coefficients of biological tissue,”
Appl. Opt. , 35
(13), 2304
–2314
(1996). Google Scholar
J. R. Mourant
,
I. J. Bigio
,
J. Boyer
,
R. L. Conn
,
T. Johnson
, and
T. Shimada
,
“Spectroscopic diagnosis of bladder cancer with elastic light,”
Lasers Surg. Med. , 17
(4), 350
–357
(1995). Google Scholar
F. Koenig
,
R. Larne
,
H. Enquist
,
F. J. McGovern
,
K. T. Schomacker
,
N. Kollias
, and
T. F. Deutsch
,
“Spectroscopic measurement of diffuse reflectance for enhanced detection of bladder carcinoma,”
Urology , 51
(2), 342
–345
(1998). Google Scholar
W. T. Knoefel
,
N. Kollias
,
D. W. Rattner
,
N. S. Nishioka
, and
A. L. Warshaw
,
“Reflectance spectroscopy of pancreatic microcirculation,”
J. Appl. Physiol. , 80
(1), 116
–123
(1996). Google Scholar
M. B. Wallace
,
L. T. Perelman
,
V. Backman
,
J. M. Crawford
,
M. Fitzmaurice
,
M. Seiler
,
K. Badizadegan
,
S. J. Shields
,
I. Itzkan
,
R. R. Dasari
,
J. Van Dam
, and
M. S. Feld
,
“Endoscopic detection of dysplasia in patients with Barrett’s esophagus using light-scattering spectroscopy,”
Gastroenterology , 119 677
–682
(2000). Google Scholar
L. T. Perelman
,
V. Backman
,
M. Wallace
,
G. Zonios
,
R. Manoharan
,
A. Nusrat
,
S. Shields
,
M. Seiler
,
C. Lima
,
T. Hamano
,
I. Itzkan
,
J. Van Dam
,
J. M. Crawford
, and
M. S. Feld
,
“Observation of periodic fine structure in reflectance from biological tissue: a new technique for measuring nuclear size distribution,”
Phys. Rev. Lett. , 80
(3), 627
–630
(1998). Google Scholar
Z. Ge
,
K. Schomacker
, and
N. Nishioka
,
“Identification of colonic dysplasia and neoplasia by diffuse reflectance spectroscopy and pattern recognition techniques,”
Appl. Spectrosc. , 52
(6), 833
–845
(1998). Google Scholar
G. Zonios
,
L. T. Perelman
,
V. Backman
,
R. Manahoranm
,
M. Fitzmaurice
,
J. Van Dam
, and
M. S. Feld
,
“Diffuse reflectance spectroscopy of human adenomatous colon polyps in vivo,”
Appl. Opt. , 38 6628
–6637
(1999). Google Scholar
U. Utzinger
,
M. Brewer
,
E. Silva
,
D. Gershenson
,
R. C. Bast
,
M. Follen
, and
R. R. Richards-Kortum
,
“Reflectance spectroscopy for in vivo characterization of ovarian tissue,”
Lasers Surg. Med. , 28 56
–66
(2001). Google Scholar
I. J. Bigio
,
S. G. Brown
,
C. Kelley
,
S. Lakhani
,
D. Pickard
,
P. M. Ripley
, and
C. Saunders
,
“Diagnosis of breast cancer using elastic-scattering spectroscopy: preliminary clinical results,”
J. Biomed. Opt. , 5 221
–228
(2000). Google Scholar
C. J. Lynn
,
I. S. Saidi
,
D. G. Oelberg
, and
S. L. Jacques
,
“Gestational age correlates with skin reflectance in newborn infants of 24–42 weeks gestation,”
Biol. Neonate , 64
(2–3), 69
–75
(1993). Google Scholar
T. J. Farrell
,
M. S. Patterson
, and
B. Wilson
,
“A diffusion theory model of spatially resolved, steady-state diffuse reflectance for the noninvasive determination of tissue optical properties in vivo,”
Med. Phys. , 19
(4), 879
–888
(1992). Google Scholar
A. Kienle
and
M. S. Patterson
,
“Improved solutions of the steady-state and the time-resolved diffusion equations for reflectance from a semi-infinite turbid medium,”
J. Opt. Soc. Am. A , 14
(1), 246
–254
(1997). Google Scholar
S. T. Flock
,
M. S. Patterson
,
B. C. Wilson
, and
D. R. Wyman
,
“Monte Carlo modeling of light propagation in highly scattering. I. Model predictions and comparison with diffusion theory,”
IEEE Trans. Biomed. Eng. , 36
(12), 1162
–1168
(1989). Google Scholar
S. T. Flock
,
B. C. Wilson
, and
M. S. Patterson
,
“Monte Carlo modeling of light propagation in highly scattering II. Comparison with measurements in phantoms,”
IEEE Trans. Biomed. Eng. , 36
(12), 1169
–1173
(1989). Google Scholar
L. Wang
and
S. L. Jacques
,
“Use of a laser beam with an oblique angle of incidence to measure the reduced scattering coefficient of a turbid medium,”
Appl. Opt. , 34
(13), 2362
–2366
(1995). Google Scholar
S.-P. Lin
,
L. Wang
,
S. L. Jacques
, and
F. K. Tittel
,
“Measurement of tissue optical properties by the use of oblique-incidence optical fiber reflectometry,”
Appl. Opt. , 36
(1), 136
–143
(1997). Google Scholar
R. Bays
,
G. Wagnie`res
,
D. Robert
,
D. Braichotte
,
J. F. Savary
,
P. Monnier
, and
H. van den Bergh
,
“Clinical determination of tissue optical properties by endoscopic spatially resolved reflectometry,”
Appl. Opt. , 35
(10), 1756
–1766
(1996). Google Scholar
M. G. Nichols
,
E. L. Hull
, and
T. H. Foster
,
“Design and testing of a white-light, steady-state diffuse reflectance spectrometer for determination of optical properties of highly scattering systems,”
Appl. Opt. , 36
(1), 93
–104
(1997). Google Scholar
H. Fuchs
,
U. Utzinger
,
A. F. Zuluaga
,
A. Gillenwater
,
R. Jacob
,
B. Kemp
, and
R. Richards-Kortum
,
“Combined fluorescence and reflectance spectroscopy: in vivo assessment of oral cavity epithelial neoplasia,”
Proc. CLEO , 6 306
–307
(1998). Google Scholar
G. Marquez
and
L. V. Wang
,
“White light oblique incidence reflectometer for measuring absorption reduced scattering spectra of tissue-like turbid media,”
Opt. Express , 1
(13), 454
–460
(1997). Google Scholar
T. J. Farrell
,
B. C. Wilson
, and
M. S. Patterson
,
“The use of a neural network to determine tissue optical properties spatially resolved diffuse reflectance measurements,”
Phys. Med. Biol. , 37
(12), 2281
–2286
(1992). Google Scholar
V. P. Wallace
,
J. C. Bamber
,
D. C. Crawford
,
R. J. Ott
, and
P. S. Mortimer
,
“Classification of reflectance spectra from pigmented skin lesions, a comparison of multivariate discriminant analysis and artificial neural networks,”
Phys. Med. Biol. , 45
(10), 2859
–2871
(2000). Google Scholar
J. S. Dam
,
P. E. Andersen
,
T. Dalgaard
, and
P. E. Fabricius
,
“Determination of tissue optical properties from diffuse reflectance profiles by multivariate calibration,”
Appl. Opt. , 37
(4), 772
–778
(1998). Google Scholar
S. T. Flock
,
B. C. Wilson
, and
M. S. Patterson
,
“Hybrid Monte Carlo-diffusion theory modeling of light distributions tissue,”
Proc. SPIE , 908 20
–28
(1988). Google Scholar
L. Wang
and
S. L. Jacques
,
“Hybrid model of Monte Carlo simulation and diffusion theory for light reflectance by turbid media,”
J. Opt. Soc. Am. A , 10
(8), 1746
–1752
(1993). Google Scholar
J. S. Dam
,
C. B. Pedersn
,
T. Dalgaard
,
P. A. Fabricius
,
P. Aruna
, and
S Anderson Engles
,
“Fiber optic probe for noninvasive real-time determination of tissue optical properties at multiple wavelengths,”
Appl. Opt. , 40
(7), 1155
–1164
(2001). Google Scholar
F. Bevilacqua
,
D. Piguet
,
P. Marquet
,
J. D. Gross
,
B. J. Tromberg
, and
C. Depeursinge
,
“In vivo local determination of tissue optical properties: applications to human brain,”
Appl. Opt. , 38
(22), 4939
–4950
(1999). Google Scholar
F. Bevilacqua
and
C. Depeursinge
,
“Monte Carlo study of diffuse reflectance at source-detector separations close to one transport mean free path,”
J. Opt. Soc. Am. A , 16
(12), 2935
–2945
(1999). Google Scholar
J. R. Mourant
,
I. J. Bigio
,
D. A. Jack
,
T. M. Johnson
, and
H. D. Miller
,
“Measuring absorption coefficients in small volumes of highly media: source-detector separations for which path lengths do not depend on scattering properties,”
Appl. Opt. , 36
(22), 5655
–5661
(1997). Google Scholar
J. R. Mourant
,
J. P. Freyer
,
A. H. Hielscher
,
A. A. Eick
,
A. Shen
, and
T. M. Johnson
,
“Mechanisms of light scattering from biological cells relevant to noninvasive optical-tissue diagnostics,”
Appl. Opt. , 37
(16), 3586
–3593
(1998). Google Scholar
A. K. Dunn
,
C. Smithpeter
,
A. J. Welch
, and
R. Richards-Kortum
,
“Sources of contrast in confocal reflectance imaging,”
Appl. Opt. , 35
(19), 3441
–3446
(1996). Google Scholar
R. A. Zangaro
,
L. Silveira Jr.
,
R. Manoharan
,
G. Zonios
,
I. Itzkan
,
R. R. Dasari
,
J. Van Dam
, and
M. S. Feld
,
“Rapid multiexcitation fluorescence spectroscopy system for in vivo tissue diagnosis,”
Appl. Opt. , 35
(25), 5211
–5219
(1996). Google Scholar
G. Jarry
,
E. Steimer
,
V. Damaschini
,
M. Epifanie
,
M. Jurczak
, and
R. Kaiser
,
“Coherence and polarization of light propagating through scattering and biological tissues,”
Appl. Opt. , 37
(31), 7357
–7367
(1998). Google Scholar
G. Jarry
,
E. Steimer
,
V. Damaschini
,
M. Jurczak
, and
R. Kaiser
,
“Coherent components of forward light propagation through scattering media,”
J. Opt. , 28
(2), 83
–89
(1997). Google Scholar
S. L. Jacques
,
M. R. Ostermeyer
,
L. Wang
, and
D. V. Stephens
,
“Polarized light transmission through skin using video reflectometry: toward optical tomography of superficial tissue layers,”
Proc. SPIE , 2671 199
–210
(1996). Google Scholar
W. Groner
,
J. W. Winkelman
,
A. G. Harris
,
C. Ince
,
G. J. Bouma
,
K. Messmer
, and
R. G. Nadeau
,
“Orthogonal polarization spectral imaging: a new method for study of the microcirculation,”
Nat. Med. , 5
(10), 1209
–1213
(1999). Google Scholar
T. Johnson
and
J. Mourant
,
“Polarized wavelength-dependent measurements of turbid media,”
Opt. Express , 4
(6), 200
–216
(1999). Google Scholar
S. Bartel
and
A. H. Hielscher
,
“Monte Carlo simulations of the diffuse backscattering Mueller matrix for highly scattering media,”
Appl. Opt. , 39
(10), 1580
–1588
(2000). Google Scholar
L. Wang
and
G. Yao
,
“Propagation of polarized light in turbid media: simulated animation sequences,”
Opt. Express , 7
(5), 198
–203
(2000). Google Scholar
R. Gurjar
,
V. Backman
,
K. Badizadegan
,
R. Dasari
,
I. Itzkan
,
L. T. Perelman
, and
M. S. Feld
,
“Imaging human epithelia properties with polarized light-scattering spectroscopy,”
Nat. Med. , 7
(11), 1245
–1248
(2001). Google Scholar
V. Backman
,
R. Gurjar
,
K. Badizadegan
,
I. Itzkan
,
R. Dasari
,
L. Perelman
, and
M. Feld
,
“Polarized light scattering spectroscopy for quantitative measurement of epithelial cellular structures in situ,”
IEEE J. Sel. Top. Quantum Electron. , 5
(4), 1019
–1026
(1999). Google Scholar
K. Sokolov
,
R. Drezek
,
K. Gossage
, and
R. Richards-Kortum
,
“Reflectance spectroscopy with polarized light: is it sensitive to cellular and nuclear morphology?,”
Opt. Express , 5
(13), 302
–317
(1999). Google Scholar
A. Myakov
,
L. Nieman
,
L. Wicky
,
U. Utzinger
,
R. Richards-Kortum
, and
K. Sokolov
,
“Fiber optic probe for polarized reflectance spectroscopy in vivo: design and performance,”
J. Biomed. Opt. , 7
(3), 388
–397
(2002). Google Scholar
L. I. Deckelbaum
,
I. J. Sarembock
,
M. L. Stetz
,
K. M. O’Brien
,
F. W. Cutruzzola
,
A. F. Gmitro
, and
M. D. Ezekowitz
,
“In-vivo fluorescence spectroscopy of normal and atherosclerotic arteries,”
Proc. SPIE , 906 314
–319
(1988). Google Scholar
D. Yang
and
C. Zeng
,
“Analysis on the clinical applicability of laser excited autofluorescence spectra for oral cancer diagnosis,”
Chin. J. Lasers , 18
(2), 144
–148
(1991). Google Scholar
V. R. Kolli
,
H. E. Savage
,
T. J. Yao
, and
S. P. Schantz
,
“Native cellular fluorescence of neoplastic upper aerodigestive mucosa,”
Arch. Otolaryngol. Head Neck Surg. , 121
(11), 1287
–1292
(1995). Google Scholar
J. K. Dhingra
,
D. F. Perrault Jr.
,
K. McMillan
,
E. E. Rebeiz
,
S. Kabani
,
R. Manoharan
,
I. Itzkan
,
M. S. Feld
, and
S. M. Shapshay
,
“Early diagnosis of upper aerodigestive tract cancer by autofluorescence,”
Arch. Otolaryngol. Head Neck Surg. , 122
(11), 1181
–1186
(1996). Google Scholar
C. T. Chen
,
C. Y. Wang
,
Y. S. Kuo
,
H. H. Chiang
,
S. N. Chow
,
I. Y. Hsiao
, and
C. P. Chiang
,
“Light-induced fluorescence spectroscopy: a potential diagnostic tool for oral neoplasia,”
Proc. Natl. Sci. Counc Repub China B , 20
(4), 123
–130
(1996). Google Scholar
E. W. J. van der Breggen
,
A. I. Rem
,
M. M. Christian
,
C. J. Yang
,
K. H. Calhoun
,
H. Sterenborg
, and
M. Motamedi
,
“Spectroscopic detection of oral and skin tissue transformation in a model for squamous cell carcinoma: autofluorescence versus systemic aminolevulinic acid-induced fluorescence,”
IEEE J. Sel. Top. Quantum Electron. , 2
(4), 997
–1007
(1996). Google Scholar
D. R. Ingrams
,
J. K. Dhingra
,
K. Roy
,
D. F. Perrault Jr.
,
I. D. Bottrill
,
S. Kabani
,
E. E. Rebeiz
,
M. M. Pankratov
,
S. M. Shapshay
,
R. Manoharan
,
I. Itzkan
, and
M. S. Feld
,
“Autofluorescence characteristics of oral mucosa,”
Head Neck , 19
(1), 27
–32
(1997). Google Scholar
A. Fryen
,
H. Glanz
,
W. Lohmann
,
T. Dreyer
, and
R. M. Bohle
,
“Significance of autofluorescence for the optical demarcation of field cancerisation in the upper aerodigestive tract,”
Acta Oto-Laryngol. , 117
(2), 316
–319
(1997). Google Scholar
K. Svanberg
,
C. af Klinteberg
,
A. Nilsson
,
I. Wang
,
S. Andersson-Engels
, and
S. Svanberg
,
“Laser-based spectroscopic methods in tissue characterization,”
Ann. N.Y. Acad. Sci. , 838 123
–129
(1998). Google Scholar
A. Gillenwater
,
R. Jacob
,
R. Ganeshappa
,
B. Kemp
,
A. K. El-Naggar
,
J. L. Palmer
,
G. Clayman
,
M. F. Mitchell
, and
R. Richards-Kortum
,
“Noninvasive diagnosis of oral neoplasia based on fluorescence spectroscopy and native tissue autofluorescence,”
Arch. Otolaryngol. Head Neck Surg. , 124
(11), 1251
–1258
(1998). Google Scholar
C. T. Chen
,
H. K. Chiang
,
S. N. Chow
,
C. Y. Wang
,
Y. S. Lee
,
J. C. Tsai
, and
C. P. Chiang
,
“Autofluorescence in normal and malignant human oral tissues and in DMBA-induced hamster buccal pouch carcinogenesis,”
J. Oral Pathol. Med. , 27
(10), 470
–474
(1998). Google Scholar
A. Mahadevan
,
M. F. Mitchell
,
E. Silva
,
S. Thomsen
, and
R. R. Richards-Kortum
,
“Study of the fluorescence properties of normal and neoplastic human cervical tissue,”
Lasers Surg. Med. , 13
(6), 647
–655
(1993). Google Scholar
N. Ramanujam
,
M. F. Mitchell
,
A. Mahadevan
,
S. Warren
,
S. Thomsen
,
E. Silva
, and
R. Richards-Kortum
,
“In vivo diagnosis of cervical intraepithelial neoplasia using 337-nm-excited laser-induced fluorescence,”
Proc. Natl. Acad. Sci. U.S.A. , 91
(21), 10193
–10197
(1994). Google Scholar
R. Richards-Kortum
,
M. F. Mitchell
,
N. Ramanujam
,
A. Mahadevan
, and
S. Thomsen
,
“In vivo fluorescence spectroscopy: potential for non-invasive, diagnosis of cervical intraepithelial neoplasia and use as a surrogate endpoint biomarker,”
J. Cell Biochem. Suppl. , 19 111
–119
(1994). Google Scholar
N. Ramanujam
,
M. F. Mitchell
,
A. Mahadevan
,
S. Thomsen
,
E. Silva
, and
R. Richards-Kortum
,
“Fluorescence spectroscopy: a diagnostic tool for cervical intraepithelial neoplasia (CIN),”
Gynecol. Oncol. , 52
(1), 31
–38
(1994). Google Scholar
E. N. Atkinson
,
M. F. Mitchell
,
N. Ramanujam
, and
R. Richards-Kortum
,
“Statistical techniques for diagnosing CIN using fluorescence spectroscopy: SVD and CART,”
J. Cell Biochem. Suppl. , 23 125
–130
(1995). Google Scholar
N. Ramanujam
,
M. F. Mitchell
,
A. Mahadevan-Jansen
,
S. L. Thomsen
,
G. Staerkel
,
A. Malpica
,
T. Wright
,
N. Atkinson
, and
R. Richards-Kortum
,
“Cervical precancer detection using a multivariate statistical algorithm based on laser-induced fluorescence spectra at multiple excitation wavelengths,”
Photochem. Photobiol. , 64
(4), 720
–735
(1996). Google Scholar
C. K. Brookner
,
A. Agrawal
,
E. V. Trujillo
,
M. F. Mitchell
, and
R. R. Richards-Kortum
,
“Safety analysis: relative risks of ultraviolet exposure from fluorescence spectroscopy and colposcopy are comparable,”
Photochem. Photobiol. , 65
(6), 1020
–1025
(1997). Google Scholar
E. V. Trujillo
,
D. Sandison
,
N. Ramanujam
,
M. Follen-Mitchell
,
S. Cantor
, and
R. Richards-Kortum
,
“Development of a cost-effective optical system for detection of cervical pre-cancer,”
Proc. IEEE Eng. Med. Biol. , 1 191
–193
(1997). Google Scholar
E. V. Trujillo
,
D. R. Sandison
,
U. Utzinger
,
N. Ramanujam
,
M. F. Mitchell
, and
R. Richards-Kortum
,
“Method to determine tissue fluorescence efficiency in vivo and predict signal-to-noise ratio for spectrometers,”
Appl. Spectrosc. , 52
(7), 943
–951
(1998). Google Scholar
K. Tumer
,
N. Ramanujam
,
J. Ghosh
, and
R. Richards-Kortum
,
“Ensembles of radial basis function networks for spectroscopic of cervical precancer,”
IEEE Trans. Biomed. Eng. , 45
(8), 953
–961
(1998). Google Scholar
S. B. Cantor
,
M. F. Mitchell
,
G. Tortolero-Luna
,
C. S. Bratka
,
D. C. Bodurka
, and
R. Richards-Kortum
,
“Cost-effectiveness analysis of diagnosis and management of cervical squamous intraepithelial lesions,”
Obstet. Gynecol. (N.Y.) , 91
(2), 270
–277
(1998). Google Scholar
S. R. Utts
,
P. S. Yu
, and
E. A. Pilipenko
,
“Laser fluorescence spectroscopy of human skin in vivo: the effect of erythema,”
Opt. Spektrosk. , 76
(5), 864
–868
(1994). Google Scholar
S. R. Utz
,
J. Bart
, and
P. Knuschke
,
“Fluorescence spectroscopy in dermatology,”
Ross. Akad. Nauk , 59 174
–178
(1995). Google Scholar
H. J. Sterenborg
,
A. E. Saarnak
,
R. Frank
, and
M. Motamedi
,
“Evaluation of spectral correction techniques for fluorescence measurements on pigmented lesions in vivo,”
J. Photochem. Photobiol., B , 35
(3), 159
–165
(1996). Google Scholar
N. Kollias
,
R. Gillies
,
C. Cohen-Goihman
,
S. B. Phillips
,
J. A. Muccini
,
M. J. Stiller
, and
L. A. Drake
,
“Fluorescence photography in the evaluation of hyperpigmentation in photodamaged skin,”
J. Am. Acad. Dermatol. , 36
(2), 226
–230
(1997). Google Scholar
P. Siniehkin Yu
,
S. R. Utz
,
A. H. Mavliutov
, and
H. A. Pilipenko
,
“In vivo fluorescence spectroscopy of the human skin: experiments and models,”
J. Biomed. Opt. , 3
(2), 201
–211
(1998). Google Scholar
N. Kollias
,
R. Gillies
,
M. Moran
,
I. E. Kochevar
, and
R. R. Anderson
,
“Endogenous skin fluorescence includes bands that may serve as quantitative markers of aging and photoaging,”
J. Invest. Dermatol. , 111
(5), 776
–780
(1998). Google Scholar
R. R. Alfano
,
D. B. Tata
,
J. J. Cordero
,
P. Tomashefsky
,
F. W. Longo
, and
M. A. Alfano
,
“Laser induced fluorescence spectroscopy from native cancerous and normal tissue,”
IEEE J. Quantum Electron. , 20
(12), 1507
–1511
(1984). Google Scholar
M. D. Hallewin
,
L. Baert
, and
H. Vanherzeele
,
“In vivo fluorescence detection of human bladder carcinoma without sensitizing agents,”
J. Am. Paraplegia Soc. , 17
(4), 161
–164
(1994). Google Scholar
K. T. Schomacker
,
T. J. Flotte
, and
T. F. Deutsch
,
“Laser-induced fluorescence detection of dysplasia in rat urinary bladder,”
Proc. CLEO , 8 69
–70
(1994). Google Scholar
M. Anidjar
,
D. Ettori
,
O. Cussenot
,
P. Meria
,
F. Desgrandchamps
,
A. Cortesse
,
P. Teillac
,
A. Le Duc
, and
S. Avrillier
,
“Laser induced autofluorescence diagnosis of bladder tumors: dependence on the excitation wavelength,”
J. Urol. (Baltimore) , 156
(5), 1590
–1596
(1996). Google Scholar
F. Koenig
and
F. J. McGovern
,
“Fluorescence detection of bladder carcinoma,”
Urology , 50
(5), 778
–779
(1997). Google Scholar
F. Koenig
,
F. J. McGovern
,
H. Enquist
,
R. Larne
,
T. F. Deutsch
, and
K. T. Schomacker
,
“Autofluorescence guided biopsy for the early diagnosis of bladder carcinoma,”
J. Urol. (Baltimore) , 159
(6), 1871
–1875
(1998). Google Scholar
M. Anidjar
,
O. Cussenot
,
S. Avrillier
,
D. Ettori
,
P. Teillac
, and
A. Le Duc
,
“The role of laser-induced autofluorescence spectroscopy in bladder tumor detection. Dependence on the excitation wavelength,”
Ann. N.Y. Acad. Sci. , 838 130
–142
(1998). Google Scholar
O. J. Balchum
,
A. E. Profio
,
D. R. Doiron
, and
G. C. Huth
,
“Imaging fluorescence bronchoscopy for localizing early bronchial cancer and carcinoma in situ,”
Prog. Clin. Biol. Res. , 170 847
–861
(1984). Google Scholar
J. Hung
,
S. Lam
,
J. C. LeRiche
, and
B. Palcic
,
“Autofluorescence of normal and malignant bronchial tissue,”
Lasers Surg. Med. , 11
(2), 99
–105
(1991). Google Scholar
J. Qu
,
C. MacAulay
,
S. Lam
, and
B. Palcic
,
“Laser-induced fluorescence spectroscopy at endoscopy: tissue optics, Monte Carlo modeling, and in vivo measurements,”
Opt. Eng. , 34
(11), 3334
–3343
(1995). Google Scholar
G. A. Wagnieres
,
A. P. Studzinski
, and
H. E. van den Bergh
,
“An endoscopic fluorescence imaging system for simultaneous visual examination and photodetection of cancers,”
Rev. Sci. Instrum. , 68
(1), 203
–212
(1997). Google Scholar
M. Panjehpour
,
B. F. Overholt
,
J. L. Schmidhammer
,
C. Farris
,
P. F. Buckley
, and
T. Vo-Dinh
,
“Spectroscopic diagnosis of esophageal cancer: new classification improved measurement system,”
Gastrointest Endosc , 41
(6), 577
–581
(1995). Google Scholar
M. Panjehpour
,
B. F. Overholt
,
T. Vo-Dinh
,
R. C. Haggitt
,
D. H. Edwards
, and
F. P. Buckley III
,
“Endoscopic fluorescence detection of high-grade dysplasia in Barrett’s esophagus,”
Gastroenterology , 111
(1), 93
–101
(1996). Google Scholar
Z. Haishan
,
A. Weiss
,
C. E. MacAulay
,
N. MacKinnon
,
R. Cline
, and
R. Dawson
,
“Development of a fluorescence video endoscopy imaging system for the early detection of cancer in the gastrointestinal tract,”
Proc. SPIE , 2976 291
–296
(1997). Google Scholar
H. Stepp
,
R. Sroka
, and
R. Baumgartner
,
“Fluorescence endoscopy of gastrointestinal diseases: basic principles, techniques, and clinical experience,”
Endoscopy , 30
(4), 379
–386
(1998). Google Scholar
H. Zeng
,
A. Weiss
,
R. Cline
, and
C. E. MacAualy
,
“Real-time endoscopic fluorescence imaging for early cancer detection in the gastrointestinal tract,”
Bioimaging , 6
(4), 151
–165
(1998). Google Scholar
H. Messmann
,
R. Knuchel
,
W. Baumler
,
A. Holstege
, and
J. Scholmerich
,
“Endoscopic fluorescence detection of dysplasia in patients with Barrett’s esophagus, ulcerative colitis, or adenomatous polyps after 5-aminolevulinic acid-induced protoporphyrin IX sensitization,”
Gastrointest Endosc , 49
(1), 97
–101
(1999). Google Scholar
W. Chen
and
G. Wei
,
“Multivariate discriminating algorithm for analyzing laser-induced fluorescence spectra of human gastrointestinal cancer,”
Proc. SPIE , 3414 2
–10
(1998). Google Scholar
T. McKechnie
,
A. Jahan
,
I. Tait
,
A. Cuschieri
,
W. Sibbett
, and
M. Padgett
,
“An endoscopic system for the early detection of cancers of the gastrointestinal tract,”
Rev. Sci. Instrum. , 69
(6), 2521
–2523
(1998). Google Scholar
B. Banerjee
,
B. Miedema
, and
H. R. Chandrasekhar
,
“Emission spectra of colonic tissue and endogenous fluorophores,”
Am. J. Med. Sci. , 316
(3), 220
–226
(1998). Google Scholar
M. A. Mycek
,
K. T. Schomacker
, and
N. S. Nishioka
,
“Colonic polyp differentiation using time-resolved autofluorescence spectroscopy,”
Gastrointest Endosc , 48
(4), 390
–394
(1998). Google Scholar
N. E. Marcon
and
B. C. Wilson
,
“The value of fluorescence techniques in gastrointestinal endoscopy—better than the endoscopist’s eye? II: The North American experience,”
Endoscopy , 30
(4), 419
–421
(1998). Google Scholar
J. Haringsma
and
G. N. Tytgat
,
“The value of fluorescence techniques in gastrointestinal endoscopy: better than the endoscopist’s eye? I: The European experience,”
Endoscopy , 30
(4), 416
–418
(1998). Google Scholar
T. D. Wang
,
G. S. Janes
,
Y. Wang
,
I. Itzkan
,
J. Van Dam
, and
M. S. Feld
,
“Mathematical model of fluorescence endoscopic image formation,”
Appl. Opt. , 37
(34), 8103
–8111
(1998). Google Scholar
A. G. Bohorfoush
,
“Tissue spectroscopy for gastrointestinal diseases,”
Endoscopy , 28
(4), 372
–380
(1996). Google Scholar
G. I. Zonios
,
R. M. Cothren
,
J. T. Arendt
,
W. Jun
,
J. Van Dam
,
J. M. Crawford
,
R. Manoharan
, and
M. S. Feld
,
“Morphological model of human colon tissue fluorescence,”
IEEE Trans. Biomed. Eng. , 43
(2), 113
–122
(1996). Google Scholar
T. J. Romer
,
M. Fitzmaurice
,
R. M. Cothren
,
R. Richards-Kortum
,
R. Petras
,
M. V. Sivak Jr.
, and
J. R. Kramer Jr.
,
“Laser-induced fluorescence microscopy of normal colon and dysplasia in colonic adenomas: implications for spectroscopic diagnosis,”
Am. J. Gastroenterol. , 90
(1), 81
–87
(1995). Google Scholar
G. Bottiroli
,
A. C. Croce
,
D. Locatelli
,
R. Marchesini
,
E. Pignoli
,
S. Tomatis
,
C. Cuzzoni
,
S. Di Palma
,
M. Dalfante
, and
P. Spinelli
,
“Natural fluorescence of normal and neoplastic human colon: a comprehensive ‘ex vivo’ study,”
Lasers Surg. Med. , 16
(1), 48
–60
(1995). Google Scholar
Y. Yang
,
G. C. Tang
,
M. Bessler
, and
R. R. Alfano
,
“Fluorescence spectroscopy as a photonic pathology method for detecting colon cancer,”
Lasers Life Sci. , 6
(4), 259
–276
(1995). Google Scholar
R. Marchesini
,
M. Brambilla
,
E. Pignoli
,
G. Bottiroli
,
A. C. Croce
,
M. Dal Fante
,
P. Spinelli
, and
S. di Palma
,
“Light-induced fluorescence spectroscopy of adenomas, adenocarcinomas and non-neoplastic mucosa in human colon. I. In vitro measurements,”
J. Photochem. Photobiol., B , 14
(3), 219
–230
(1992). Google Scholar
R. Richards-Kortum
,
R. P. Rava
,
R. E. Petras
,
M. Fitzmaurice
,
M. Sivak
, and
M. S. Feld
,
“Spectroscopic diagnosis of colonic dysplasia,”
Photochem. Photobiol. , 53
(6), 777
–786
(1991). Google Scholar
C. R. Kapadia
,
F. W. Cutruzzola
,
O. B. KM
,
M. L. Stetz
,
R. Enriquez
, and
L. I. Deckelbaum
,
“Laser-induced fluorescence spectroscopy of human colonic mucosa. Detection of adenomatous transformation,”
Gastroenterology , 99
(1), 150
–157
(1990). Google Scholar
R. M. Cothren
,
R. Richards-Kortum
,
M. V. Sivak Jr.
,
M. Fitzmaurice
,
R. P. Rava
,
G. A. Boyce
,
M. Doxtader
,
R. Blackman
,
T. B. Ivanc
, and
G. B. Hayes
,
“Gastrointestinal tissue diagnosis by laser-induced fluorescence spectroscopy at endoscopy,”
Gastrointest Endosc , 36
(2), 105
–111
(1990). Google Scholar
R. R. Alfano
,
G. C. Tang
,
A. Pradhan
,
W. Lam
,
D. S. J. Choy
, and
E. Opher
,
“Fluorescence spectra from cancerous and normal human breast and lung tissues,”
IEEE J. Quantum Electron. , QE-23
(10), 1806
–1811
(1987). Google Scholar
R. R. Alfano
,
A. Pradhan
,
G. C. Tang
, and
S. J. Wahl
,
“Optical spectroscopic diagnosis of cancer and normal breast tissues,”
J. Opt. Soc. Am. B , 6 1015
–1023
(1989). Google Scholar
G. C. Tang
,
A. Pradhan
,
S. Wenling
,
J. Chen
,
C. H. Liu
,
S. J. Wahl
, and
R. R. Alfano
,
“Pulsed and cw laser fluorescence spectra from cancerous, normal, and chemically treated normal human breast and lung tissues,”
Appl. Opt. , 28
(12), 2337
–2342
(1989). Google Scholar
Y. Yang
,
A. Katz
,
E. J. Celmer
,
M. Zurawska-Szczepaniak
, and
R. R. Alfano
,
“Optical spectroscopy of benign and malignant breast tissues,”
Lasers Life Sci. , 7
(2), 115
–127
(1996). Google Scholar
P. K. Gupta
,
S. K. Majumder
, and
A. Uppal
,
“Breast cancer diagnosis using N2 laser excited autofluorescence spectroscopy,”
Lasers Surg. Med. , 21
(5), 417
–422
(1997). Google Scholar
Y. Yuanlong
,
E. J. Celmer
,
M. Zurawska-Szczepaniak
, and
R. R. Alfano
,
“Excitation spectrum of malignant and benign breast tissues: a potential optical biopsy approach,”
Lasers Life Sci. , 7
(4), 249
–265
(1997). Google Scholar
S. Thomsen
and
D. Tatman
,
“Physiological and pathological factors of human breast disease that influence optical diagnosis,”
Ann. N.Y. Acad. Sci. , 838 171
–193
(1998). Google Scholar
J. H. Dowson
and
S. J. Harris
,
“Quantitative studies of the autofluorescence derived from neuronal lipofuscin,”
J. Microsc. , 123
(3), 249
–258
(1981). Google Scholar
S. Montan
and
L. G. Stromblad
,
“Spectral characterization of brain tumors utilizing laser-induced fluorescence,”
Lasers Life Sci. , 1
(4), 275
–285
(1987). Google Scholar
Y. Yang
,
L. Li
,
Y. Ye
,
Q. Zhu
, and
H. Zhang
,
“Laser excited autofluorescence of brain tumor and accumulation of endogenous porphyrin,”
Chin. J. Lasers , 17
(5), 318
–320
(1990). Google Scholar
S. Andersson-Engels
,
J. Johansson
, and
S. Svanberg
,
“Medical diagnostic system based on simultaneous multispectral fluorescence imaging,”
Appl. Opt. , 33
(34), 8022
–8029
(1994). Google Scholar
H. A. Ward
,
“New laser techniques for diagnosis and treatment of deep-seated brain lesions,”
J. Laser Appl. , 10
(5), 224
–228
(1998). Google Scholar
C. Kittrell
,
R. L. Willett
,
C. de los Santos-Pacheo
,
N. B. Ratliff
,
J. R. Kramer
,
E. G. Malk
, and
M. S. Feld
,
“Diagnosis of fibrous arterial atherosclerosis using fluorescence,”
Appl. Opt. , 24
(15), 2280
–2281
(1985). Google Scholar
M. P. Sartori
,
R. A. Sauerbrey
,
S. Kubodera
,
F. K. Tittel
,
R. Roberts
, and
P. D. Henry
,
“Autofluorescence maps of atherosclerotic human arteries-a new technique in medical imaging,”
IEEE J. Quantum Electron. , QE-23
(10), 1794
–1797
(1987). Google Scholar
R. Richards-Kortum
,
R. P. Rava
,
R. Cothren
,
A. Metha
,
M. Fitzmaurice
,
N. B. Ratliff
,
J. R. Kramer
,
C. Kittrell
, and
M. S. Feld
,
“A model for extraction of diagnostic information from laser induced fluorescence spectra of human artery wall,”
Spectrochim. Acta, Part A , 45A
(1), 87
–93
(1989). Google Scholar
R. Richards-Kortum
,
R. P. Rava
,
M. Fitzmaurice
,
L. L. Tong
,
N. B. Ratliff
,
J. R. Kramer
, and
M. S. Feld
,
“A one-layer model of laser-induced fluorescence for diagnosis of disease in human tissue: applications to atherosclerosis,”
IEEE Trans. Biomed. Eng. , 36
(12), 1222
–1232
(1989). Google Scholar
K. O. Brien
,
A. F. Gmitro
,
G. R. Gindi
,
M. L. Stetz
,
F. W. Cutruzzola
,
L. I. Laifer
, and
L. I. Deckelbaum
,
“Development and evaluation of spectral classification algorithms for fluorescence guided laser angioplasty,”
IEEE Trans. Biomed. Eng. , 36
(4), 424
–431
(1989). Google Scholar
G. H. Pettit
,
R. Pini
,
F. K. Tittel
,
R. Sauerbrey
,
M. P. Sartori
, and
P. D. Henry
,
“Excimer laser induced autofluorescence from atherosclerotic human arteries,”
Lasers Life Sci. , 3
(4), 205
–215
(1990). Google Scholar
M. Keijzer
,
R. R. Richards-Kortum
,
S. L. Jacques
, and
M. S. Feld
,
“Fluorescence spectroscopy of turbid media: autofluorescence of the human aorta,”
Appl. Opt. , 28 4286
–4292
(1990). Google Scholar
T. G. Papazoglou
,
T. Papaioannou
,
K. Arakawa
,
M. Fishbein
,
V. Z. Marmarelis
, and
W. S. Grundfest
,
“Control of excimer laser aided tissue ablation via laser-induced fluorescence monitoring,”
Appl. Opt. , 29
(33), 4950
–4955
(1990). Google Scholar
G. R. Gindi
,
C. J. Darken
,
O. B. KM
,
M. L. Stetz
, and
L. I. Deckelbaum
,
“Neural network and conventional classifiers for fluorescence-guided angioplasty,”
IEEE Trans. Biomed. Eng. , 38
(3), 246
–252
(1991). Google Scholar
S. Andersson-Engels
,
A. Gustafson
,
J. Johansson
,
U. Stenram
,
K. Svanberg
, and
S. Svanberg
,
“Investigation of possible fluorophores in human atherosclerotic,”
Lasers Life Sci. , 5
(1–2), 1
–11
(1992). Google Scholar
S. Warren
,
K. Pope
,
Y. Yazdi
,
A. J. Welch
,
S. Thomsen
,
A. L. Johnston
,
M. J. Davis
, and
R. Richards-Kortum
,
“Combined ultrasound and fluorescence spectroscopy for physico-chemical imaging of atherosclerosis,”
IEEE Trans. Biomed. Eng. , 42
(2), 121
–132
(1995). Google Scholar
R. T. Strebel
,
U. Utzinger
,
M. Peltola
,
J. Schneider
,
P. F. Niederer
, and
O. M. Hess
,
“Excimer laser spectroscopy: Influence of tissue ablation on vessel wall fluorescence,”
J. Laser Appl. , 10
(1), 34
–40
(1998). Google Scholar
D. W. Hochman
,
“Intrinsic optical changes in neuronal tissue. Basic mechanisms,”
Neurosurg. Clin. N. Am. , 8
(3), 393
–412
(1997). Google Scholar
R. Richards-Kortum
and
E. Sevick-Muraca
,
“Quantitative optical spectroscopy for tissue diagnosis,”
Annu. Rev. Phys. Chem. , 47 555
–606
(1996). Google Scholar
A. Gillenwater
,
R. Jacob
, and
R. Richards-Kortum
,
“Fluorescence spectroscopy: a technique with potential to improve the early detection of aerodigestive tract neoplasia,”
Head Neck , 20
(6), 556
–562
(1998). Google Scholar
S. Andersson-Engels
,
C. Klinteberg
,
K. Svanberg
, and
S. Svanberg
,
“In vivo fluorescence imaging for tissue diagnostics,”
Phys. Med. Biol. , 42
(5), 815
–824
(1997). Google Scholar
I. J. Bigio
and
J. R. Mourant
,
“Ultraviolet and visible spectroscopies for tissue diagnostics: fluorescence spectroscopy and elastic-scattering spectroscopy,”
Phys. Med. Biol. , 42
(5), 803
–814
(1997). Google Scholar
T. G. Papazoglou
,
“Malignancies and atherosclerotic plaque diagnosis--is laser induced fluorescence spectroscopy the ultimate solution?,”
J. Photochem. Photobiol., B , 28
(1), 3
–11
(1995). Google Scholar
N. S. Nishioka
,
“Laser-induced fluorescence spectroscopy,”
Gastroenterol. Endosc. Clin. North Am. , 4
(2), 313
–326
(1994). Google Scholar
G. A. Wagnieres
,
W. M. Star
, and
B. C. Wilson
,
“In vivo fluorescence spectroscopy and imaging for oncological applications,”
Photochem. Photobiol. , 68
(5), 603
–632
(1998). Google Scholar
K. Pope
,
S. Warren
,
Y. Yazdi
,
J. Johnston
,
M. Davis
, and
R. Richards-Kortum
,
“Dual imaging of arterial walls: intravascular ultrasound and fluorescence spectroscopy,”
Proc. SPIE , 1878 42
–50
(1993). Google Scholar
J. T. Pfefer
,
K. T. Schomacker
, and
N. S. Nishioka
,
“Effect of fiber optic probe design on fluorescent light propagation in tissue,”
Proc. SPIE , 4257 410
–416
(2001). Google Scholar
A. Agrawal
,
U. Utzinger
,
C. Brookner
,
C. Pitris
,
M. F. Mitchell
, and
R. Richards-Kortum
,
“Fluorescence spectroscopy of the cervix: influence of acetic acid, cervical mucus, and vaginal medications,”
Lasers Surg. Med. , 25
(3), 237
–249
(1999). Google Scholar
R. J. Nordstrom
,
L. Burke
,
J. M. Niloff
, and
J. F. Myrtle
,
“Identification of cervical intraepithelial neoplasia (CIN) using UV-excited fluorescence and diffuse-reflectance tissue spectroscopy,”
Lasers Surg. Med. , 29 118
–127
(2001). Google Scholar
D. G. Ferris
,
R. A. Lawhead
,
E. D. Dickman
,
N. Holtzapple
,
J. A. Miller
,
S. Grogan
,
S. Bambot
,
A. Agrawal
, and
M. L. Faupel
,
“Multimodal hyperspectral imaging for the noninvasive diagnosis of cervical neoplasia,”
J. Lower Genital Tract Dis. , 5
(2), 65
–72
(2001). Google Scholar
N. Ramanujam
,
J. Chen
,
K. Gossage
,
R. Richards-Kortum
, and
B. Chance
,
“Fast and noninvasive fluorescence imaging of biological tissues in vivo using a flying-spot scanner,”
IEEE Trans. Biomed. Eng. , 48
(9), 1034
–1041
(2001). Google Scholar
A. K. Dattamajumdar, D. Wells, J. Parnell, J. T. Lewis, D. Ganguly, and T. C. Wright Jr., “Preliminary experimental results from multi-center clinical trials for detection of cervical precancerous lesions using the cerviscan system: a novel full field evoked fluorescence based imaging instrument,” Proc. IEEE Eng. Med. Biol. 23, (2001).
S. Avrillier
,
E. Tinet
,
D. Ettori
,
J. M. Tualle
, and
B. Ge´le´bart
,
“Influence of the emission-reception geometry in laser-induced fluorescence spectra from turbid media,”
Appl. Opt. , 37
(13), 2781
–2787
(1998). Google Scholar
J. A. Zuclich
,
T. Shimada
,
T. R. Loree
,
I. Bigio
,
K. Strobl
, and
N. Shuming
,
“Rapid noninvasive optical characterization of the human lens,”
Lasers Life Sci. , 6
(1), 39
–53
(1994). Google Scholar
A. F. Zuluaga
,
U. Utzinger
,
A. Durkin
,
H. Fuchs
,
A. Gillenwater
,
R. Jacob
,
B. Kemp
,
J. Fan
, and
R. Richards-Kortum
,
“Fluorescence excitation emission matrices of human tissue: a system for in vivo measurement and method of data analysis,”
Appl. Spectrosc. , 53
(3), 302
–311
(1999). Google Scholar
J. J. Baraga
,
M. S. Feld
, and
R. P. Rava
,
“In situ optical histochemistry of human artery using near infrared Fourier transform Raman spectroscopy,”
Proc. Natl. Acad. Sci. U.S.A. , 89
(8), 3473
–3477
(1992). Google Scholar
A. J. Berger
,
Y. Wang
, and
M. S. Feld
,
“Rapid, noninvasive concentration measurements of aqueous biological analytes by near-infrared Raman spectroscopy,”
Appl. Opt. , 35
(1), 209
–212
(1996). Google Scholar
A. J. Berger
,
I. Itzkan
, and
M. S. Feld
,
“Feasibility of measuring blood glucose concentration by near-infrared Raman spectroscopy,”
Spectrochim. Acta, Part A , 53A
(2), 287
–292
(1997). Google Scholar
C. J. Frank
,
D. C. Redd
,
T. S. Gansler
, and
R. L. McCreery
,
“Characterization of human breast biopsy specimens with near-IR Raman spectroscopy,”
Anal. Chem. , 66
(3), 319
–326
(1994). Google Scholar
C. J. Frank
,
R. L. McCreery
, and
D. C. Redd
,
“Raman spectroscopy of normal and diseased human breast tissues,”
Anal. Chem. , 67
(5), 777
–783
(1995). Google Scholar
M. Gniadecka
,
H. C. Wulf
,
N. N. Mortensen
,
O. F. Nielsen
, and
D. H. Christensen
,
“Diagnosis of basal cell carcinoma by Raman spectroscopy,”
J. Raman Spectrosc. , 28
(2–3), 125
–129
(1997). Google Scholar
K. Kneipp
,
H. Kneipp
,
V. B. Kartha
,
R. Manoharan
,
G. Deinum
,
I. Itzkan
,
R. R. Dasari
, and
M. S. Feld
,
“Detection and identification of a single DNA base molecule using surface-enhanced Raman scattering (SERS),”
Phys. Rev. E , 57
(6), R6281
–R6284
(1998). Google Scholar
A. Mahadevan-Jansen
,
M. F. Mitchell
,
N. Ramanujam
,
U. Utzinger
, and
R. Richards-Kortum
,
“Development of a fiber optic probe to measure NIR Raman spectra of cervical tissue in vivo,”
Photochem. Photobiol. , 68
(3), 427
–431
(1998). Google Scholar
A. Mahadevan-Jansen
,
M. F. Mitchell
,
N. Ramanujam
,
A. Malpica
,
S. Thomsen
,
U. Utzinger
, and
R. Richards-Kortum
,
“Near-infrared Raman spectroscopy for in vitro detection of cervical precancers,”
Photochem. Photobiol. , 68
(1), 123
–132
(1998). Google Scholar
R. Manoharan
,
J. J. Baraga
,
M. S. Feld
, and
R. P. Rava
,
“Quantitative histochemical analysis of human artery using Raman spectroscopy,”
J. Photochem. Photobiol., B , 16
(2), 211
–233
(1992). Google Scholar
R. Manoharan
,
Y. Wang
,
R. R. Dasari
,
S. S. Singer
,
R. P. Rava
, and
M. S. Feld
,
“Ultraviolet resonance Raman spectroscopy for detection of colon cancer,”
Lasers Life Sci. , 6
(4), 217
–227
(1995). Google Scholar
R. Manoharan
,
W. Yang
, and
M. S. Feld
,
“Histochemical analysis of biological tissues using Raman spectroscopy,”
Spectrochim. Acta, Part A , 52A
(2), 215
–249
(1996). Google Scholar
R. Manoharan
,
K. Shafer
,
L. Perelman
,
J. Wu
,
K. Chen
,
G. Deinum
,
M. Fitzmaurice
,
J. Myles
,
J. Crowe
,
R. R. Dasari
, and
M. S. Feld
,
“Raman spectroscopy and fluorescence photon migration for breast cancer diagnosis and imaging,”
Photochem. Photobiol. , 67
(1), 15
–22
(1998). Google Scholar
A. Mizuno
,
T. Hayashi
,
K. Tashibu
,
S. Maraishi
,
K. Kawauchi
, and
Y. Ozaki
,
“Near-infrared FT-Raman spectra of the rat brain tissues,”
Neurosci. Lett. , 141
(1), 47
–52
(1992). Google Scholar
R. P. Rava
,
J. J. Baraga
, and
M. S. Feld
,
“Near infrared Fourier transform Raman spectroscopy of human artery,”
Spectrochim. Acta 4 , 7
(3–4), 509
–512
(1991). Google Scholar
T. J. Romer
,
J. F. Brennan III
,
T. C. Schut
,
R. Wolthuis
,
R. C. van den Hoogen
,
J. J. Emeis
,
A. van der Laarse
,
A. V. Bruschke
, and
G. J. Puppels
,
“Raman spectroscopy for quantifying cholesterol in intact coronary artery wall,”
Atherosclerosis , 141
(1), 117
–124
(1998). Google Scholar
T. J. Romer
,
J. F. Brennan III
,
M. Fitzmaurice
,
M. L. Feldstein
,
G. Deinum
,
J. L. Myles
,
J. R. Kramer
,
R. S. Lees
, and
M. S. Feld
,
“Histopathology of human coronary atherosclerosis by quantifying its chemical composition with Raman spectroscopy,”
Circulation , 97
(9), 878
–885
(1998). Google Scholar
H. P. Buschman
,
E. T. Marple
,
M. L. Wach
,
B. Bennett
,
T. C. Schut
,
H. A. Bruining
,
A. V. Bruschke
,
A. van der Laarse
, and
G. J. Puppels
,
“In vivo determination of the molecular composition of artery wall by intravascular Raman spectroscopy,”
Anal. Chem. , 72
(16), 3771
–3775
(2000). Google Scholar
E. B. Hanlon
,
R. Manoharan
,
T. W. Koo
,
K. E. Shafer
,
J. T. Motz
,
M. Fitzmaurice
,
J. R. Kramer
,
I. Itzkan
,
R. R. Dasari
, and
M. S. Feld
,
“Prospects for in vivo Raman spectroscopy,”
Phys. Med. Biol. , 45
(2), R1
–R9
(2000). Google Scholar
T. R. Hata
,
T. A. Scholz
,
I. V. Ermakov
,
R. W. McClane
,
F. Khachik
,
W. Gellermann
, and
L. K. Pershing
,
“Non-invasive raman spectroscopic detection of carotenoids in human skin,”
J. Invest. Dermatol. , 115
(3), 441
–448
(2000). Google Scholar
C. J. de Lima
,
S. Sathaiah
,
L. Silveira
,
R. A. Zangaro
, and
M. T. Pacheco
,
“Development of catheters with low fiber background signals for Raman spectroscopic diagnosis applications,”
Artif. Organs , 24
(3), 231
–234
(2000). Google Scholar
M. G. Shim
,
L. M. Song
,
N. E. Marcon
, and
B. C. Wilson
,
“In vivo near-infrared Raman spectroscopy: demonstration of feasibility during clinical gastrointestinal endoscopy,”
Photochem. Photobiol. , 72
(1), 146
–150
(2000). Google Scholar
M. L. Myrick
,
S. M. Angel
, and
R. Desiderio
,
“Comparison of some fiber optic configurations for measurement of luminescence and Raman scattering,”
Appl. Opt. , 29
(9), 1333
–1344
(1990). Google Scholar
M. Myrick
and
S. Angel
,
“Elimination of background in fiber-optic Raman measurements,”
Appl. Spectrosc. , 44
(4), 565
–570
(1990). Google Scholar
K. Tanaka
,
M. T. T. Pacheco
,
J. F. Brennan III
,
I. Itzkan
,
A. J. Berger
,
R. R. Dasari
and
M. S. Feld
,
“Compound parabolic concentrator probe for efficient light collection in spectroscopy of biological tissue,”
Appl. Opt. , 35
(4), 758
–763
(1996). Google Scholar
H. Owen
,
D. Battey
,
M. Pelltier
, and
J. Slater
,
“New spectroscopic instrument based on volume holographic optical elements,”
Proc. SPIE , 2406 260
–267
(1995). Google Scholar
A. Mahadevan-Jansen
and
E. Richards-Kortum
,
“Raman spectroscopy for cancer detection: a review,”
J. Biomed. Opt. , 1
(1), 31
–70
(1998). Google Scholar
S. Lam
,
“Bronchoscopic, photodynamic, and laser diagnosis and therapy of lung neoplasms,”
Curr. Opin. Pulm Med. , 2
(4), 271
–276
(1996). Google Scholar
M. A. Biel
,
“Photodynamic therapy and the treatment of head and neck cancers,”
J. Clin. Laser Med. Surg. , 14
(5), 239
–244
(1996). Google Scholar
E. A. Popovic
,
A. H. Kaye
, and
J. S. Hill
,
“Photodynamic therapy of brain tumors,”
J. Clin. Laser Med. Surg. , 14
(5), 251
–261
(1996). Google Scholar
J. M. Nauta
,
H. L. van Leengoed
,
W. M. Star
,
J. L. Roodenburg
,
M. J. Witjes
, and
A. Vermey
,
“Photodynamic therapy of oral cancer. A review of basic mechanisms and clinical applications,”
Eur. J. Oral Sci. , 104
(2), 69
–81
(1996). Google Scholar
G. Wagnieres
,
S. Cheng
,
M. Zellweger
,
N. Utke
,
D. Braichotte
,
J. P. Ballini
, and
H. van den Bergh
,
“An optical phantom with tissue-like properties in the visible for use in PDT and fluorescence spectroscopy,”
Phys. Med. Biol. , 42
(7), 1415
–1426
(1997). Google Scholar
R. Bissonnette
and
H. Lui
,
“Current status of photodynamic therapy in dermatology,”
Dermatol. Clin. , 15
(3), 507
–519
(1997). Google Scholar
J. Moan
,
Q. Peng
,
R. Sorensen
,
V. Iani
and
J. M. Nesland
,
“The biophysical foundations of photodynamic therapy,”
Endoscopy , 30
(4), 387
–391
(1998). Google Scholar
H. van den Bergh
,
“On the evolution of some endoscopic light delivery systems for photodynamic therapy,”
Endoscopy , 30
(4), 392
–407
(1998). Google Scholar
J. F. Savary
,
P. Grosjean
,
P. Monnier
,
C. Fontolliet
,
G. Wagnieres
,
D. Braichotte
, and
H. van den Bergh
,
“Photodynamic therapy of early squamous cell carcinomas of the esophagus: a review of 31 cases,”
Endoscopy , 30
(3), 258
–265
(1998). Google Scholar
R. R. Allison
,
T. S. Mang
, and
B. D. Wilson
,
“Photodynamic therapy for the treatment of nonmelanomatous cutaneous malignancies,”
Semin Cutan Med. Surg. , 17
(2), 153
–163
(1998). Google Scholar
N. L. Oleinick
and
H. H. Evans
,
“The photobiology of photodynamic therapy: cellular targets and mechanisms,”
Radiat. Res. , 150
(5), S146
–S156
(1998). Google Scholar
H. Kato
,
“Photodynamic therapy for lung cancer—a review of 19 years’ experience,”
J. Photochem. Photobiol., B , 42
(2), 96
–99
(1998). Google Scholar
C. Fritsch
,
G. Goerz
, and
T. Ruzicka
,
“Photodynamic therapy in dermatology,”
Arch. Dermatol. , 134
(2), 207
–214
(1998). Google Scholar
M. A. Biel
,
“Photodynamic therapy and the treatment of head and neck neoplasia,”
Laryngoscope , 108
(9), 1259
–1268
(1998). Google Scholar
E. Sinfosky
,
“High power diffusion tip fibers for photocoagulation,”
Proc. IEEE LEOS , 9
(1996). Google Scholar
H. Ward
,
“Molding of laser energy by shaped optic fiber tips,”
Lasers Surg. Med. , 7 405
–413
(1987). Google Scholar
A. Nica
,
“Lens coupling in fiber-optic devices: efficiency limits,”
Appl. Opt. , 20
(18), 3136
–3145
(1981). Google Scholar
|
|||||||||||||||||||||||||||||||||||||||||||||||||||||||||||||||||||||||||||||||||||||||||||||||||||||||||||||||||||

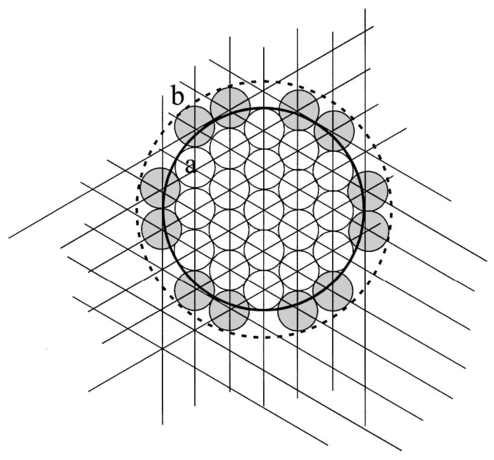

CITATIONS
Cited by 408 scholarly publications and 31 patents.
Fiber optics
Luminescence
Reflectivity
Scattering
Light scattering
Tissue optics
Raman spectroscopy


