
|
|
1.IntroductionStreptococci are the predominant group of bacteria present in the human mouth.1 2 On teeth, above the gum line, two of the most important species are S. sanguis and S. mutans. The former is by far the most prevalent bacterial constituent in healthy plaques,1 while elevated levels of the latter have been strongly associated with dental caries.2 3 4 Measurements of the relative concentrations of these two streptococci are therefore of great interest for both research and clinical purposes. Conventional methods of measuring relative bacterial concentrations rely on counting the number of colonies that grow from an original sample, i.e., a “viable counts” measurement. Such measurements require serial, log-scale dilutions of samples, plating on a range of selective and/or nonselective agar media, and a period of incubation, followed by counts of visible colonies.5 All these steps are time intensive and often imprecise. Furthermore, the measured bacterial concentrations may not accurately reflect in situ ratios. Variations in transfer efficiency to the agar plate can alter the species ratios in unpredictable ways, as can the subsequent growth rates.6 In addition, dead bacteria (e.g., bridge organisms that play an initial role in the establishment of plaque) cannot be analyzed by plating methods. In all, viable-counts measurements provide excellent dynamic range (6 or more orders of magnitude) but limited accuracy, only to within an order of magnitude. A potential alternative to conventional bacterial counting is Raman spectroscopy. Several studies in the past decade have provided evidence that different microbial species produce characteristically different Raman spectra, although specific spectral features and their biochemical origins have not been identified. Near-infrared Raman spectroscopy has been used to classify the species of various bacterial and yeast colonies,7 8 9 including oral streptococci,10 grown on agar plates. Such experiments employ confocal microscopes and are able to analyze as little as 1 μm 3 of sample.11 These studies still require the growth of colonies, however, limiting both the ease and the accuracy of the measurements. Here, we extend the Raman technique to the quantitative analysis of polybacterial mixtures. To our knowledge, this is the first evidence that bacterial Raman spectra are sufficiently different to be discriminated, even when they are superposed in a mixture spectrum. Significantly, this approach requires no colony growth. As a result, in situ bacterial ratios in samples can be predicted directly, without the effort and uncertainty of transfer to a growth medium. In addition, total experiment time is reduced because there is no incubation step. The results indicate the potential use of Raman spectroscopy for direct measurement of streptococci in oral plaques, as well as other clinically interesting microbial systems. 2.Methods2.1.Sample PreparationLaboratory stock strains of S. mutans UA15912 and S. sanguis 10904 (American Type Culture Collection, Bethesda, Maryland) were cultured in identical flasks of Todd-Hewitt liquid medium (Difco, Detroit, Michigan) for approximately 24 h. The Todd-Hewitt medium had the following proportions: 500-gm beef heart infusion, 20-gm neopeptone, 2-gm dextrose, 2-gm sodium chloride, 0.4-gm disodium chloride, and 2.5-gm sodium carbonate. These components in powder form were dissolved at 1 lb/15 L of water to form the final solution. The optical density of each culture was measured to be 0.9. Based on previous experience, this indicates that the bacteria in this study were in the stationary growth phase. Saliva was obtained from a volunteer following standard procedures, with informed consent. From these bacterial stocks, various mixtures were prepared in which the S. mutans (S. sanguis) percentage varied from 0 to 100 (100 to 0) in 4 steps. The pipeting was performed with an estimated accuracy of 2. The mixtures were centrifuged in 1-mL tubes at 3000 rpm for 10 min to achieve mixing of the two species. 26 of the mixtures (1 per concentration step) received a 0.5-mL volume addition of clarified saliva, after which the bacteria were resuspended by stirring and the mixture was left standing for 20 min. This waiting period allowed the salivary proteins to coat the bacteria. After this time, the sample was recentrifuged, washed with deionized water, and then centrifuged a third time. Salivary proteins, once attached to these bacteria, will remain attached throughout the spin-down process.13 An additional six samples (at various concentrations) were processed identically, except that no saliva was added. The spin-down process yielded a white toothpaste-like mixture of the two streptococci (with salivary proteins attached, if added). For each of the 26 samples, a tiny droplet (approximately 1 μL) was transferred onto a CaF 2 plate and allowed to dry into a film for approximately 15 min. The resulting samples were disks less than 2 mm in extent and less than 100 μm thick. We estimate that each sample contained approximately 106 bacteria, an amount that can easily be recovered from the surface of a tooth (1 to 2 orders more have been reported14 15). Even this large an amount was solely for the purpose of easy handling. The laser excitation spot itself had a much smaller diameter (30 μm) than the dried disk and excited only a few thousand bacteria. 2.2.Instrumentation and Data AcquisitionSpectra were acquired on a home-built confocal Raman microscope, as shown in Fig. 1. Raman scattering was excited by a tunable diode laser (Process Instruments, Salt Lake City, Utah) tuned to 830 nm. Laser light was delivered to the microscope by a multimode optical fiber (100 μm diam) for increased power at the expense of a greater spot size. The laser beam exiting the fiber was collimated, bandpass-filtered, and coupled into a Nikon E400 upright microscope. The objective (50×, 0.8 NA, Nikon) focused the laser to a 30-μm spot on the sample and collected the Raman scattered light, which was redirected by a dichroic beamsplitter into a second 100-μm-diam fiber (serving as the confocal pinhole) and coupled into a spectrometer (HoloSpec f/1.8, Kaiser). Although the laser spot size could be reduced for higher resolution, in our experiment a volume-averaged signal was in fact desirable. A thermoelectrically cooled back-thinned deep-depletion charge-coupled device (CCD) (DU420-BR-DD, Andor, South Windsor, CT) was used to record Raman spectra. Spectral resolution of the system was better than 6 cm −1 as measured using neon gas emission lines. Depth resolution was about 30 μm as determined by translation of a glass/air interface through the focal plane, following the method described by Caspers16 and Rajadhyaksha.17 Figure 1Schematic overview of the confocal Raman microscope. Collimated 830-nm light from a diode laser passes through a bandpass filter (BPF) and a dichroic beamsplitter (BS) before entering the microscope. The microscope objective delivers focused laser light onto samples and collects backscattered light. Stokes-shifted scattering is redirected by the beamsplitter through a long-pass filter (LPF) and into an optical fiber, which serves as a confocal pinhole. The output of the fiber is dispersed by an f/1.8 spectrograph and recorded by a cooled CCD.  Spectra were acquired for 200 s. From each sample disk, five spectra were taken at different lateral positions to compensate for sample heterogeneity. To reduce the shot noise from autofluorescence, samples were photobleached by the focused laser spot for 0 to 40 min (mean=16). This step reduced fluorescence by as much as a factor of 3 for some samples. For each sample, 200-s spectra were acquired both before and after the photobleaching process. No degradation in the Raman peaks was observed. 2.3.Data AnalysisSpectra were corrected for system background and the spectral throughput (using a tungsten lamp spectrum). The slowly varying fluorescence contribution was modeled using a least-squares fifth order polynomial fit. Spectra were smoothed to 6 cm −1 resolution (corresponding to that of the spectrometer) using a fourth-order Savitsky-Golay filter.18 19 Spectral intensity varied by an order of magnitude, due to variations in density of the evaporated disks. To correct for this effect, spectra were normalized to the integrated intensity under the CH 2 stretching peak at 1455 cm −1, as shown in Fig. 2. This standardized all spectra to equal numbers of contributing bacteria, under the dual assumption that the two species’ CH 2 scattering cross sections were equal and that no interferents contributed to that Raman band. Figure 2Typical Raman spectra of mixtures after subtraction of broad fluorescence background. The three groups represent (top) predominantly S. mutans mixtures, (middle) nearly 1:1 mixtures, and (bottom) predominantly S. sanguis mixtures. All spectra have been normalized to equal areas under the CH 2 deformation peak at 1455 cm −1, to account for variations in the number of bacteria within the focal volume. 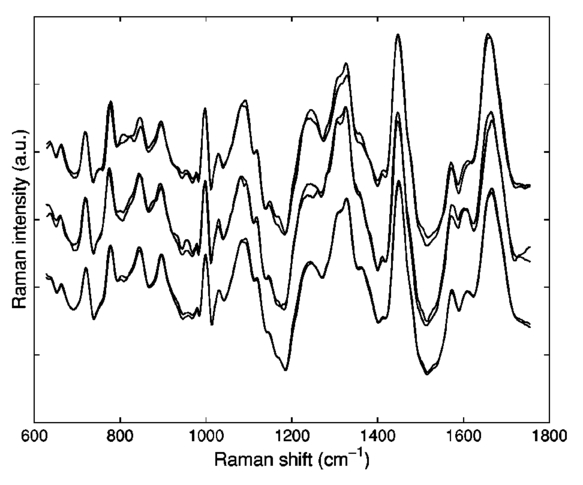 The bacterial spectra were divided into a calibration group (18 samples, 54 spectra) and a validation group (14 samples, including all of the saliva-free specimens). Partial least-squares (PLS) leave-one-sample-out cross-validation was performed on the calibration group20 to find the optimal PLS model rank (i.e., number of loading vectors) to achieve a minimal standard error of calibration. The full available spectral range from 650 to 1800 cm −1 was used. Bacterial concentration predictions were then generated for the validation group, using this calibration. All processing and analysis were accomplished with Matlab (The MathWorks, Incorporated, Natick, MA). 3.Results and DiscussionAs mentioned before, five spectra from different regions of each sample were scanned to account for sample heterogeneity. In the PLS analysis, the spectra were treated independently (i.e., five separate concentration predictions were obtained). These were then averaged to provide a single concentration prediction for each sample. This approach retained more spectral information and therefore reduced susceptibility to overfitting in the cross-validation step. The cross-validation and prediction results for the photobleached spectra are summarized in Fig. 3. In the cross-validation, four loading vectors provided a reasonable combination of near-minimal prediction error [as measured by the root mean squared error of cross-validation (RMSECV)] and low model rank, as shown in the inset. An RMSECV of 3.5 was obtained. Using a PLS calibration built from this dataset, we obtained a root mean squared error of prediction (RMSEP) of 4.3 and 4.1 for the remaining eight saliva-containing samples and the saliva-free samples, respectively, in the prediction group. It should be noted that the error associated with sample preparation, estimated at 2, is a signficant fraction of the total RMSEP. The RMSEP of the PLS predictions, relative to the (unknown) true concentrations, is most likely lower than the measured range of 4. A future experiment with more accurate reference concentrations is planned to explore this point. Figure 3Results of PLS predictions of S. mutans relative concentrations. Open circles: predictions from the 18-sample cross-validation, RMSECV=3.5, r2=0.99. X marks: validation predictions of eight samples containing saliva, RMSEP=4.3, r2=0.98. Triangles: validation predictions of six saliva-free samples, RMSEP=4.1, r2=0.99. The line of perfect prediction is provided as a guide; it is not a fit. Horizontal error bars indicate the uncertainty in the reference concentrations, due to the pipeting procedure. Inset: plot of PLS prediction error (calibration and validation) as a function of PLS model rank, showing near-optimal performance with four loading vectors.  Parallel analysis was performed using the spectra acquired prior to photobleaching. It was expected that the greater variation in fluorescence intensity would degrade the prediction of concentrations. As expected, prediction accuracy was lower, particularly for the saliva-free samples (10 error), but qualitatively similar results were obtained. As mentioned previously, the major Raman peaks did not alter noticeably during the photobleaching. These results suggest that, with more robust spectral modeling, the photobleaching step could be eliminated in future measurements. In this experiment, the two components’ concentration fractions were constrained to add to 1, and a PLS regression vector b was derived. In the ideal case, measuring a sample with S. mutans concentration f should generate a spectral vector s f=fs D+s¯, where s¯ is the mean spectrum of the two streptococci and s D is the difference of their spectra (S. mutans −S. sanguis). This equation implies that the product s˙ f⋅s D scales linearly with the concentration f. By definition, s˙ f⋅b also scales linearly with f, indicating that s D and b should have identical lineshapes. Figure 4 shows these two experimentally derived lineshapes, and they are observed to be similar. Due to experimental sources of spectral variation, s D does not in fact serve as the optimal b here. The overall similarity in lineshape, however, confirms the simplicity underlying the PLS regression. Figure 4Comparison of difference spectrum between 100 mutans and 100 sanguis (thin line) and PLS regression vector for mutans concentration (thick line). The degree of similarity permits a simple spectral explanation for the success of the PLS calibration, as discussed in the text.  These experiments provide the strongest evidence to date that species of similar bacteria can be discriminated via Raman spectroscopy, even in mixtures. At present, we can merely speculate as to the biochemical underpinnings of the spectral variations. It is unlikely that the biochemical differences being sensed are related to variations in DNA or RNA sequences. The genomes of S. mutans and S. sanguis are known to be very similar,21 and the changes in individual nucleotide molarity would therefore be too slight. It is much more likely that the variations are due to differences in protein synthesis. Some spectral evidence from earlier experiments on agar plates suggests that key differences do exist in a spectral region where amino acids have several strong bands.10 In the present experiment, the integrated intensity of several individual bands were seen to correlate strongly with S. mutans concentration (data not shown), though not as strongly as when the full spectrum and PLS were employed. One such peak occurs at 1240 cm −1, which is in the region of Amide III vibration. This is consistent with the speculation that the Raman spectroscopy can detect changes in the protein ensembles being assembled by the two streptococcal species. The number of bacteria in the microscope’s focal volume was estimated at 1000. This is several orders of magnitude less than the numbers (107 to 108) that can be recovered from the surfaces of teeth.14 15 Raman signals with intensities similar to those reported here should therefore be obtainable from tooth plaque. Salivary proteins were included in the samples to increase similarity to oral plaque. We estimate, based on the mixing proportions, that our salivary-protein-to-bacteria ratios were even higher than in vivo levels. The PLS model, developed using saliva-coated bacteria, was equally successful at predicting concentrations in saliva-coated and saliva-free bacterial specimens. The present experiment demonstrates an error of <5 in calculating the relative S. mutans content in a simplified model of oral plaque. In human supra-gingival plaque under normal conditions, S. sanguis accounts for roughly 75 of total micro-organisms, while S. mutans is usually in the few percentage range in the healthy mouth and elevated in diseased conditions.1 Detection of a few percent change in S. mutans concentration, in actual plaque samples, would therefore provide useful feedback about bacterial competition on the surface of teeth. Unlike conventional plating techniques, the Raman approach described here currently lacks the sensitivity to resolve small relative concentrations at the log scale (e.g., 1:100 versus 1:1000). The present strength of the approach is for quantitative analysis of the major bacterial components of a substance, as just mentioned. For such measurements, the Raman approach provides a complementary method to plating, with much higher accuracy in a particular fractional concentration range (1:20 through 20:1, presently). Although the present study examined only two species of bacteria, it is expected, based on our work and that of others,7 8 9 10 that such measurements can be performed in more diverse mixtures, approaching the complexity of real oral plaques and other systems of microbiological interest. 4.ConclusionThis work demonstrates the ability of confocal Raman spectroscopy to discriminate and quantify bacteria directly in mixtures. We have shown that predictions of relative populations of bacteria can be successfully deduced from confocal Raman spectra, with accuracy of a few percent. Data acquisition time was 200 s per spectrum. Significantly, no external substances are required, and no sample incubation time is needed. Inclusion of salivary proteins did not affect the accuracy of the predictions. These results indicate the potential of Raman spectroscopy as a tool to gather bacterial population information from oral plaques or other naturally occurring biological samples. Efforts are underway to investigate and develop this technique on more realistic samples, by adding still more constituents from the oral environment. Raman spectroscopy can, in general, complement traditional plating analysis by providing higher-resolution concentration analysis of major bacterial components. AcknowledgmentsInitial conversations with Thomas Foster were instrumental in establishing this collaboration. This work was performed at The Institute of Optics, except for the growth of bacterial samples, which occurred at the Center for Oral Biology. Financial support from NSF (BES-0086797 Biophotonics Partnership Initiative; AJB), DARPA (39523-6388; AJB), and NIH (NIDCR grants DE10174, DE11549, DE13683, and DE06125; RGQ) is gratefully acknowledged. REFERENCES
S. S. Socransky
and
S. D. Manganiello
,
“The oral microbiota of man from birth to senility,”
J. Periodontol. , 42 484
–494
(1971). Google Scholar
P. D. Marsh
,
“Microbiologic aspects of dental plaque and dental caries,”
Cariol. , 43 599
–614
(1999). Google Scholar
J. D. de Stoppelaar
,
J. van Houte
, and
O. B. Dirks
,
“The relationship between extracellular polysaccharide-producing streptococci and smooth surface caries in 13-year-old children,”
Caries Res. , 3 190
–199
(1969). Google Scholar
W. J. Loesche
,
“Role of Streptococcus mutans in human dental decay,”
Microbiol. Rev. , 50 353
–380
(1986). Google Scholar
A. S. McKee
,
A. S. McDermid
,
D. C. Ellwood
, and
P. Marsh
,
“The establishment of reproducible, complex communities of oral bacteria in the chemostat using defined inocula,”
J. Appl. Bacteriol. , 59 263
–275
(1985). Google Scholar
K. G. Babaahmady
,
S. J. Challacombe
,
P. D. Marsh
, and
H. N. Newman
,
“Ecological study of Streptococcus mutans, Streptococcus sobrinus and Lactobacillus species at sub-sites from approximal dental plaque from children,”
Caries Res. , 32 51
–58
(1998). Google Scholar
K. Maquelin
,
L. P. Choo-Smith
,
T. van Vreeswijk
,
H. P. Endtz
,
B. Smith
,
R. Bennett
,
H. A. Bruining
, and
G. J. Puppels
,
“Raman spectroscopic method for identification of clinically relevant microorganisms growing on solid culture medium,”
Anal. Chem. , 72 12
–19
(2000). Google Scholar
C. Kirschner
et al.;,
“Classification and identification of Enterococci: a comparative phenotypic, genotypic, and vibrational spectroscopic study,”
J. Clin. Microbiol. , 39 1763
–1770
(2001). Google Scholar
K. Maquelin
,
C. Kirschner
,
L. P. Choo-Smith
,
N. van den Braak
,
H. P. Endtz
,
D. Naumann
, and
G. J. Puppels
,
“Identification of medically relevant microorganisms by vibrational spectroscopy,”
J. Microbiol. Methods , 51 255
–271
(2002). Google Scholar
A. J. Berger
and
Q. Zhu
,
“Identification of oral bacteria by Raman microspectroscopy,”
J. Mod. Opt. , 50 2375
–2380
(2003). Google Scholar
G. J. Puppels
,
F. F. M. de Mul
,
C. Otto
,
J. Greve
,
M. Robert-Nicoud
,
D. J. Arndt-Jovin
, and
T. M. Jovin
,
“Studying single living cells and chromosomes by confocal Raman,”
Nature (London) , 347 301
–303
(1990). Google Scholar
H. H. Murchison
,
J. F. Barrett
,
G. A. Cardineau
, and
R. C. III
,
“Transformation of Streptococcus mutans with chromosomal and shuttle plasmid (pYA629) DNAs,”
Infect. Immun. , 54 273
–282
(1986). Google Scholar
K. M. Schilling
and
W. H. Bowen
,
“The activity of Glucosyltransferase adsorbed onto saliva-coated hydroxyapatite,”
J. Dent. Res. , 67 2
–8
(1988). Google Scholar
H. J. A. Beckers
and
J. S. van der Hoeven
,
“Growth rates of Actinomyces viscosus and Streptococcus mutans during early colonization of tooth surfaces in gnotobiotic rats,”
Infect. Immun. , 35 583
–587
(1982). Google Scholar
H. J. A. Beckers
and
J. S. van der Hoeven
,
“The effects of mutual interaction and host diet on the growth rates of the bacteria Actinomyces viscosus and Streptococcus mutans during colonization of tooth surfaces in di-associated gnotobiotic rats,”
Archs. Oral Biol. , 29 231
–236
(1984). Google Scholar
P. J. Caspers
,
G. W. Lucassen
, and
G. J. Puppels
,
“Combined in vivo confocal Raman spectroscopy and confocal microscopy of human skin,”
Biophys. J. , 85 572
–580
(2003). Google Scholar
M. Rajadhyaksha
,
S. Gonzalez
,
J. M. Zavislan
,
R. R. Anderson
, and
R. Webb
,
“In vivo confocal scanning laser microscopy of human skin II: Advances in instrumentation and comparison with histology,”
J. Invest. Dermatol. , 113 293
–303
(1999). Google Scholar
A. Savitzky
and
M. Golay
,
“Smoothing and differentiating of data by simplified least squares procedures,”
Anal. Chem. , 36 1627
–1639
(1964). Google Scholar
J. Steinier
,
Y. Termonia
, and
J. Deltour
,
“Comments on smoothing and differentiating of data by simplified least squares procedures,”
Anal. Chem. , 44 1906
–1909
(1972). Google Scholar
D. M. Haaland
and
E. V. Thomas
,
“Partial least-squares methods for spectral analyses. 1. Relation to other quantitative calibration methods and the extraction of qualitative information,”
Anal. Chem. , 60 1193
–1202
(1988). Google Scholar
Y. Kawamura
,
X. G. Hou
,
F. Sultana
,
H. Miura
, and
T. Ezaki
,
“Determination of 16S rRNA sequences of Streptococcus mitis and Streptococcus gordonii and phylogenetic relationships among members of the genus Streptococcus,”
Int. J. Syst. Bacteriol. , 45 406
–408
(1995). Google Scholar
Intl. J. Syst. Bacteriol. , 45
(4), 882
(1995). Google Scholar
|


