|
|
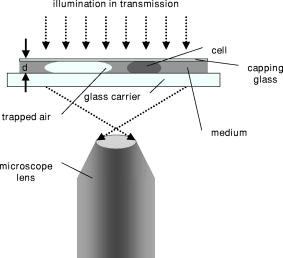
1.IntroductionHolography and speckle interferometry are well established tools for industrial nondestructive testing and quality control, which is usually performed by the detection of object displacements while applying static stress, temperature changes, or shock waves, or by vibration monitoring.1, 2, 3 Therefore, up to the present, various holography and speckle interferometry systems have been developed. Also, for biomedical applications, holographic and speckle interferometric metrology opens up new perspectives for the visualization and detection of displacements and movements. Here, for the early diagnosis of malignant tumors, it is of interest to distinguish between different tissue elasticity or to inspect cavities endoscopically.4, 5, 6 Furthermore, in the fields of life sciences and biophotonics, there are growing requirements of an optical instrumentation for timely and spatially high resolution analysis, measurement, and documentation in supra-cellular, cellular, and subcellular range. In combination with microscopy, digital holography offers new fields of application for a contactless and marker-free quantitative phase contrast imaging. 7, 8, 9, 10 Compared to other phase contrast methods,11, 12 interferometry-based techniques,13, 14, 15 and optical coherence tomography (OCT) or optical coherence microscopy (OCM), 16, 17, 18, 19 digital holographic microscopy9, 10 provides quantitative phase contrast with subsequent digital focus correction from a single recorded hologram. This feature is of particular advantage for measurements of cellular specimens with high magnification optics for the detection of fast processes as well as for long term measurements, where focus tracking is required due to mechanical instability or thermal effects. Pancreatic cancer is a devastating malignancy in western countries and the fourth most common cause of cancer-related deaths.20 One of the causes for the poor prognosis of pancreatic adenocarcinoma is its tendency to form micrometastases before clinical symptoms arise and before the tumor is detectable by diagnostic medical imaging techniques. The molecular mechanisms that determine the highly malignant growth and dissemination pattern of pancreatic cancer are poorly understood. Recent findings suggest that the cell-cell contact protein E-cadherin and the associated catenin complex play a key role in pancreatic cancer progression.21, 22 Since proteins of the cadherin/catenin complex proteins are involved in the organization of the actin cytoskeleton, which determines cell shape, it is a key challenge to obtain data related to the tumor state directly from analysis of the tumor cell morphology. In the first part of this contribution, a digital holographic microscopy method for the determination of the integral refractive index of cells in cell culture medium is presented. Thereby, the applied algorithm for digital holographic reconstruction enables the propagation of in-focus (or near the image plane) recorded holograms with constant image scale. Subsequently, in the second part of the work, the obtained information about the integral refractive index is applied to contactless and marker-free full field determination of thickness and shape of adherent pancreatic tumor cells, as well as to the quantitative analysis of dynamic drug-induced changes on single cell morphology. 2.Quantitative Digital Holographic Phase Contrast Microscopy2.1.Setup for Digital Holographic MicroscopyFigure 1 depicts the schematic setup of the applied digital holographic microscopy system. An inverse microscope arrangement, in combination with a transmitting light illumination, enables the investigation of transparent samples in a liquid-filled Petri dish, such as living cells in culture medium. The emitted light of a frequency-doubled laser ( , ) is divided into an object illumination wave and a reference wave . A condensing lens is utilized for an optimized illumination of the sample as for conventional white light illumination. The reference wave is guided directly by a beamsplitter to a charge-coupled device (CCD) sensor with IEEE1394 interface (Sony XCD-X700, , , pixel pitch ) that is applied for the digitalization of the holograms in the hologram plane HP at . Holographic off-axis geometry is realized by a slight tilt of the reference wavefront with the beamsplitter against the wavefront of the object wave. To enhance the system's lateral resolution that is restricted by the pixel pitch of the applied CCD sensor, the transmitted object wave is magnified by a microscope lens. The magnification is chosen in such a way that the smallest imaged structures, given by the restriction of the Abbe criterion, are oversampled by the image recording device (microscope lenses: Zeiss Acroplan LD , , Zeiss Acroplan LD , ). In this way, the maximum diffraction-limited resolution of the optical imaging system is not decreased by the numerical reconstruction algorithm described in Sec. 2.2. 2.2.Quantitative Holographic Phase Contrast MeasurementThe reconstruction of the digitally captured holograms is performed by the application of a nondiffractive reconstruction method (NDRM). The intensity distribution in the hologram plane HP, located at , is formed by the interference of the object wave and the reference wave : with and (* denotes the conjugate complex term). The parameter denotes the phase difference between and at . In the presence of a sample in the optical path of , the phase distribution represents the sum , where denotes the pure object wave phase, and represents the optical path length change that is effected by the sample. For areas without sample, is estimated by a mathematical model7, 9:The parameters and in Eq. 2 describe the divergence of the object wave and the properties of the applied microscopy lens. The constants and denote the linear phase difference between and due to the off-axis geometry of the experimental setup. For quantitative phase measurement from , in a first step the complex object wave in the hologram plane is determined pixel-wise by solving a set of equations that is obtained from the insertion of Eq. 2 into Eq. 1. For that purpose, neighboring intensity values within a square area of pixels around a given hologram pixel are considered by application of a spatial phase shifting algorithm (for details see Refs. 9, 23). The utilized algorithm is based on the assumption that only between the object wave and the reference wave varies rapidly spatially in the hologram plane. In addition, due to the spatial phase shifting algorithm, the object wave's intensity has to be assumed constant within an area of about pixels around a given point of interest of the hologram. For the described experiments, these requirements are fulfilled by an adequate relation between the magnification of the microscope lens and the image recording device. Therefore, the magnification of the microscope lens is chosen in such a way that the smallest imaged structures of the sample that are restricted by the resolution of the optical imaging system due to the Abbe criterion are oversampled by the CCD sensor. In this way, the lateral resolution of the reconstructed holographic phase contrast images is not decreased by the spatial phase shifting algorithm9 (see also Sec. 2.1).The parameters , and in Eq. 2 cannot be obtained directly from the geometry of the experimental setup with an adequate accuracy, and for this reason are adapted once before the measurements by an iterative fitting process in an area of the hologram without sample (for a detailed description, see Ref. 9). Digital holographic phase contrast microscopy requires, in correspondence to microscopy with white light illumination, a sharply focused image of the sample. For the case that the object is not imaged sharply in the hologram plane HP during the hologram recording process, e.g., due to mechanical instability of the experimental setup or thermal effects, in a second evaluation step a further propagation of the object wave to the image plane can be carried out for subsequent focus correction. The propagation of to the image plane that is located at in the distance to HP can be carried out by a Fresnel transformation9, 10, 23 or, as in this contribution, by a convolution algorithm24, 25: In Eq. 3, is the applied laser light wavelength, and are the coordinates in the frequency domain, and denotes a Fourier transformation. During the propagation process, the parameter is chosen in such a way that the holographic amplitude image appears sharply, in correspondence to a microscopic image under white light illumination. A further criterion for a sharp image of the sample is that diffraction effects due to the coherent illumination appear minimized in the reconstructed data. As a consequence of the applied algorithms and the parameter model for the phase difference model in Eq. 2, the resulting reconstructed holographic images do not contain the disturbing terms “twin image” and “zero order.” In addition, the method, in comparison to propagation by Fresnel transformation, as in Refs. 7, 9, 10, allows a sharply focused image of the sample in the hologram plane, which is of particular advantage for the alignment of the experimental setup. The propagation of by Eq. 3 enables in this way the evaluation of image plane holograms containing a sharply focused image of the sample, and effects no change of the image scale during subsequent refocusing. In the special case that the image of the sample is sharply focused in the hologram plane with and thus , the reconstruction process can be accelerated, because no propagation of by Eq.3 is required.From , in addition to the absolute amplitude that represents the image of the sample, the phase information of the sample is reconstructed simultaneously: After removal of the ambiguity by a phase unwrapping process,1 the data obtained by Eq. 4 can be applied for quantitative phase contrast microscopy, which is the main topic of interest in the presented communication.2.3.Refractive Index Determination and Shape Measurement of Living CellsThe reconstructed object wave phase information obtained from Eq. 4 can be applied under suitable conditions for the integral refractive index determination of semitransparent samples, such as cells in culture medium. Figure 2 shows the scheme of an experimental setup for the measurement of the refractive index of cells by digital holographic microscopy. The cells are covered with a capping glass that is pressed onto the sample in such a way that the distance to the carrier glass is nearly constant in the investigated image field. In this case, the phase change affected by a cellular sample in comparison to the culture medium with the known homogenous refractive index is: with the integral refractive index of the cell and the wavelength of the applied laser light. The distance can be obtained by the determination of the phase change , which is affected by included air near to the cellular sample with the refractive index and taking into account the refractive index of the culture medium :Insertion of Eq. 5 into Eq. 6 yields for :Consecutively, the thickness of the investigated cells can be determined by measuring the optical path length change of the cells to the surrounding medium.For fully adherently grown cells, the parameter is estimated in first order to describe the shape of single cells (see results in Sec. 3).2.4.Cell CultureThe investigated human pancreatic ductal adenocarcinoma cell lines PaTu 8988S and PaTu 8988T were obtained from the German Collection of Microorganisms and Cell Cultures (DSMZ, Braunschweig, Germany). Both cell lines were established in 1985 from a liver metastasis of a primary pancreatic adenocarcinoma from a 64-year-old woman. PaTu 8988S represents a highly differentiated carcinoma cell line, PaTu 8988T a poorly differentiated adenocarcinoma with a high metastatic potential.26 PaTu 8988T cells were retrovirally transduced with an E-cadherin expression construct containing an E-cadherin cDNA in the expression vector pLXIN (Clontech, Palo Alto, California). Cells were selected, cloned, and analyzed for E-Cadherin expression.27 The morphology of the cell lines was examined by scanning electron microscopy (SEM). Pancreas tumor cell lines were cultured in Dulbecco Modified Eagle Medium (DMEM) supplemented with 5% fetal calf serum (FCS), 5% horse serum, and 2-mM L-glutamine at 5% . For the digital holographic investigations, the cells were trypsinized, seeded subconfluent on glass slides or tissue culture plates, cultured for , and analyzed at room temperature and normal atmosphere. For the dynamic measurements, cells were incubated with of the cell permeable actin cytoskeleton disrupting toxin Latrunculin B (Calbiochem, San Diego, California).28 3.Results3.1.Refractive Index Determination of PaTu 8988 CellsIn a first experimental step, the refractive index of the three pancreas tumor cell lines is determined. Therefore, adherently grown cells (PaTu 8988S, PaTu 8988T, and PaTu 8988T pLXIN E-Cadherin) on a glass carrier are covered with a capping glass as described in Sec. 2.3. Afterward, holographic phase contrast images are obtained from the samples by application of the experimental setups depicted in Figs. 1 and 2. Figure 3 shows an exemplary result of an investigated PaTu 8988T cell for refractive index determination that also illustrates the evaluation process of the measurement data. Figure 3a depicts the region of interest from a captured digital hologram of the PaTu 8988T cell that is located near enough to included locked air. Figure 3b shows the reconstructed holographic amplitude image, while Fig. 3c presents the corresponding wrapped quantitative phase contrast image of the PaTu 8988T cell modulo . For imaging, both amplitude and phase are transformed to 256 gray levels. Figure 3d shows the plot of an unwrapped cross section through the phase distribution along the dashed white line in Fig. 3c. As a result, and are determined. With the refractive index of the culture medium (obtained by an Abbe refractometer), ,29 and , by application of Eqs. 6, 7 a distance between the capping and the carrier glass of and is obtained. Figure 4 shows in comparison the wrapped quantitative phase contrast image modulo of the three different cell types in 256 gray-level representation [Fig. 4a PaTu 8988S, Fig. 4b PaTu 8988T, and Fig. 4c PaTu 8988T pLXIN E-Cadherin). For noise suppression, the averaged phase data obtained in the white marked areas are inserted into Eq. 6 to calculate the refractive index values. Table 1 shows the results for obtained from the investigation of 12 single cells (four of each cell type), as shown in Fig. 4. Within the error obtained from the standard deviation, no difference between the values for of the three cell types is detected. For this reason, the further data evaluation in Sec. 3.2 is carried out for all pancreas tumor cells by applying the average value obtained from all measured refractive index values. Fig. 3Refractive index determination of living pancreas cells by digital holographic microscopy: (a) digitally captured hologram of a PaTu 8988T cell; (b) holographic amplitude image reconstructed from (a); (c) wrapped phase contrast image modulo reconstructed from (a); (d) cross section through the unwrapped phase contrast image along the dashed white line in (c).  Fig. 4Refractive index determination of pancreas tumor cells: (a) unwrapped phase contrast image of PaTu 8988S cells (256 gray-level representation); (b) unwrapped phase contrast image of PaTu 8988T cells; and (c) unwrapped phase contrast image of PaTu 8988T pLXIN E-Cadherin cells. White marked areas are the phase data evaluated for the refractive index determination (A is air, C is cell, and M is the culture medium).  Table 1Integral refractive index for PaTu 8988T, PaTu 8988T pLXIN E-Cadherin, and PaTu 8988S determined by digital holographic phase contrast microscopy.
3.2.Shape Measurement of Living PaTu 8988T CellsIn the next experimental step, the information about the integral refractive index data obtained from Table 1 is applied to determine the thickness of adherently grown living PaTu 8988T cells in a Petri dish with cell culture medium. For the experiments, holograms of adherent PaTu 8988T cells and PaTu 8988T pLXIN E-Cadherin cells are captured in the transmitting light arrangement (see Fig. 1). From the determined phase data that represent the optical path length change affected by the samples, the thickness of the cells is obtained by application of Eq. 8 and the average refractive index data from Table 1. Figure 5 depicts results obtained on a PaTu 8988T cell. Figures 5a and 5b show the reconstructed holographic amplitude image and the quantitative phase contrast image modulo in gray-level representation. Figure 5c depicts the unwrapped phase data with included gray-level legend for the phase and the corresponding calculated cell thickness. Figure 5d shows a rendered pseudo 3-D representation of the cell thickness in correspondence to the lateral cell size in comparison to a SEM image of a PaTu 8988T cell [Fig. 5e]. The SEM electron micrographs were taken by a LEO 1530 VP (LEO Electron Microscopy Group Ltd., Cambridge, United Kingdom) in high vacuum mode . During all measurements, the acceleration voltage was and an Everhart Thornley secondary electron detector was used. To prevent artefacts caused by charging of the samples, their surfaces were coated with a thin metal layer followed by a carbon layer. Figure 6 represents the results obtained for two PaTu 8988T pLXIN E-Cadherin cells. For each cell type, the obtained data for the cell thickness were found in good agreement with the appearance of the SEM images. In Fig. 7 , the phase values as well as the cell thickness are plotted for both cell lines corresponding to the cross sections marked by white lines in Figs. 5c and 6c. The different cell types can be differentiated by the phase difference as well as by the calculated thickness. For the PaTu 8988T cell, a maximum thickness of , and for PaTu 8988T pLXIN E-Cadherin , is obtained. The maximum error for and was estimated by taking into account the spatial phase noise of the phase distributions that was determined to an average value of in the area of the sample. In comparison, for areas without cells, the phase noise is determined to . Assuming that the investigated cells were grown fully adherently on the carrier glass and taking into account the appearance of the pancreas cells in the SEM images, the results for the cell thickness in Fig. 7 represent in good estimation the shape of the cells. Fig. 5Thickness determination of living PaTu 8988T cells by digital holographic microscopy: (a) reconstructed holographic amplitude image; (b) corresponding quantitative phase contrast image modulo ; (c) unwrapped quantitative phase contrast image (for the plot of the cross section along the white line, see Fig. 7); (d) rendered pseudo 3-D plot of the cell thickness obtained from (c); and (e) SEM image of a PaTu 8988T cell.  Fig. 6Thickness determination of living PaTu 8988T pLXIN E-Cadherin pancreas cells by digital holographic microscopy: (a) reconstructed holographic amplitude image of two PaTu 8988T cells; (b) corresponding quantitative phase contrast image modulo ; (c) unwrapped quantitative phase contrast image (for the plot of the cross section along the white dashed lines, see Fig. 7); (d) rendered pseudo 3-D plot of the cell thickness obtained from (c); and (e) SEM image of a PaTu 8988T pLXIN E-Cadherin cell.  3.3.Dynamic Measurements on a Living Human Pancreas Carcinoma Cell (PaTu 8988S)In a further experimental step, the digital holographic microscopy setup is applied for the detection of dynamic morphological changes of living cells in cell culture medium. Therefore, a hologram series of a single PaTu 8988S cell with a time delay between two recordings of is captured. At the beginning of the experiment at , the marine cell toxin Latrunculin B was added to a final concentration of to the cell culture medium to destruct the actin filaments of the cell's cytoskeleton. Figure 8 shows the rendered pseudo 3-D plot of the cell thickness calculated from the phase distribution at by taking into account the average refractive index from Table 1 [Fig. 8a] in comparison with a corresponding SEM image of a PaTu 8988S cell [Fig. 8b], which shows a similar appearance. The upper row of Fig. 9 represents the wrapped phase distribution modulo after [Fig. 8a], [Fig. 8b], [Fig. 8c], and [Fig. 8d]. With increasing time after the addition of Latrunculin B, the phase distributions indicate the cell collapse affected by the destruction of the cytoskeleton. In the lower row of Fig. 9, the corresponding unwrapped phase data along the marked horizontal cross sections of the distribution (see white arrows in the upper row of Fig. 9) is plotted as well as the cell thickness that is calculated for the assumption of negligible refractive index changes of the cell. During the collapse, as well as the cell thickness are locally decreased up to about 50%. Furthermore, the crinkle structure of the shrunken cell is clearly visualized in the phase contrast images as well as in the plotted cross sections. Fig. 8Dynamic analysis of human pancreatic carcinoma cells: (a) rendered pseudo 3-D plot of the cell thickness obtained from the holographic phase contrast image of a PaTu 8988S cell at ; and (b) SEM image of a PaTu 8988S cell. 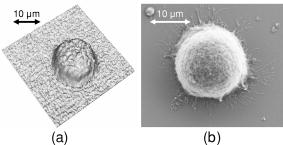 Fig. 9Analysis of a living PaTu 8988S cell after addition of a marine toxin (Latrunculin B) to the cell culture medium. Unwrapped phase values and cell thickness along the cross sections (lower row) through the reconstructed quantitative phase contrast images modulo (upper row) after (a) , (b) , (c) , and (d) after the addition of Latrunculin B.  4.Discussion and ConclusionsThe results obtained from the refractive index measurements in Sec. 3.1 show good correspondence with the results of previously published values for the refractive index of cells. 15, 30, 31, 32 In this way, the presented digital holographic microscopy method represents a facility for the determination of the integral refractive index of single cells in culture medium under conventional environmental conditions. The resolution for the determination of refractive index variations is determined to . This value for is typical for the described measurement setup, and takes into account the noise effected by the image recording device (8 bit dynamics, electronic noise, and fixed pattern noise, e.g., due to reflections of the capping glass and the CCD sensor window), the spatial variation of the refractive index of the cells, the wavelength of the applied laser light, internal reflections caused by optical elements, and photon noise. The results from the thickness measurements of PaTu 8988T cells and PaTu 8988T pLXIN E-Cadherin cells described in Sec. 3.2 are in correspondence with the appearance of the SEM images. Thus, the pseudo 3-D plots in Figs. 5d and 6d of the cell thickness represent an acceptable estimation of the shape of the investigated cells. Furthermore, the different cell types are differentiated by their thickness. Phase noise for the detection of optical path length changes in areas without samples is found in the same range as the values in Ref. 10. The comparison of the obtained values for the phase distribution noise in the areas with and without sample shows that under the estimation of a homogeneous distribution of the refractive index, as in Ref. 10 the main error sources for the determination of the cell thickness are sample-induced specific scattering effects and refractive index variations inside the cellular sample. This generates, in comparison to Ref. 10, an increased error of . Taking into account the error for the refractive index determination, the nonlinear dependence between the cell thickness and in Eq. 8 leads calculatively to an overestimation of the cell thickness up a factor of for refractive index values that are smaller than the obtained average refractive index, and to a minimum factor of (underestimation) for refractive index values higher than the estimated average value for . On the other hand, it has to be considered that the error represents the statistical error for the determination of the refractive index, including noise caused by the whole experiment setup (see the first paragraph of this section). Furthermore, the comparison of the measured cell thickness for the two Patu8988T pLXIN E-Cadherin cells in Fig. 7, as well as the correspondence to the SEM images, indicate that in practice a lower variation of the refractive index of the cells can be assumed. Nevertheless, the measurement accuracy for the detection of optical path length changes and the determination of is expected to be increased by suppression of fixed pattern noise in the experimental setup and faster hologram acquisition, e.g., by a high speed camera in combination with temporal averaging up to values as reported.14 The results from the dynamic experiments with Latrunculin B in reference to Sec. 3.3 show that the presented digital holographic microscopy arrangement can be utilized for investigations of dynamic cellular processes and for the quantitative analysis of cell reactions on drug treatment. The quantitative values for the cell thickness calculated from these phase measurements have to be handled with care due to the unavailable information about refractive index changes of the cells during the experiment. However, the obtained information opens up new ways for marker-free dynamic monitoring of cell thickness changes that may access new parameters, e.g., for early apoptosis recognition of adherently grown cells or for cell swelling control in microinjection. Furthermore, the average cell thickness might be an appropriate parameter for automated cell differentiation or cell sorting. Although the presented method does not achieve the resolution of atomic force microscopy (AFM), scanning optical near-field microscopy (SNOM), or SEM, it overcomes some particular limitations of these techniques, e.g., the scanning process or the requirement of fixed cells in a vacuum, and enables a vibration insensitive (hologram capture time in submillisecond range, hologram acquisition rate mainly limited by the digital recording device) and contactless full field measurement of living cells. In this way, the described digital holographic microscopy method is an imaging technology for rapid analysis of dynamic changes in the morphology of living cells. In conclusion, the obtained results show that digital holographic microscopy can be applied to thickness measurements of living cells in culture medium. Furthermore, the proposed method allows a shape measurement of living adherently growing cells under conventional laboratory conditions. Thus, digital holographic microscopy represents a contactless, minimally invasive, and marker-free full field technique for investigations of dynamic processes like cell migration or effects of drug effectiveness and drug delivery on living cellular systems. In combination with other established high resolution techniques like fluorescence microscopy, new possibilities for functional imaging and the structural analysis of living cells are opened up. In this way, the proposed methods represent a promising versatile instrumentation for microscopy applications in life sciences research and biophotonics. AcknowledgmentThis work was supported by grants of the German Federal Ministry of Education and Research (BMBF) to the Laboratory of Biophysics, University of Muenster, Germany, and by the Deutsche Forschungsgemeinschaft (DFG) SFB 293 to the Department of Medicine B, University of Muenster, Germany. ReferencesT. Kreis,
(1996) Google Scholar
V. P. Shchepinov and
V. S. Pisarev,
(1996) Google Scholar
M. A. Beek and
W. Hentschel,
“Laser metrology—a diagnostic tool in automotive industry,”
Opt. Lasers Eng., 34 101
–120
(2000). https://doi.org/10.1016/S0143-8166(00)00077-4 0143-8166 Google Scholar
B. Kemper,
W. Avenhaus,
D. Dirksen,
A. Merker, and
G. von Bally,
“Endoscopic double-pulse electronic speckle pattern interferometer for technical and medical intra-cavity inspection,”
Appl. Opt., 39 3899
–3905
(2000). 0003-6935 Google Scholar
S. Schedin,
G. Pedrini, and
H. J. Tiziani,
“Pulsed digital holography for deformation measurements on biological tissues,”
Appl. Opt., 39 2853
–2857
(2000). 0003-6935 Google Scholar
W. Avenhaus,
B. Kemper,
G. von Bally, and
W. Domschke,
“Gastric wall elasticity assessed by dynamic holographic endoscopy: ex vivo investigations on the porcine stomach,”
Gastrointest Endosc, 54 496
–500
(2001). 0016-5107 Google Scholar
E. Cuche,
P. Marquet, and
C. Depeursinge,
“Simultaneous amplitude-contrast and quantitative phase-contrast microscopy by numerical reconstruction of Fresnel off-axis holograms,”
Appl. Opt., 38 6694
–7001
(1999). 0003-6935 Google Scholar
G. Pedrini,
S. Schedin, and
H. J. Tiziani,
“Spatial filtering in digital holographic microscopy,”
J. Mod. Opt., 47 1447
–1454
(2000). 0950-0340 Google Scholar
D. Carl,
B. Kemper,
G. Wernicke, and
G. V. Bally,
“Parameter optimized digital holographic microscope for high resolution living cell analysis,”
Appl. Opt., 43 6536
–6544
(2004). https://doi.org/10.1364/AO.43.006536 0003-6935 Google Scholar
P. Marquet,
B. Rappaz,
P. J. Magistretti,
E. Cuche,
Y. Emery,
T. Colomb, and
C. Depeursinge,
“Digital holographic microscopy: a noninvasive contrast imaging technique allowing quantitative visualization of living cells with sub wavelength accuracy,”
Opt. Lett., 30 468
–470
(2005). https://doi.org/10.1364/OL.30.000468 0146-9592 Google Scholar
L. G. Alexopoulos,
G. R. Erickson, and
F. Guilak,
“A method for quantifying cell size from differential interference contrast images: validation and application to osmotically stressed chondrocytes,”
J. Microsc., 205 125
–135
(2001). 0022-2720 Google Scholar
A. Barty,
K. A. Nugent,
D. Paganin, and
A. Roberts,
“Quantitative optical phase microscopy,”
Opt. Lett., 23 817
–819
(1998). 0146-9592 Google Scholar
G. Popescu,
L. Deflores,
J. C. Vaughan,
K. Badizadegan,
H. Iwai,
R. R. Dasari, and
M. S. Feld,
“Fourier phase microscopy for investigations of biological structures and dynamics,”
Opt. Lett., 29 2503
–2505
(2004). https://doi.org/10.1364/OL.29.002503 0146-9592 Google Scholar
T. Ikeda,
P. Poqesqu,
P. Dasari, and
M. S. Feld,
“Hilbert phase microscopy for investigating fast dynamics in transparent systems,”
Opt. Lett., 30 1165
–1167
(2005). https://doi.org/10.1364/OL.30.001165 0146-9592 Google Scholar
J. Farinas and
A. S. Verkman,
“Cell volume and plasma membrane osmotic permeability in epiphelial cell layers measured by interferometry,”
Biophys. J., 71 3511
–3522
(1996). 0006-3495 Google Scholar
A. Aguirre,
P. Hsiung,
T. Ko,
I. Hartl, and
J. Fujimoto,
“High-resolution optical coherence microscopy for high-speed, in vivo cellular imaging,”
Opt. Lett., 28 2064
–2066
(2003). 0146-9592 Google Scholar
E. Swanson,
J. Izatt,
M. Hee,
D. Huang,
C. Lin,
J. Schuman,
C. Puliafito, and
J. Fujimoto,
“In-vivo retinal imaging by optical coherence tomography,”
Opt. Lett., 18 1864
–1866
(1993). 0146-9592 Google Scholar
Y. Zhao,
Z. Chen,
Z. Ding,
H. Ren, and
J. Nelson,
“Real-time phase-resolved functional optical coherence tomography by use of optical Hilbert transformation,”
Opt. Lett., 27 98
–100
(2002). 0146-9592 Google Scholar
C. G. Rylander,
D. P. Davé,
T. Akkin,
T. E. Milner,
K. R. Diller, and
A. J. Welch,
“Quantitative phase-contrast imaging of cells with phase-sensitive optical coherence microscopy,”
Opt. Lett., 29 1509
–1511
(2004). https://doi.org/10.1364/OL.29.001509 0146-9592 Google Scholar
A. Jemal,
R. C. Tiwari,
T. Murray,
A. Ghafoor,
A. Samuels,
E. Ward,
E. J. Feuer, and
M. J. Thun,
“Cancer statistics, 2004,”
Ca-Cancer J. Clin., 54 8
–29
(2004). 0007-9235 Google Scholar
J. Mayerle,
H. Friess,
M. W. Büchler,
J. Schnekenburger,
F. U. Weiss,
K. P. Zimmer,
W. Domschke, and
M. M. Lerch,
“Upregulation, nuclear import and tumor growth stimulation of the adhesion protein p120ctn in pancreatic cancer,”
Gastroenterology, 60 949
(2003). 0016-5085 Google Scholar
J. Behrens,
“Cadherins and catenins: role in signal transduction and tumor progression,”
Cancer Metastasis Rev., 18 15
–23
(1999). 0891-9992 Google Scholar
M. Liebling,
T. Blu, and
M. Unser,
“Complex-wave retrieval from a single off-axis hologram,”
J. Opt. Soc. Am. A, 21 367
–377
(2004). https://doi.org/10.1364/JOSAA.21.000367 0740-3232 Google Scholar
T. Demotrakooulos and
R. Mittra,
“Digital and optical reconstruction of images from suboptical diffraction patterns,”
Appl. Opt., 13 665
–670
(1974). 0003-6935 Google Scholar
T. M. Kreis,
M. Adams, and
W. P. O. Jüptner,
“Methods of digital holography: A comparison,”
Proc. SPIE, 3098 224
–233
(1997). 0277-786X Google Scholar
H. P. Elsässer,
U. Lehr,
B. Agricola, and
H. F. Kern,
“Establishment and characterization of two cell lines with different grade of differentiation derived from one primary human pancreatic adenocarcinoma,”
Virchows Arch. B, 61 295
–306
(1992). 0340-6075 Google Scholar
J. Schnekenburger,
I. Bredebusch,
M. M. Lerch, and
W. Domschke,
“Different functions of E-Cadherin in the metastasis of pancreas tumour cells,”
Pancreatol., 3 435
(2003) Google Scholar
I. Spector,
N. R. Shochet,
Y. Kashman, and
A. Groweiss,
“Latrunculins: Novel marine toxin that disrupt microfilament organization in cultured cells,”
Science, 219 493
–495
(1983). 0036-8075 Google Scholar
L. Börnstein,
(1990) Google Scholar
V. Tsenova and
E. Stoykova,
“Refractive index measurement in human tissue samples,”
Proc. SPIE, 5226 413
–417
(2003). 0277-786X Google Scholar
J. A. Steyer and
W. Almers,
“A real-time view of life within of the plasma membrane,”
Nature (London), 2 268
–276
(2001). 0028-0836 Google Scholar
J. Beuthan,
O. Minet,
J. Helfmann,
M. Herrig, and
G. Müller,
“The spatial variation of the refractive index in biological cells,”
Phys. Med. Biol., 41 369
–382
(1996). https://doi.org/10.1088/0031-9155/41/3/002 0031-9155 Google Scholar
|
||||||||||||||||||||||||||||