
|
|
|
In oncology, combating the dispersal of tumor cells constitutes a clinical need that currently remains unsatisfied. Novel types of compounds with antimigratory actions are thus necessary, and their identification requires efficient in vitro tests.1 Many developments in the fields of videomicroscopy and image analysis have enabled considerable advances in cell tracking in the 2-D environments in which living cells can be easily observed.1 Unfortunately, the biological characteristics of cells migrating in a 2-D environment do not fit in with those of cells migrating in a 3-D environment, 2, 3, 4, 5, 6 which corresponds to reality in the case of cancer patients. The quantitative analyses of cell locomotion in a 3-D environment can be carried out by means of wide-field (standard) fluorescence, with the subsequent deconvolution of the data series,7 or phase-contrast microscopy.8, 9 Techniques for sample analysis in three dimensions also include confocal microscopy and the related two-photon and multiphoton techniques,10 optical projection tomography,11 and selective plane illumination microscopy12 (SPIM). Techniques also exist that make use of inteferometry, such as optical coherence tomography13 and time-domain digital holography in reflection.14, 15 The principle consists of using an optical source with a low temporal coherence effect to record the interferometric information between the beam reflected by the sample slice under investigation and the reference. Due to the reduced temporal coherence effect, the interference occurs when there is an accurate equalization between the object and the reference beams. The postprocessing consists of keeping the interfering slice contribution while eliminating the noninterfering background. As those systems work in a reflection mode, the sectioning effect is high and reduces the temporal coherence. The interference capability makes imaging through turbid media that has been also investigated with a multiple-quantum-well photorefractive holographic camera possible.16 These previously cited techniques use optical sectioning to eliminate out-of-focus disturbances. However, to monitor 3-D dynamic cell processes, optical sectioning requires the storage of a large number of microscope images acquired over time with accurate position changes along the optical axis. By overcoming these limitations, transmission digital holography microscopy (TDHM) is able to record the full 3-D sample information without scanning, thanks to a computer based in depth refocusing ability.17 A sample hologram recorded with a CCD camera is numerically reconstructed to provide a stack of slice images refocused at incremental depths. The main advantages are a reduction in the amount of data to be stored and the time required to record the full 3-D information. With the phase-stepping technique, a small number (typically four) of successive video frames must be recorded.17 Since holographic recording requires optical coherence between the beams, the usual approach involves the use of highly coherent laser sources. 17, 18, 19, 20, 21 However, this type of illumination suffers from an important noise artifact that significantly restricts the TDHM performances. This complicates the analysis of the actual 3-D samples, which consist of multiple objects embedded in scattering media, such as living cells in a 3-D matrix gel. To the best of our knowledge, the use of digital holography for the analysis of living cells is limited to low cell density, cells cultured on planar and solid substrates, or possibly, in very thin layers of gel.19, 20, 21 In a transmission mode one way to reduce the coherent noise consists of using a partial spatial coherent source that must be distinguished from the partial temporal coherence that is useful in reflection.22 Only a few implementations of partially spatial coherent sources in transmission digital holographic microscopes were reported. Based on a work by Leith, 23 and Indebetouw and Klysubun report that the spatiotemporal digital holography approach benefits from the partial spatial coherent source for imaging through a turbid media.24 Although the transmission microscope mode is mentioned, the experimental demonstration is shown in a reflection case. The same authors implemented a transmission-type system where the beam is split after the sample and the reference beam filtered by a pinhole.25 However, the recording of the hologram requires that the sample be defocused to match the partial spatial coherence function on the detector. The microscope used for this work benefits from a partially spatial coherent illumination and is originated from a previous implementation.26 The sample is placed inside a MachZehnder interferometer (Fig. 1 ) to remove the constraints on the sample location and to maximize the contrast ratio of the interferometric patterns. With respect to our previous configuration,26 optical condensers are placed inside the interferometer to provide more flexibility in adjusting the object and the reference beams. The image degradation caused by the noise of the coherent laser source is eliminated (Figs. 2 and 3 ), and the quality of the image is much improved.27 A partial spatial coherent illumination also provides a low temporal coherence-like effect.27 In scattering media such as collagenous gels [Fig. 1d], this approach further reduces the noisy coherent contribution by selecting the ballistic photons for the interferometric information. Moreover, as the optical source is an LED of low temporal coherence,16, 26 the selection of the ballistic photons is further improved. The system provides the optical phase and the intensity images on one plane of a sample, with a typical acquisition time of [Figs. 2a and 2b]. The resulting complex optical field is used to refocus the optical intensity and phase fields on parallel planes without any mechanical scanning or loss of time [Figs. 2a, 2c, 3]. As the information needed to perform the refocusing is recorded on the single imaged plane by the CCD, the point spread function of the optical system is constant over the experimental volume, so that the digital holographic refocusing does not introduce a loss of information.26 The magnification corresponding to that of a standard optical microscope is about , the lateral resolution computed according to the Rayleigh criteria is , and the resolution is computed with the standard formula is , where is the average wavelength of , and NA is the numerical aperture of 0.30. The depth of refocusing is extended by a factor about 100 by means of digital holographic reconstruction.26 Fig. 1Description of the device: (A): Light-emitting diode (LED), optical fiber (OF), lenses (L1 through L6), beamsplitters (BS1 and BS2), mirrors (M1 through M5), microscope lenses (ML1 and ML2), optical flat (Sr), culture dish (So), and Hamamatsu Orca camera (CCD). The relative orientation of the two subsystem assemblies (SE1) and (SE2) (each holds a beamsplitter and a mirror) enable the optical paths in the two arms of the interferometer to be accurately equalized. M4 is mounted on a piezoelectric transducer to implement the four-frame phase-stepping technique. (B) A computer drives all the microscope functionalities. (C) The culture dish is placed in the thermoregulated chamber on the microscope focusing stage. The microscope is inverted and the specimen is observed through the bottom of the culture dish. (D) The scattering features of a collagen gel (shown with contrast-phase microscopy).  Fig. 2Information provided by the digital holography microscopy (DHM) system. Images ( , corresponding to 1/4 of the complete microscope field actually observed) obtained by means of our digital holographic microscope that show unstained HT-1080 fibrosarcoma cells cultured in a 3-D collagen gel. The image shown in (A) is refocused over a distance of by means of digital holography reconstruction to achieve the focused cell image shown in (C). (B) The optical phase map corresponding to (A) and (D) the differential interference contract (DIC) mode emulation obtained from the holographic data corresponding to (C).  Fig. 3Refocusing ability of the DHM system. Examples of refocusing by the 4-D interactive software interface using the mouse wheel are shown in holograms ( to ) and ( to ) .  The resolution of the optical thickness computed on the phase map is about . This value is established by assessing the noise that occurs on the phase maps. As the full information on the optical field transmitted by the sample is recorded, it is possible to emulate standard optical microscopy modes, such as the DIC [see Fig. 2d]. This latter mode is successfully implemented thanks to the low noise level and is particularly useful in the observation of living cells by providing the scientists with a common tool of visualization. To test our systems and to illustrate their performances (see Figs. 2 to 4 ) we carried out experiments with unstained HT-1080 fibrosarcoma cell suspensions added to a solution of collagen type 1 and a cell culture medium supplemented with fetal calf serum (10%). The cell-collagen mixture was transferred to a glass dish (Anadis Instruments, Malden, The Netherlands) [cf. Fig. 1c], onto which a very fine coat of cell-free collagen had previously been applied. After collagen polymerization, the cells were embedded in a 3-D collagen gel approximately thick. The dish, which was provided with a two-neck cover (Fig. 1c), was then filled with culture medium. After having closed the cover, we added culture medium via the cover outlets to prevent the propagation of any free-surface vibration, which could disturb the accuracy of the interferometric measurements. The culture dish was then maintained at in a thermoregulated chamber placed on the microscope stage. The software driving the DHM has a time-lapse capability and recorded the holographic images every for . A semiautomated software package enables an operator to perform a 4-D analysis of the cancer cell dynamics on the time-lapse images on the basis of three visualization modes, i.e., the bright field, the phase image, and the DIC modes. This custom software enables us to determine a region of interest (ROI) and to displace it in the hologram. Inside this ROI, the operator can refocus, with the mouse wheel, the different cells embedded in the gel (Fig. 3), and the recording of the locations is carried out with a mouse click on a central point inside the cell body, a usual way to record cell locations in computer-assisted cell tracking experiments.1 Stacks of 4-D images allow for the observation of the cell displacement during the experiment. Fig. 4Three-dimensional trajectories of living cells. (A) The trajectories covered by 22 HT-1080 fibrosarcoma cells embedded in a 3-D collagen gel. The vertical axis is the digital holographic reconstruction distance. The black and colored points represent the initial and the final cell positions respectively. Each trajectory was established by means of the interactive 4-D analysis software package from the sequential positions of a cell measured every over a period of . This computer-assisted tracking was principally carried out on the bright field images with a possible resort to phase information in case of cell crossing. (B) The distribution of the average cell speeds (black bars, right axis) and the greatest linear distances (hatched bars, left axis) between the initial position of each cell and its farthest point reached in its trajectory. These two features were computed on the 22 cell trajectories shown in (A), and their values were ranked according to the linear distances. The corresponding ranks were used to similarly number the trajectories in (A) and (B). 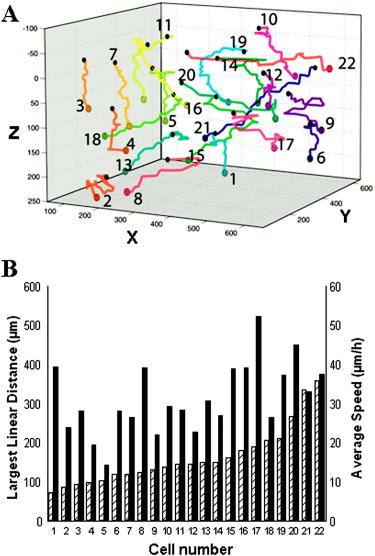 Figure 4a illustrates 22 different cell trajectories established by this method over a period of . Figure 4b illustrates the quantitative characterization of these trajectories by means of two features. The first is the individual cell average speed (i.e., the total length of the trajectory divided by the period of observation), and the second is the largest linear distance covered by each cell from its initial location (at time=0) to the farthest position reached by the cell in its trajectory.28 In contrast to the cell speed, this latter feature is able to distinguish between cell trajectories consisting of many small movements (around the original cell location) and those presenting a few large displacements. This latter feature was previously demonstrated as a particularly robust measurement of cell displacements28 and was used to rank the different trajectories analyzed, as illustrated in Fig. 4b. The 22 trajectories illustrated in Fig. 4a are thus numbered according to their rank reported in Fig. 4b. The largest covered distances observed in this set range from 73 to and the cell speeds range from 14 to . A relatively small level of positive correlation was observed between these two features (Spearman , ), meaning that the speedy cells have a slight tendency to cover larger distances than the slow ones. These data illustrate the level of heterogeneity encountered in the migratory behavior of an a priori homogeneous cell population in a 3-D matrix gel, which, in fact, mixes migrating and less migrating cells, in terms of speeds as well as covered distances. In conclusion, efficient noninvasive methods are necessary to validly analyze cancer cell migration in a 3-D environment and the possible changes due to drug action. For this purpose, the TDHM system that we developed records, without any significant time distortion or loss of information, the 3-D structure of a sample that is a posteriori analyzed with appropriate software. The partially spatial coherent nature of the optical source provides high quality images, even in the case of light-scattering samples (e.g., cell cultures in thick gels). Accurate, local optical thickness measurements and standard phase-contrast imaging modes are available. TDHM is of particular use in studying marker-free living biological (transparent) specimens. Consequently this approach does not require the insertion of fluorescent probes into cells, which sensitize them to photodamage and thus facilitates the long-term time-lapse imaging of living cells. Because of these advantages, DHM makes possible large-scale cell culture analyses in 3-D gels in the experimental conditions commonly encountered in cell biology laboratories. Since the magnification can be modified by using different microscope lenses, detailed cell morphology and its dynamical changes can also be monitored. AcknowledgmentsThis research is supported by the Walloon Region’s Research Program “Recherche d’initiative” under MICADO (“Mesure et Identification par Corrélation d’Objet”) contract (No. 001/4512). ReferencesC. Decaestecker,
O. Debeir,
P. Van Ham, and
R. Kiss,
“Can anti-migratory drugs be screened in vitro? a review of 2D and 3D assays for the quantitative analysis of cell migration,”
Med. Res. Rev., 0198-6325 Google Scholar
P. Friedl and
K. Wolf,
“Tumour-cell invasion and migration: diversity and escape mechanisms,”
Nat. Rev. Cancer, 3 362
–374
(2003). 1474-175X Google Scholar
E. Cukierman,
R. Pankov,
D. R. Stevens, and
K. M. Yamada,
“Taking cell-matrix adhesions to the third dimension,”
Science, 294 1708
–1712
(2001). https://doi.org/10.1126/science.1064829 0036-8075 Google Scholar
F. Sabeh,
I. Ota,
K. Holmbeck,
H. Birkedal-Hansen,
P. Soloway,
M. Balbin,
C. Lopez-Otin,
S. Shapiro,
M. Inada,
S. Krane,
E. Allen,
D. Chung, and
S. J. Weiss,
“Tumor cell traffic through the extracellular matrix is controlled by the membrane-anchored collagenase MT1-MMP,”
J. Cell Biol., 167 769
–781
(2004). 0021-9525 Google Scholar
K. Camphausen,
B. Purow,
M. Sproull,
T. Scott,
T. Ozawa,
D. F. Deen, and
P. J. Tofilon,
“Influence of in vivo growth on human glioma cell line gene expression: convergent profiles under orthotopic conditions,”
Proc. Natl. Acad. Sci. U.S.A., 102 8287
–8292
(2005). 0027-8424 Google Scholar
K. A. Beningo,
M. Dembo, and
Y. L. Wang,
“Responses of fibroblasts to anchorage of dorsal extracellular matrix receptors,”
Proc. Natl. Acad. Sci. U.S.A., 101 18024
–18029
(2004). 0027-8424 Google Scholar
D. J. Stephens and
V. J. Allan,
“Light microscopy techniques for live cell imaging,”
Science, 300 82
–86
(2003). https://doi.org/10.1126/science.1082160 0036-8075 Google Scholar
D. R. Soll,
“Computer-assisted three-dimensional reconstruction and motion analysis of living, crawling cells,”
Comput. Med. Imaging Graph., 23 3
–14
(1999). 0895-6111 Google Scholar
Z. N. Demou and
L. V. McIntire,
“Fully automated three-dimensional tracking of cancer cells in collagen gels: determination of motility phenotypes at the cellular level,”
Cancer Res., 62 5301
–5307
(2002). 0008-5472 Google Scholar
W. Denk,
J. H. Strickler, and
W. W. Webb,
“Two-photon laser scanning fluorescence microscopy,”
Science, 248 73
–76
(1990). 0036-8075 Google Scholar
J. Sharpe,
U. Ahlgren,
P. Perry,
B. Hill,
A. Ross,
J. Hecksher-Sorensen,
R. Baldock, and
D. Davidson,
“Optical projection tomography as a tool for 3D microscopy and gene expression studies,”
Science, 296 541
–545
(2002). https://doi.org/10.1126/science.1068206 0036-8075 Google Scholar
J. Huisken,
J. Swoger,
F. Del Bene,
J. Wittbrodt, and
E. H. Stelzer,
“Optical sectioning deep inside live embryos by selective plane illumination microscopy,”
Science, 305 1007
–1009
(2004). https://doi.org/10.1126/science.1100035 0036-8075 Google Scholar
D. Huang,
E. A. Swanson,
C. P. Lin,
J. S. Schuman,
W. G. Stinson,
W. Chang,
M. R. Hee,
T. Flotte,
K. Gregory,
C. A. Puliafito, and
J. G. Fujimoto,
“Optical coherence tomography,”
Science, 254 1178
–1181
(1991). 0036-8075 Google Scholar
P. Massatsch,
F. Charrière,
E. Cuche,
P. Marquet, and
C. Depeursinge,
“Time-Domain optical coherence tomography with digital holographic microscopy,”
Appl. Opt., 44 1806
–1812
(2005). https://doi.org/10.1364/AO.44.001806 0003-6935 Google Scholar
S. Tamano,
Y. Hayasaki, and
N. Nishida,
“Phase-shifting digital holography with a low-coherence light source for reconstruction of a digital relief object hidden behind a light scattering medium,”
Appl. Opt., 45 953
–959
(2006). https://doi.org/10.1364/AO.45.000953 0003-6935 Google Scholar
M. Tziraki,
R. Jones,
P. M. W. French,
M. R. Melloch, and
D. D. Nolte,
“Photorefractive holography for imaging through turbid media using low coherence light,”
Appl. Phys. B, 70 151
–154
(2000). https://doi.org/10.1007/s003400050023 0946-2171 Google Scholar
T. Zhang and
I. Yamaguchi,
“Three-dimensional microscopy with phase-shifting digital holography,”
Opt. Lett., 23 1221
–1223
(1998). 0146-9592 Google Scholar
W. Xu,
M. H. Jericho,
H. J. Kreuzer, and
I. A. Meinertzhagen,
“Tracking particles in four dimensions with in-line holographic microscopy,”
Opt. Lett., 28 164
–166
(2003). https://doi.org/10.1038/nature01433 0146-9592 Google Scholar
W. Xu,
M. H. Jericho,
I. A. Meinertzhagen, and
H. J. Kreuzer,
“Digital in-line holography for biological applications,”
Proc. Natl. Acad. Sci. U.S.A., 98 11301
–11305
(2001). https://doi.org/10.1073/pnas.191361398 0027-8424 Google Scholar
D. Carl,
B. Kemper,
G. Wernicke, and
G. von Bally,
“Parameter-optimized digital holographic microscope for high-resolution living-cell analysis,”
Appl. Opt., 43 6536
–6544
(2004). https://doi.org/10.1364/AO.43.006536 0003-6935 Google Scholar
P. Marquet,
B. Rappaz,
P. J. Magistretti,
E. Cuche,
Y. Emery,
T. Colomb, and
C. Depeursinge,
“Digital holographic microscopy: a noninvasive contrast imaging technique allowing quantitative visualization of living cells with subwavelength axial accuracy,”
Opt. Lett., 30 468
–470
(2005). https://doi.org/10.1364/OL.30.000468 0146-9592 Google Scholar
P. Chavel,
“Optical noise and temporal coherence,”
J. Opt. Soc. Am., 70 935
–943
(1980). 0030-3941 Google Scholar
E. N. Leith,
C. Chen,
H. Chen,
Y. Chen,
J. Lopez,
P.-C. Sun, and
D. Dilworth,
“Imaging through scattering media using spatial incoherence techniques,”
Opt. Lett., 16 1820
–1822
(1991). 0146-9592 Google Scholar
G. Indebetouw and
P. Klysubun,
“Imaging through scattering media with depth resolution by use of low-coherence gating in spatiotemporal digital holography,”
Opt. Lett., 25 212
–214
(2000). https://doi.org/10.1038/35012221 0146-9592 Google Scholar
G. Indebetouw and
P. Klysubun,
“Spatiotemporal digital microholography,”
J. Opt. Soc. Am. A, 18 319
–325
(2001). 0740-3232 Google Scholar
F. Dubois,
L. Joannes, and
J. C. Legros,
“Improved three-dimensional imaging with a digital holography microscope with a source of partial spatial coherence,”
Appl. Opt., 38 7085
–7094
(1999). 0003-6935 Google Scholar
F. Dubois,
M.-L. Novella Requena,
C. Minetti,
O. Monnom, and
E. Istasse,
“Partial spatial coherence effects in digital holographic microscopy with a laser source,”
Appl. Opt., 43 1131
–1139
(2004). https://doi.org/10.1364/AO.43.001131 0003-6935 Google Scholar
O. Debeir,
P. Van Ham,
R. Kiss, and
C. Decaestecker,
“Tracking of migrating cells under phase-contrast video microscopy with combined mean-shift processes,”
IEEE Trans. Med. Imaging, 24 697
–711
(2005). 0278-0062 Google Scholar
|


