
|
|
1.IntroductionDoppler optical coherence tomography1, 2 (DOCT) is a promising imaging modality that provides a functional extension of optical coherence tomography3 (OCT). DOCT exhibits the high spatial resolution of OCT, enabling visualization of structures at near histological levels, and also yields4 velocity resolutions as low as . This combination is attractive for biomedical applications and has yielded noninvasive blood flow detection in human retina,5 skin,6 and gastrointestinal (GI) tract.7 Along with diagnostic detection of blood flow, DOCT offers a novel method of monitoring microvascular changes due to therapeutic intervention with unprecedented spatial and blood flow velocity resolutions.8, 9 However, many clinical applications require high-resolution imaging of deeply seated tissues, and these anatomical sites cannot be reached by conventional OCT due to its limited penetration depth of 1 to in nontransparent tissues. Consequently, in vivo imaging of microvasculature using DOCT has been limited to transparent organs (e.g., the eye) or near-surface applications such as epithelial layers of the GI tract. Needle-based interstitial DOCT (IS-DOCT) has been previously described as a useful technique for in vivo assessment of microvasculature and microstructure at a greater depth, providing potential accessibility of DOCT to anatomical sites such as the brain, liver, pancreas, or prostate.10 Photodynamic therapy (PDT) is an emerging treatment that causes cellular and/or vascular tissue damage through photoproducts generated by light activation of localized photosensitizers. Tumor destruction is associated with PDT’s ability to induce cellular apoptosis,11 activate the host immune system,12 and/or cause vascular damage,13 depending on the photosensitizer and other treatment parameters. Foster 14 have outlined a photodynamic mechanism whereby high-irradiance-rate exposure of photosensitized tissue results in the consumption of molecular oxygen at a rate faster than can be supplied by the vascular network. This results in the reduced production of the highly oxidative singlet oxygen species, which is thought to be the main cytotoxic agent leading to cell death.15 Monitoring the vascular effects during PDT may be useful for tracking an individual tumor’s response to treatment. This could yield dynamic feedback mechanisms that could be used to minimize treatment shortcomings, such as suboptimal oxygen consumption rates. IS-DOCT offers a unique minimally invasive imaging opportunity for monitoring the vascular response of PDT as it can acquire simultaneous microstructural and microvascular images of a localized region of tumor in real time. The aim of this study was to demonstrate the ability of IS-DOCT to monitor and quantify the microvascular response of PDT, as a function of varying light irradiance rates and total irradiances. 2.Materials and Methods2.1.IS-DOCT Probe and SystemWe previously described the 8-kHz time-domain DOCT system and IS-DOCT needle probe used in this study.16, 17 Briefly, the DOCT system utilizes a near-IR source at a center wavelength, with a coherence length of in tissue and a Doppler flow sensitivity of at 1 frame/s (fps) in vivo. The IS-DOCT needle probe uses a 22G echogenic needle ( outer diameter) that is compatible with interventional radiological guidance, and is actuated by a linear scanner via flexible catheters. The probe is driven longitudinally inside the catheter by a linear scanner, forming a 2-D DOCT image when combined with the coherence depth scanning. The lens consists of a clad and core multimode gradient-index (GRIN) fiber, fusion spliced to an unbuffered tip of a cladding diameter single-mode fiber. The GRIN fiber is cleaved and polished at pitch to focus light at a distance of outside of the catheter after fusion splicing to a 50-angle polished, coreless fiber tip for total internal reflection. 2.2.Animal ModelThis study used 45 male Copenhagen rats (Charles River Laboratories, Wilmington, Massachusetts, USA) housed in standard conditions under a protocol approved by the institutional animal care committee at Princess Margaret Hospital, Toronto, Canada. Mat-Ly-Lu rat prostate cancer cells were derived from the subline R3327-AT-1 rat prostate cells and were maintained as cell cultures in growth media (RPMI 1640 media +L-glutamine, 10% fetal bovine serum, 1% penicillin and streptomycin). Note 5 to 10% of the cells were resuspended every other day to prevent overgrowth. Cells were harvested and prepared at for injection. All animals received intradermal bolus injections of of the injectate in the hind leg after removal of hair and sterilization of the skin. Each tumor was grown for 7 to 10 days or until a diameter of 0.5 to was reached. The tumor size was measured along the length, width, and height axes with callipers. Thirty-four of the tumor-bearing rats were injected intravenously with of (Axcan Pharma, Mont-Saint-Hilaire, QC, Canada), while the remaining 10 were split into two control groups without Photofrin. The first group measured the effects of the probe on the microvascular environment. The second control group was used to measure the effects of the probe and maximum irradiance rate ( , total irradiance) on the microvascular environment. All rats were anaesthetized with 2% isoflurane and oxygen at through a nose cone for the IS-DOCT imaging procedures. The rats were kept at body temperature during all experimental procedures with a heating pad. Twenty-four hours postimaging, the animals were euthanized with an intracardiac injection of euthenol and the tumors were resected for histology. 2.3.PDT Treatment and IS-DOCT ImagingPhotofrin was injected via the tail vein 20 to prior to PDT treatment. The tumor surface was irradiated superficially through the intact skin with a broad-beam diode laser (University Health Network, Laboratory of Applied Biophotonics, Toronto, Ontario, Canada) collimated to a 1-cm-diam spot size. The animals were chosen at random to populate five different irradiance rate groups ( , 16, 33, 66, and ) and the two control groups ( : probe only, probe light). The total irradiance, delivered over , was 12, 24, 50, 99, and , respectively. A summary of the experimental parameters is shown in Table 1 . IS-DOCT was used to collect structural, color Doppler, and velocity variance images before, during, and after PDT treatment at an imaging rate of . The needle probe was inserted interstitially toward the bottom margin of the tumor with the imaging direction toward the tumor bulk, to detect the deep microvasculature, as seen in Fig. 1 . This imaging geometry and viewing direction were chosen such that the IS-DOCT probe would assess the PDT effects deep within the tumor, while not acquiring data in its own shadow. Fig. 1Insertion of needle probe near the deep margin of the tumor, with IS-DOCT imaging direction as shown. 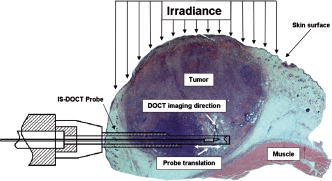 PDT treatment was started after blood vessels were located using IS-DOCT. Imaging was continuous and divided into three periods: before ( to ), during ( to ), and after ( to ) treatment. The cross-sectional areas of the blood vessels were quantified by the summation of pixel counts in the color-coded regions in the velocity variance images. This pixel count summation for each image was then averaged for each minute; we define this value as the vascular index17 (VI). The VI for each minute of imaging was then normalized to the highest value throughout the imaging session. The changes in detected blood flow could then be quantified by analyzing the normalized vascular index (NVI) as a function of time before, during, and after PDT treatment. 2.4.StatisticsStatistical analysis was performed using JMP v6.0. (JMP, Cary, North Carolina, USA). All error bars in figures and in the text are presented as standard error. The rate of change of the NVI during PDT was obtained by linear regression of the IS-DOCT data. To test the prediction that there were no significant differences between variables under test (null hypothesis), the Wilcoxon rank sum test was used to compare the mean rate of change of the NVI for the different irradiance rates. The distribution with degrees of freedom ( of groups) closely approximates18 the distribution of . Therefore, the null hypothesis was tested by computing and comparing this result with the critical values for and labeled as . A value greater than 0.05 was considered to be statistically significant. For all instances where the null hypothesis was found to be false, the power was then calculated to determine the likelihood of the experiment to detect significant differences. All tests used an level of 0.05. 3.ResultsTumors were successfully grown in all 45 rats, with mean length of , width of , and height of , as measured by callipers. Neither treatment nor tumor-induced deaths occurred. Short-term PDT responses, including erythema and edema, were observed before sacrifice in all 35 rats undergoing PDT treatment. Neither erythema nor edema were observed in the control animals. In vivo monitoring of PDT using IS-DOCT was performed in all tumor-bearing animals. Figure 2 shows examples of the detected vasculature presented via the color Doppler and velocity variance images overlaid onto the structural images. A typical sequence of velocity variance images obtained in the course of the PDT treatment (Fig. 3 ) demonstrated several vessels that underwent complete vascular shutdown, with partial recovery of some vessels post treatment. Fig. 2IS-DOCT images of Dunning prostate tumor in a rat model prior to PDT treatment; (a) to (c) structural, color-Doppler, and variance images of several large detected vessels; (d) to (f) structural, color-Doppler, and variance images of many small detected blood vessels in the rat tumor. (Color online only).  Fig. 3Sequence of IS-DOCT images of a Dunning prostate tumor in a rat model before ( to ), during ( to ), and after ( to ) PDT light exposure. Blood flow was color-coded via the detected velocity variance images. Reduction in vessel cross-sectional area was observed during treatment, and slight vascular recovery occurred post-treatment. (Color online only). 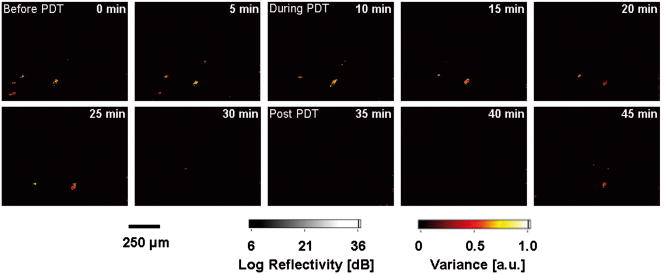 It was previously demonstrated that the PDT response can be heterogeneous within the tumor, depending on treatment conditions such as local photosensitizer concentration,19 tumor oxygenation,20 and fluence rate.21 Resulting intratumor variations may affect the local vascular response of PDT as measured by the IS-DOCT system. Such a heterogeneous PDT response may be sampled by multiple IS probes positioned at appropriate locations in the tumor, analogous to multifiber fluence rate measurement techniques currently employed in clinical trials of PDT in the prostate.22 Figures 4a and 4b show that no significant changes occurred in the NVI for the two control groups. In comparison, Figs. 5a, 5b, 5c, 5d, 5e, 5f reveal the decreasing trend in the NVI during treatment as a function of varying PDT irradiance rates and total irradiance. Figure 6a shows that the maximum vascular shutdown of (in other words, only 19% of the pretreatment vasculature remained) without significant post-treatment recovery occurring at an intermediate irradiance rate of ( total light irradiance). This vascular shutdown is statistically different from all other treatment conditions. Fig. 4(a) Normalized average vascular index of control group where the probe was inserted into the tumor (no light or photosensitizer) and (b) control group with probe insertion plus light exposure at maximum irradiance rate of , resulting in a total irradiance of (no photosensitizer). 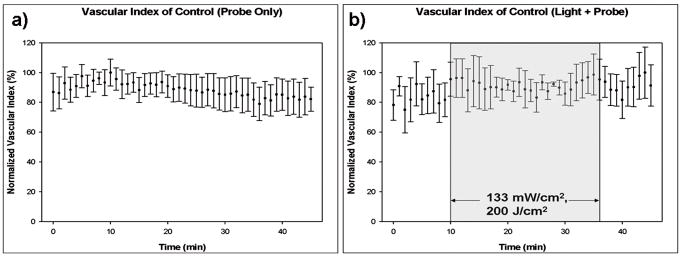 Fig. 5Irradiance rate and total irradiance dependencies as measured by IS-DOCT: (a) lowest PDT irradiance rate of , resulting in a total irradiance of ; (b) irradiance rate of , resulting in a total irradiance of ; (c) PDT irradiance rate of , resulting in a total irradiance of ; (d) PDT irradiance rate of , resulting in a total irradiance of ; (e) highest PDT irradiance rate of , resulting in a total irradiance of ; and (f) comparison of irradiance rate and total irradiance responses.  Fig. 6(a) Ratio comparing initial vascular index (average of to ) and a time point (average of to 45) post-PDT and (b) slope of vascular index as a function of irradiance rate.  Table 1Experimental conditions in the IS-DOCT/PDT study.
Measurements acquired by IS-DOCT during PDT resulted in quantifiable irradiance rate dependencies, as shown in Fig. 6b. The rate of vascular shutdown, as measured by IS-DOCT, was calculated via linear regression during the PDT treatment time ( to ). As the irradiance rate was increased from 8 to , a change in the rate of vascular shutdown was measured, as demonstrated in Fig. 6b. The vascular shutdown rate at the 66- and irradiance rates were found to be statistically equivalent with a value of 0.95 and a power value of 0.05, while all other vascular shutdown rates were found to be statistically different. 4.DiscussionPrevious DOCT studies reported that a major drawback of imaging the vascular effects of PDT is that the interrogated regions are limited to subepithelial surfaces, luminal surfaces, and transparent organs.23, 24 This study demonstrates that it is technically feasible to monitor the microvascular PDT response deep within tissue, overcoming the previously mentioned tissue accessibility limitations of DOCT. In this study, irradiance rate and total-irradiance-dependent trends were quantified using the IS-DOCT normalized vascular index, revealing general trends of the microvascular response to varying light dose conditions. Minimal changes in the vascular index of the two control groups (probe only, probe light) were observed, but were not statistically significant when compared to one another or any other treatment groups. As the irradiance rate and total light irradiance were increased, more vascular shutdown was achieved; however, some post-treatment recovery of the microvasculature was also observed. This reduction in the vascular index during PDT, with reprofusion of blood occurring post-PDT, exhibited similar trends observed to our previous noninterstitial DOCT studies in normal rat colon and IS-DOCT Dunning prostate model.25 The intermediate irradiance rate of appeared to provide the maximum vascular shutdown, without significant recovery during the of IS-DOCT imaging post-treatment, although longer observation would be required to assess whether this was a permanent effect. A vascular shutdown threshold response was observed, where the rate of vascular response and total vascular shutdown did not statistically change above an irradiance rate of or total irradiance of . The largest percentage of vascular reprofusion post-PDT also occurred at these irradiance rates and total irradiance. This is important, as the efficacy of PDT is directly related to the production of singlet oxygen through the supply of molecular oxygen.26 Using an irradiance or total irradiance value that shuts down the vasculature too abruptly or too drastically during PDT will limit the supply of molecular oxygen to the region of interest. This will result27 in an ineffective treatment, as will a very low irradiance (rate). This emphasizes the fact that PDT is a complex and dynamic process requiring accurate, real-time assessments of treatment delivery and therapeutic response. IS-DOCT may fulfill these requirements, but difficulty remains in deriving the optimal IS-DOCT/PDT monitoring metrics and how they will be used to predict treatment response and outcome. Although this study did not investigate treatment outcome, it has been previously shown by Henderson 28 that for every increase in irradiance rate, a similar increase in total irradiance was required to achieve tumor cure. Different microvascular responses, as measured by the IS-DOCT system, may correlate to both the irradiance rate and the total irradiance received by the tumor. Further experimentation is required to define the relative importance of these two parameters on the microvascular response, and how they affect PDT treatment progression and outcome. Several new directions will be pursued for better quantification of this work. First are histological studies, including TUNEL (terminal deoxynucleotidyl transferace biotin-dUTP nick end labeling), caspase-3, and factor VIII immunohistological staining, will be conducted to correlate total irradiance and irradiance rate vascular effects as observed by histology with IS-DOCT results. Second, the clinically validated field of Doppler ultrasound imaging has several potential signal processing tools for quantifying vasculature, of which power Doppler (PD) is of particular interest. We are currently investigating PD signal processing for OCT as a method to improve our ability to quantify the vascular response of PDT. Third, under high-frequency ultrasound guidance, the 3-D tumor morphology can be imaged. These images can then be used to approximate the epidermal thickness and 3-D position of the interstitial probe, enabling calculations of light propagation in tissue, to approximate the actual subsurface fluence in the region imaged by IS-DOCT. In addition, comparisons of IS-DOCT imaging metrics to other measurable microvascular responses (e.g., derived from inravital microscopy or micro-CT data) should further elucidate the relationship between tumor microvasculature (changes) and PDT (response). This in turn may provide the necessary tools for accurate real-time guidance and early assessment of the therapeutic efficacy of PDT. 5.ConclusionsThe results of this study demonstrate the ability of IS-DOCT to detect and monitor microvascular changes prior to, during, and after PDT deep within the tumor in real time, yielding quantitative measures of the vascular response to different treatment conditions. IS-DOCT may be an effective tool for high-resolution, real-time visualization and monitoring of the tissue microvascular response to PDT. This capability may play an important role in pretreatment planning, feedback control for treatment optimization, determining treatment endpoints, and post-treatment assessment. With the interstitial probe capability, DOCT is no longer restricted to subepithelial, intraluminal, or transparent organ imaging. This technique may be used to image microstructure and microvasculature on deeply situated organs such as the liver, brain, or prostate. Further, quantifying vascular targeted drugs and imaging early embryonic development in vivo are envisioned. AcknowledgmentsThis work was supported by the Canadian Institutes of Health Research, Photonics Research Ontario, the Premier’s Research Excellence Award, the Gordon Lang and the Samuel B. McLaughlin Foundations, and the Canadian Cancer Society through a grant from the National Cancer Institute of Canada. The authors acknowledge assistance from Dr. Margarete Akens and Dr. Lothar Lilge from the Ontario Cancer Institute, Toronto, Ontario, Canada. ReferencesS. Yazdanfar,
M. D. Kulkarni, and
J. A. Izatt,
“High resolution imaging of in vivo cardiac dynamics using color Doppler optical coherence tomography,”
Opt. Express, 1 424
–431
(1997). 1094-4087 Google Scholar
Z. Chen,
T. E. Milner,
D. Dave, and
J. S. Nelson,
“Optical Doppler tomographic imaging of fluid flow velocity in highly scattering media,”
Opt. Lett., 1 64
–66
(1997). 0146-9592 Google Scholar
D. Huang,
E. A. Swanson,
C. P. Lin,
J. S. Schuman,
W. G. Stinson,
W. Chang,
M. R. Hee,
T. Flotte,
K. Gregory,
C. A. Puliafito, and
J. G. Fujimoto,
“Optical coherence tomography,”
Science, 254 1178
–1181
(1991). https://doi.org/10.1126/science.1957169 0036-8075 Google Scholar
V. X. D. Yang,
M. L. Gordon,
B. Qi,
J. Pekar,
S. Lo,
E. Seng-Yue,
A. Mok,
B. C. Wilson, and
I. A. Vitkin,
“High speed, wide velocity dynamic range Doppler optical coherence tomography Part 1: System design, signal processing, and performance,”
Opt. Express, 4 794
–809
(2003). 1094-4087 Google Scholar
S. Yazdanfar,
A. M. Rollins, and
J. A. Izatt,
“Imaging and velocimetry of the human retinal circulation with color Doppler optical coherence tomography,”
Opt. Lett., 25 1448
–1450
(2000). 0146-9592 Google Scholar
Y. Zhao,
Z. Chen,
C. Saxer,
S. Xiang,
J. F. de Boer, and
J. S. Nelson,
“Phase-resolved optical coherence tomography and optical Doppler tomography for imaging blood flow in human skin with fast scanning speed and velocity sensitivity,”
Opt. Lett., 25 114
–116
(2000). 0146-9592 Google Scholar
V. X. D. Yang,
S. Tang,
M. L. Gordon,
B. Qi,
G. Gardiner,
M. Cirocco,
P. Kortan,
G. B. Haber,
G. Kandel,
I. A. Vitkin,
B. C. Wilson, and
N. E. Marcon,
“Endoscopic Doppler optical coherence tomography in the human GI tract: initial experience,”
Gastrointest. Endosc., 61 879
–890
(2005). 0016-5107 Google Scholar
J. S. Nelson,
K. M. Kelly,
Y. H. Zhao, and
Z. Chen,
“Imaging blood flow in human portwine stain in situ and in real time using Doppler optical coherence tomography,”
Arch. Dermatol., 137 741
–744
(2001). 0003-987X Google Scholar
R. C. Wong,
S. Yazdanfar,
J. A. Izatt,
M. D. Kulkarni,
J. K. Barton,
A. J. Welch,
J. Willis, M. V. Sivak Jr.,
“Visualization of subsurface blood vessels by colour Doppler optical coherence tomography in rats: before and after hemostatic therapy,”
Gastrointest. Endosc., 55 88
–95
(2002). 0016-5107 Google Scholar
V. X. D. Yang,
Y. X. Mao,
N. Munce,
B. Standish,
W. Kucharczyk,
N. E. Marcon,
B. C. Wilson, and
I. A. Vitkin,
“Interstitial Doppler optical coherence tomography,”
Opt. Lett., 30 1791
–1793
(2005). 0146-9592 Google Scholar
N. L. Oleinick,
R. L. Morris, and
I. Belichenko,
“The role of apoptosis in response to photodynamic therapy: what where, why, and how,”
Photochem. Photobiol., 1 1
–21
(2002). https://doi.org/10.1039/b108586g 0031-8655 Google Scholar
F. H. Van Duijnhoven,
R. I. Aalvers,
J. P. Rovers,
O. T. Terpstra, and
P. F. Kuppen,
“The immunological consequences of photodynamic treatment of cancer, a literature review,”
Immunobiology, 207 105
–113
(2003). 0171-2985 Google Scholar
B. Chen,
B. W. Pogue,
I. A. Goodwin,
J. A. O’Hara,
C. M. Wilmot,
J. W. Hutchins,
P. J. Hoopes, and
T. Hasan,
“Blood flow dynamics after photodynamic therapy with verteporfin in the RIF-1 tumor,”
Radiat. Res., 160 452
–459
(2003). 0033-7587 Google Scholar
T. H. Foster,
R. S. Murant,
R. G. Bryant,
R. S. Knox,
S. L. Gibson, and
R. Hilf,
“Oxygen consumption and diffusion effects in photodynamic therapy,”
Radiat. Res., 126 296
–303
(1991). https://doi.org/10.2307/3577919 0033-7587 Google Scholar
K. R. Weishaupt,
C. J. Gomer, and
T. J. Dougherty,
“Identification of singlet oxygen as the cytotoxic agent in photo-inactivation of a murine tumor,”
Cancer Res., 36 2326
–2392
(1976). 0008-5472 Google Scholar
V. X. D. Yang,
M. L. Gordon,
B. Qi,
J. Pekar,
S. Lo,
E. Seng-Yue,
A. Mok,
B. C. Wilson, and
I. A. Vitkin,
“High speed, wide velocity dynamic range Doppler optical coherence tomography. Part I: system design, signal processing, and performance,”
Opt. Express, 11 794
–809
(2003). 1094-4087 Google Scholar
H. Li,
B. A. Standish,
A. Mariampillai,
N. R. Munce,
Y. Mao,
S. Chiu,
N. E. Marcon,
B. C. Wilson,
A. I. Vitkin, and
V. X. D. Yang,
“Feasibility of interstitial Doppler optical coherence tomography for in vivo detection of microvascular changes during photodynamic therapy,”
Lasers Surg. Med., 38 754
–761
(2006). https://doi.org/10.1002/lsm.20387 0196-8092 Google Scholar
S. A. Glantz,
“Alternatives to analysis of variance and the t testbased on ranks,”
Primer of Bio-Statistics, 338
–348 4th ed.McGraw-Hill, New York (1997). Google Scholar
J. C. Finlay,
T. C. Zhu,
A. Dimofte,
D. Stripp,
S. B. Malkowicz,
T. M. Busch, and
S. M. Hahn,
“Interstitial fluorescence spectropscopy in the human prostate during motexafin lutetium-mediated photodynamic therapy,”
Photochem. Photobiol., 82 1270
–1278
(2006). https://doi.org/10.1562/2005-10-04-RA-711 0031-8655 Google Scholar
H. S. Wang,
M. E. Putt,
M. J. Emanuele,
D. B. Shin,
E. Glatstein,
A. G. Yodh, and
T. M. Busch,
“Treatment-induced changes in tumor oxygenation predict photodynamic therapy outcome,”
Cancer Res., 64 7553
–7561
(2004). https://doi.org/10.1158/0008-5472.CAN-03-3632 0008-5472 Google Scholar
B. W. Henderson,
S. O. Gollnick,
J. W. Snyder,
T. M. Busch,
P. C. Kousis,
R. T. Cheney, and
J. Morgan,
“Choice of oxygen-conserving treatment regimen determines the inflammatory response and outcome of photodynamic therapy of tumors,”
Cancer Res., 64 2120
–2126
(2004). 0008-5472 Google Scholar
R. A. Weersink,
A. Bogaards,
M. Gertner,
S. R. H. Davidson,
K. Zhang,
G. Netchev,
J. Trachtenberg, and
B. C. Wilson,
“Techniques for delivery and monitoring of TOOKAD (WST09)-mediated photodynamic therapy of the prostate: Clinical experience and practicalities,”
Photochem. Photobiol., 79 211
–222
(2005). https://doi.org/10.1562/0031-8655(2004)079<0211:RCRQYF>2.0.CO;2 0031-8655 Google Scholar
M. C. G. Aalders,
M. Triesscheijn,
M. Ruevekamp,
M. de Bruin,
P. Baas,
D. J. Faber, and
F. A. Stewart,
“Doppler optical coherence tomography to monitor the effect of photodynamic therapy on tissue morphology and perfusion,”
J. Biomed. Opt., 4 044011
–8
(2006). 1083-3668 Google Scholar
A. Garcia-Layana,
A. Salinas-Alaman,
M. J. Maldonado,
C. Sainz-Gomez, and
A. Fernandez-Hortelano,
“Optical coherence tomography to monitor photodynamic therapy in pathological myopia,”
Br. J. Ophthamol., 90 555
–558
(2006). 0007-1161 Google Scholar
M. L. Gordon,
V. X. D. Yang,
Y. E. Seng Yue,
S. Lo,
B. C. Wilson, and
I. A. Vitkin,
“Doppler optical coherence tomography for monitoring the vascular effects of photodynamic therapy,”
Proc. SPIE, 5316 147
–154
(2004). https://doi.org/10.1117/12.527794 0277-786X Google Scholar
M. J. Niedre,
A. J. Secord,
M. S. Patterson, and
B. C. Wilson,
“In vitro tests of the validity of singlet oxygen luminescence measurements as a dose metric in photodynamic therapy,”
Cancer Res., 63 7986
–7994
(2003). 0008-5472 Google Scholar
B. W. Henderson,
S. O. Gollnick,
J. W. Snyder,
T. M. Busch,
P. C. Kousis,
R. T. Cheney, and
J. Morgan,
“Choice of oxygen-conserving treatment regimen determines the inflammatory response and outcome of photodynamic therapy of tumors,”
Cancer Res., 64 2120
–2126
(2004). 0008-5472 Google Scholar
B. W. Henderson,
T. M. Busch, and
J. W. Snyder,
“Fluence rate as a modulator of PDT mechanisms,”
Lasers Surg. Med., 38 489
–493
(2006). 0196-8092 Google Scholar
|


