|
|
1.IntroductionOptical coherence tomography (OCT) was first demonstrated for cross sectional retinal imaging in 1991 by a Massachusetts Institute of Technology (MIT) team headed by Fujimoto.1 Since then, it has become a clinically useful diagnostic technique in the ophthalmology community. OCT instrumentation, buoyed by a stream of technological advancements, has undergone substantial improvement in the past decade, and, as a result, is now well positioned for wide adoption in various other clinical and research applications.2, 3 A number of promising scientific developments remain on the horizon as well, ensuring that the potential applications for OCT-based techniques will continue to widen for the foreseeable future. OCT is an interferometric imaging technique that maps depth-wise reflections of near-infrared (NIR) light from tissue to form cross sectional images of morphological features at the micrometer scale. In the most basic form, an OCT instrument consists of a Michelson-type interferometer with a focused sample arm beam and a lateral-scanning mechanism. OCT traces its origins to the field of optical coherence-domain reflectometry, a 1-D distance mapping technique that was originally developed to localize reflections from faults in fiber optic networks and was quickly applied to biological applications.4, 5, 6 These ties to the telecommunications industry have allowed the OCT community to leverage existing and state of the art low-cost hardware for biomedical applications. Initial OCT technology was licensed by MIT to Humphrey Systems (now Carl Zeiss Meditec Incorporated, Dublin, California), which commercialized the technology for ophthalmic applications, released its first unit in 1996, gained Federal Drug Administration (FDA) clearance in 2002, and has sold more than 6000 of its Stratus OCT™ systems to date.7 The OCT intellectual property landscape has become quite diverse since the development of this first system, with current patent holdings by a variety of corporate and academic entities. Among the approximately 40 U.S. patents with OCT in the title, Carl Zeiss Meditec still dominates corporate patent holders with more than ten, and the University of California leads academic institutions with four, as of the publication of this review. The corporate landscape itself is also expanding, and clinical OCT systems are now being manufactured for various applications by a group of established and start-up companies that includes Carl Zeiss Meditec Incorporated, LightLab Imaging (Westford, Massachusetts), Imalux Corporation (Cleveland, Ohio), ISIS Optronics GmbH (Mannheim, Germany), OCT Medical Imaging, Incorporated (Irvine, California), Novacam Technologies, Incorporated (Pointe-Claire, Canada), and Lantis Laser Incorporated (Denville, New Jersey). A new set of companies focusing on high-speed retinal imaging, including OptoVue, Incorporated (Fremont, California), Topcon Corporation (Tokyo, Japan), Optol Technology (Zawiercie, Poland), Heidelberg Engineering (Heidelberg, Germany), and Opthalmic Technologies, Incorporated (Toronto, Canada), has also emerged recently. Today, it is estimated that more than 37,000 OCT scans are performed daily in the U.S.8 In addition to the widespread development of clinical OCT systems, a significant market has also developed for research-targeted systems and components. For example, several companies, including Femtolasers Produktions GmbH (Vienna, Austria), Nippon Telegraph and Telephone Corporation (Tokyo, Japan), and Thorlabs, Incorporated (Newton, New Jersey), through its partner MenloSystems GmbH (Munich, Germany), sell compact broad-bandwidth optical sources that are marketed for OCT application. In addition, full-featured stand-alone OCT systems for research use are sold by Thorlabs, Incorporated and Bioptigen, Incorporated (Research Triangle Park, North Carolina), whose 840- and systems incorporate advanced visualization software and are compatible with a broad selection of application-specific scanners. This partnership between industry and academia has lowered the cost of entering the OCT research community. When coupled with the accessibility of ophthalmic OCT systems to clinicians, this commercialization has spurred exponential growth in both scientific and medical OCT research. A simple measure of this growth is the number of academic journal publications with OCT in the title. Figure 1 shows a graph of this metric over time, as measured using the U.S. National Library of Medicine PubMed service and the American Institute of Physics Scitation database, showing medical and scientific studies, respectively. Fig. 1Growth of OCT scientific and medical research publications. The graph shows the number of publications per year with optical coherence tomography in the title as indexed in the PubMed and Scitation databases. Data for 2007 is extrapolated based on the number of citations as of September, 2007.  This surge in OCT investigations has taken place in parallel with the development of next-generation technologies that have opened new frontiers of OCT application. High-speed imaging capabilities are key among these advances, as they have enabled the rapid acquisition rates that are often necessary to reduce artifacts due to patient motion. Additionally, these capabilities have led to the ability to generate 3-D volumetric images within reasonable time constraints. OCT imaging speed increases have been achieved with Fourier domain detection techniques such as spectral-domain OCT (SD-OCT) and swept-source OCT (SS-OCT), where rapid scanning of narrow-band source spectra is performed. These techniques have been made possible by technological advances in detector and source technologies. Finally, application of OCT deep within the body requires that minimally invasive imaging devices be employed since OCT penetration depths are typically limited to about in highly scattering tissues. In addition to handheld probes, a variety of imaging devices have been integrated into clinical devices to allow for minimally invasive OCT imaging throughout the body with endoscopes, catheters, and biopsy needles. 2.Clinical Applications2.1.OphthalmologyOCT has made its most significant clinical contribution in the field of ophthalmology, where it has become a key diagnostic technology in the areas of retinal diseases and glaucoma.9, 10, 11, 12 Ophthalmic OCT imaging has not only made the transition from the bench to the bedside, but has also contributed to new laboratory investigations by revealing previously hidden clinical features of ocular diseases and the microscopic changes associated with treatment. The technique was first commercialized by Carl Zeiss Meditec, Incorporated and is now considered superior to the current standard of care for the evaluation of a number of retinal conditions.13 Retinal OCT imaging provides high-resolution imagery of subsurface retinal features that were previously inaccessible with fluorescein angiography and ophthalmic ultrasound. The contrasting structure and reflectivity in the retinal layers allow for differentiation of the retinal nerve fiber layer (RNFL), nuclear layers, plexiform layers, external limiting membrane, retinal pigment epithelium, photoreceptor layers, and choriocapillaris (Fig. 2 ). In OCT images of the retina, horizontal cell orientation is correlated with high reflectivity, while nuclei and vertical structures have low reflectivity. Fig. 2High-resolution OCT images showing normal retinal structures at axial resolution. Abbreviations: ILM—inner limiting membrane, NFL—nerve fiber layer, GCL—ganglion cell layer, IPL—inner plexiform layer, INL—inner nuclear layer, OPL—outer plexiform layer, ONL—outer nuclear layer, ELM—external limiting membrane, IS/OS—junction between the inner and outer photoreceptor segments, and RPE—retinal pigment epithelium. Images provided by Fujimoto and Drexler.  OCT has been used to diagnose a number of vitreoretinal conditions. In addition to the evaluation of normal vitreous separation caused by aging,14 OCT has been used to identify vitreous adhesions, which are thought to play a potential role in the development of macular holes and macular edema. The severity of macular holes, which are tears in the retina thought to be caused by shrinking vitreous that adheres to the retina, have been extensively investigated using OCT, greatly expanding the general understanding of the disorder.10, 15, 16, 17, 18 These investigations are also crucial for patient care, especially in treatment planning, as surgical treatment decisions are dependent on the extent of damage. Postoperative management of macular hole repair is another powerful application for OCT imaging, which is capable of evaluating foveal features and monitoring for recurrent macular holes.19, 20, 21 Macular edema, a thickening and swelling occurring when fluid and protein deposits collect on or under the macula, is often a complication of diabetic retinopathy and can be caused by fluid leakage from abnormal blood vessels or traction by the vitreous gel. While fluorescein angiography remains the only method for the identification of leaking vessels, it cannot identify cases of nonvascular macular edema. OCT, however, has been extensively employed for the identification of cystoid macular edema and the monitoring of macular thickness, which is correlated to a decrease in central vision.11, 22, 23, 24, 25 Finally, in age-related macular degeneration patients, OCT has been used to assess the vitreoretinal interface and macular attachment, identify the presence of intraretinal cysts, and evaluate the subretinal space.26 Analysis of RNFL thickness, which is thought to be a sensitive indicator of glaucomatous damage, has also been undertaken with OCT.27, 28 In comparison to traditional analysis, which was not capable of assessing diffuse atrophy, commercial OCT systems, which are now equipped with automated software that allows for quantification of RFNL thickness over wide retinal areas, are capable of precise, reproducible measurements.29, 30, 31, 32, 33 Studies have shown that these measurements are highly correlated with visual function.34, 35 Additionally, RFNL thickness measurements allow identification of focal defects in earlier stages of glaucoma development than standard techniques.33, 36 The extensive body of investigative work that has been performed in this area has revealed a strong potential for routine glaucomatous damage assessment using OCT-measured RNFL thickness. Various other ophthalmic OCT applications have also been investigated, including the visualization of lamellar holes, assessment of vitreomacular traction syndrome,37 and measurement of corneal water concentration in vitro.38 OCT has also been used to evaluate chorioretinal disease treatment protocols.39, 40, 41 Pharmacological treatment approaches, including intravitreal drug injections, have been the topic of several recent studies that incorporated OCT imaging.42, 43 These imaging studies have provided powerful visual evidence that drug injections may be preferable to photothermal tissue ablation in certain circumstances. Several additional randomized clinical studies are underway to evaluate laser and pharmacological treatments for macular diseases. These investigations demonstrate the increasing tendency to incorporate OCT imaging, as opposed to angiography alone, into clinical studies, due primarily to its ability to capture treatment-induced retinal changes on the micrometer scale.44, 45, 46 Several recent technological advancements have been applied to retinal imaging. High-speed 3-D OCT retinal imaging, for example, significantly reduces movement-induced artifacts during scans across wide regions.47 The spectral-domain detection techniques that enable high-speed imaging have recently been incorporated into a number of commercial systems. Polarization-sensitive OCT (PS-OCT) is a functional OCT technique that reveals sample-induced polarization changes in the optical field. This technique has been used to map optical retardation and slow-axis orientation in the retina, and to identify a polarization-scrambling layer at the posterior boundary of the retina that is thought to be the retinal pigment epithelium.48, 49 Adaptive optics have also been employed in retinal imaging to correct for wavefront distortions induced by ocular aberrations at the air-cornea interface.50, 51 These techniques compensate for this distortion by employing specialized cameras to account for defocus and astigmatism. These techniques, which often require highly complex optical systems, have shown a significant improvement in resolution over standard OCT imaging, even enabling the visualization of individual photoreceptors. Another significant recent advance is the incorporation of functional information to OCT imaging, a modality referred to as optophysiology, wherein changes in dark-adapted retina caused by light stimulation result in pronounced local variation of the tissue reflectivity profile in the inner/outer segments of the photoreceptor layer and the plexiform layers. The technique could significantly improve the diagnosis of various ophthalmic conditions that have functional vision impairment but lack associated morphological changes, potentially leading to a better understanding of retinal physiology and pathology.52 2.2.CardiologyOver the past decade, OCT has been extensively applied in the field of cardiology. It was first used to examine the structural integrity of the vasculature in the coronary artery, and more recently has been applied for cellular and molecular analysis using modalities such as spectroscopic OCT and PS-OCT. 53, 54, 55, 56, 57, 58, 59, 60, 61, 62, 63, 64, 65, 66, 67, 68, 69, 70, 71 There have been several technological advances that have allowed OCT to become adaptable for imaging the cardiovasculature, including the development of rotational catheter-based probes, the improvement of acquisition speed, and the introduction of functional OCT modalities. As these technological advances have been made, imaging and validation have been performed in vivo. In comparison to intravascular ultrasound (IVUS), OCT provides higher resolution by approximately an order of magnitude (Fig. 3 ).55, 57, 59, 62 In addition, probes have been developed to integrate OCT sample-arm optics into intravascular catheters, providing forward and radial OCT imaging capabilities.65, 72 Catheter-based imaging, enabled by high-speed data acquisition systems,73 can be performed by either manually feeding the probe through the vasculature or automatically pulling it through the vasculature during image acquisition. Fig. 3Intravascular imaging of a fibrous coronary plaque showing: —intimia (with intimial hyperplasia), —media, and —adventitia. The left figure is an intravascular OCT image showing a clear delineation of layers, including the internal and external elastic laminea. A fibrous plaque is visible and partially obscured by a guidewire shadow artifact . The right figure is a corresponding IVUS image at the same location.62 Reprinted with permission. Copyright Elsevier, 2002.  Atherosclerosis is the process in which materials such as cellular waste, fatty substances, cholesterol, calcium, and fibrin build on the inner lining of an artery, or in regions surrounding the lumen. Atherosclerosis currently accounts for more than 75% of cardiovascular diseases (CVDs) including strokes, which make up 18% of CVDs.74 The development of vulnerable plaques is often caused by an inflammatory response and is a key component in the development of atherosclerosis and of CVDs in general. Recent research has focused not only on the detection of plaques but also on their potential for rupture. Distinguishing characteristics of vulnerable plaques include a thin fibrous cap, a large lipid pool, and an increase in macrophage activity. The ability to identify the location and progression of atherosclerotic lesions has become a critical issue, since they are a leading cause of death and severe long-term disability.74 An ideal clinical application for cardiovascular OCT imaging is the visualization of vulnerable plaques in the coronary or carotid arteries, and evaluation of their potential for progression or rupture. This evaluation would ideally be performed after these suspicious areas had been localized regionally by another method like CT, ultrasound, or fluoroscopy. Structural OCT images penetrate about into tissue and have been correlated with IVUS images, the current standard in intracoronary imaging.62 Intravascular OCT imaging is limited by tissue penetration depth and blood-induced signal attenuation, which can be reduced with a saline flush or temporary vascular balloon occlusion prior to imaging. OCT has been demonstrated as a tool for in vivo quantification of activated macrophage content and identification of plaque type contained in a lesion.69, 75 Plaque identification has been demonstrated with high sensitivity and specificity (fibrous 87%, 97%; fibrocalcific 95%, 100%; and lipid-rich 92%, 94%). The OCT-quantified macrophage density underneath the fibrous cap has been shown to directly correlate with the patient’s clinical presentation. The presence of activated macrophages located near the endothelial layer is thought to contribute to the instability of a vulnerable plaque by tissue factor expression and the erosion of the endothelial layer.68, 75, 76 In addition to the presence of macrophages, clinically interesting materials include calcific nodules associated with plaque thrombosis, multinucleated macrophages, and cholesterol crystals present in lipid pools. These materials are being investigated with OCT, and preliminary results validate the ability to detect and identify plaques and to assess associated risk factors.62, 69, 75 In addition, OCT has been used to characterize the attenuation and layer thickness changes associated with arterial wall components such as the intima, media, lipid-rich regions, and calcifications.77, 78, 79, 80 Intravascular OCT has been successfully used in the characterization and visualization of cardiac interventions, such as percutaneous coronary intervention and stent implantations. 53, 56, 57, 58, 62, 64, 68, 69 The most common cause of procedural failure in the treatment of chronic total occlusion (CTO) by percutaneous coronary intervention is the inability to properly navigate the guidewire. In cases of CTO of a coronary artery, OCT is being evaluated as a tool to decrease the chances of guidewire perforation of the artery and dissection of the intima.81, 82 In the case of stent implantation, imaging has been performed prior to balloon deployment and after stent installation, giving surgeons a real-time assessment of stent apposition and its role in re-expanding the vascular walls.54, 61 OCT was also recently used to visualize several features that could not be observed using IVUS, including stent integrity, neointimal proliferation, and neovascularization.77, 83, 84 The high-resolution in-vivo OCT images allowed for a real-time assessment of the optimal placement and deployment of stents by allowing for assessment of stent overexpansion and identification of poststenting vessel injuries.54, 85 In addition, OCT has been used to view neointimal hyperplasia resulting from coronary drug-eluting stent implantation. Finally, high-resolution OCT imaging has been applied for the assessment of stent failures such as restenosis and stent thrombosis. Recent efforts to develop functional OCT modalities 86, 87, 88, 89, 90, 91, 92, 93, 94, 95, 96 have allowed cardiovascular imaging to progress beyond morphological sensitivity. These OCT techniques are helping to bridge the gap between the structural and underlying biochemical information that may lead to improved understanding and assessment of disease. PS-OCT, for example, is a functional mode of OCT92 that has shown potential in the study of vulnerable plaques. Changes in intrinsic tissue birefringence are thought to be indicative of changes in the tissue functionality and structure. Some preliminary studies show that fibrous and calcified plaques have unique birefringence properties that can be visualized with PS-OCT. Also, the concentration of collagen rather than the collagen type was found to dominate overall plaque birefringence.97 Since the reduced synthesis of collagen and the increased expression of collagenase are associated with the development of vulnerable plaques, it is hypothesized that the accompanied loss of birefringence will be detectable with PS-OCT. In the event of an accumulation of collagen leading to vascular stenosis, PS-OCT may also be able to detect the associated increase in birefringence.97, 98 OCT can also be used to measure the intrinsic optical attenuation coefficient of tissue in situ.99 This capability may allow for spatial discrimination between thrombus, lipid-rich regions, intimal tissue, calcified tissue, and medial tissue.79, 80, 100 Other functional modalities like optical coherence tomographic elastography, sometimes referred to as optical coherence elastography, are also being investigated to evaluate the mechanical properties of arterial walls.101, 102 Intravascular OCT has begun to move from the validation phase to clinical use. For example, the effects of focal and multifocal macrophage distribution have been studied in patient populations at the Massachusetts General Hospital.75 These studies demonstrate the progression of OCT imaging from the bench to the bedside and back, through the direct clinical impact on patient care and the research contribution of OCT-generated insights into the pathogenesis of coronary diseases. Finally, commercial OCT systems, including those developed by LightLab Imaging, are being targeted to the cardiovascular market, primarily aiming to more precisely direct conventional balloon angioplasty and stent procedures. LightLab Imaging has installed 80 intravascular OCT imaging systems (Fig. 4 ), completed a 100-patient U.S. Food and Drug Administration (FDA) trial, and obtained regulatory approvals for cardiology imaging in the European Union, China, and Korea. 2.3.OncologyOCT application in the field of oncology is a relatively recent development. Despite the short time since development, imaging has been performed on a broad spectrum of malignancies including those arising in the breast, bladder, brain, gastrointestinal, respiratory, and reproductive tracts, skin, ear, nose, and throat. OCT imaging has largely been applied for the evaluation of surgical margins and the early detection of small lesions that would often not be visible on gross examination, two tasks that align well with current clinical emphases on early detection and intervention. First demonstrated in rat mammary tumor models,103 OCT has the potential to be an effective tool for the detection of lesions in the human breast due to the significant structural differences between the fibro-fatty tissue comprising most of the breast, and the densely scattering tumor tissue that arises from within the functional epithelial network of ducts and lobules (Fig. 5 ). By analyzing the spatial frequency content of the axial scattering response, highly sensitive tissue classification has been shown with normal tissue and invasive ductal carcinoma lesions.104 The internal location of most breast lesions limits OCT application to open surgical procedures or requires the use of needle-based imaging devices. Fig. 5OCT imaging of the human breast. The bottom images are of an excised human breast tumor showing the margin between invasive ductal carcinoma (left side) and normal fatty tissue (right side). The OCT and hematoxylin and eosin stained histological section correspond well. Axial scans from the two tissue types (top) show the changes in tissue density and separation between scattering features.  In the operating room, OCT has been used to scan recently excised breast tissue during lumpectomy procedures to assess the margin of normal tissue surrounding the tumor. Typical procedures call for initial gross pathological evaluation of the mass, followed by light microscopy of frozen or paraffin-embedded tissue sections. Not only is this procedure time and labor intensive, but it also suffers from a number of potential problems, including limited spatial sampling over the mass, seepage of ink deposited during gross examination, and artifacts induced by radiographic manipulation.105 By imaging the top of the entire tissue surface immediately on resection, the margin status can be assessed quickly and thoroughly with OCT, enabling the surgeon to resect additional tissue immediately, if necessary.106 OCT has also been investigated as an adjunct to the standard sentinel lymph node biopsy (SLNB) procedure used to map the lymphatic system and determine whether a primary breast tumor has metastasized.107 By using dyes or radioactive tracers to locate the first node in the lymphatic drainage pattern leading away from the tumor site, the SLNB procedure drastically reduces the number of lymph node resections required for accurate histopathological staging of the disease. OCT may be applied in vivo to provide real-time detection and indicate the necessity of additional surgical resection. Breast biopsy procedures, used to physically sample suspicious tissue without open surgery, may also be improved by incorporating OCT-based instrumentation. Significant sampling difficulties have been reported when guiding needle biopsies with external ultrasound and x-ray imaging techniques, as is the current standard practice. By incorporating a biopsy needle device into the OCT sample arm, additional diagnostic information can be generated, aiding in the identification of the appropriate tissue for biopsy. Single axial scans can be acquired using focusing micro-optics at the tip of a single-mode optical fiber, potentially providing diagnostically significant backscattering and refractive-index information from a device that can be easily incorporated into a standard biopsy needle.108, 109, 110, 111 Ear, nose, and throat and esophageal lesions are another set of promising targets for OCT imaging due to the difficulties presented by traditional visual examination and the accessibility of tissue using specialized endoscopic OCT techniques.112, 113, 114 OCT has been used to evaluate the laryngeal mucosa,115 the most common site of primary head and neck malignancy development, and has been found to be an effective means of quantifying the thickness of the epithelium, evaluating the integrity of the basement membrane, and visualizing the structure of the lamina propria.116, 117 In addition, preliminary studies have been conducted to evaluate the application of OCT imaging to the oral cavity, oropharynx, vocal folds, and nasal mucosa.118, 119, 120 OCT has also been extensively applied in the gastrointestinal tract.121, 122, 123, 124 Patients with Barrett’s esophagus, a condition of cellular metaplasia that can progress to esophageal adenocarcinoma, typically undergo regular endoscopic surveillance and biopsy to monitor for dysplastic changes. A number of studies 125, 126, 127, 128, 129, 130, 131, 132 have been conducted to determine the feasibility of using OCT imaging to identify suspicious lesions, including a recent blinded clinical trial that showed an accuracy of 78% for the OCT detection of dysplasia in patients with Barrett’s esophagus.127 While some improvements in clinician training, feature definition, and system resolution are still needed, this OCT application is a strong candidate for future clinical adoption. Finally, advances in the analysis of angle-resolved axial-scan data for the evaluation of scatterer size have been applied for the evaluation of nuclear morphology, generating promising results for detecting dysplasia in an animal model.133 Recently, promising advances have also been made in the detection of cervical cancer with OCT. In-vivo pilot studies have shown that in premenopausal women, average OCT reflection intensities from abnormal cervical epithelium were significantly stronger than normal epithelium, and vice versa in postmenopausal women.109, 134 These differences are likely due to well-characterized neoplastic changes in the chromatin texture and the nuclear morphology and texture.135 Scattering changes have been incorporated into algorithmic tools developed for the identification of unique pathologies by fitting experimental data to layered media models simulated within the framework of small-angle radiative transfer approximations.136 In addition to these academic investigations of OCT in oncology, several applications have also been embraced by commercial system developers. Imalux Corporation, for example, has built on significant academic research, 137, 138, 139, 140, 141, 142, 143, 144, 145 and is targeting the detection of bladder cancer, among other applications. OCT is thought to be valuable as an adjunct to traditional cystoscopy and laparoscopy procedures (Fig. 6 ). In transurethral resection of bladder tumors, for example, OCT has the potential to eliminate local recurrence and minimize the amount of normal tissue removed by guiding surgical resection lines. Another commercially targeted application is dermatological evaluation, a field in which OCT is well established for cross sectional visualization of the dermis, epidermis, adnexal structures, blood vessels, and boundaries of cancerous lesions (Fig. 7 ).146, 147, 148 Although general-purpose OCT systems can easily target the skin, ISIS Optronics has developed a commercial OCT system that is specifically tailored to dermatology applications, allowing for both scattering and refractive index mapping. Fig. 6(a) High magnification OCT image of benign human bladder taken with a clinical system during cystoscopy. Three distinct layers are visible: urothelium (U), lamina propria (L), and muscularis propria (M). A sharp border is visible between the urothelium and the lamina propria. Image provided by the Imalux Corporation, courtesy of Manyak (George Washington University, Washington DC). (b) Low-magnification OCT image of a neoplastic rat bladder taken with a research system. The diseased urothelium (U’, arrow) is clearly visible. Reprinted with permission (labels modified). Copyright Optical Society of America, 2002.  2.4.Other ApplicationsNew applications for OCT are constantly being developed outside of the fields of ophthalmology, cardiology, and oncology. Noteworthy developments include the investigation of OCT and PS-OCT for the evaluation of musculoskeletal tissues,149, 150, 151 the quantitative mapping of the upper airway size and shape,152, 153 and the visualization of dental structures.154, 155 Dental OCT, capable of detecting early decay not visible on standard x-ray, is being developed commercially by Lantis Laser Incorporated, which has secured intellectual property rights, has raised significant funding, and is in the process of designing a specialized clinical system. Additionally, applications in areas such as neurological, ovarian, and prostate imaging continue to advance, but are not yet ready for clinical use. OCT image-guided procedures continue to affect patient care by moving diagnostic procedures out of the laboratory and to the point of care. 3.Clinical TranslationSimilarly to the developmental process for pharmaceutical agents, there are five developmental steps that a new medical imaging technique takes as it is developed from the laboratory bench to the bedside (Fig. 8 ).156 Step 0 is focused on technology development in the laboratory through initial design, calibration, and testing. About five years is typically spent on this step. Step 1 involves pilot studies that are carried out to assess the feasibility and safety of the technique for the clinical application of interest. During this step, the criteria or methods used to differentiate between normal and abnormal tissue are evaluated. As these studies gain momentum and provide promising results, research moves on to Step 2, which is a limited trial to study the usefulness of the technique in distinguishing between normal and abnormal tissue or in grading different disease states. In Step 3, technology standardization is of critical importance as multicenter randomized clinical trials begin. This is the ultimate validation of the optical imaging modality in a clinical environment. About ten years are typically spent in Steps 1 to 3 to fully translate a technology from the bench to the bedside. Finally, in Step 4 the new imaging modality is adopted as the standard of care, and is further commercialized for the clinical specialty of interest. This process can be further extended by the introduction of contrast agents or other exogenous agents. Fig. 8Diagram of the translational steps. The focus is on validation within the first phases of development. The focus shifts to interaction with the other groups as development moves toward clinical trials, acceptance into medical community, and commercialization.  3.1.Imaging ValidationThroughout the translation process, there is continuous feedback between tissue phantom studies, cell line studies, animal studies, and human subject studies. The performance of an imaging system must be continuously evaluated using these investigation methods. In OCT, tissue phantoms, broadly defined as samples designed to mimic human tissue, may model the optical properties of tissue by incorporating scatterers and absorbers. They may also be constructed to model the mechanical and spatial properties of tissue through the use of scaffolds or gels. More advanced phantoms may incorporate the use of cell lines such as cardiomyocytes, fibroblasts, and cancer cells. Grown in cell scaffolds, these phantoms are often used to identify biological components that are overexpressed in a disease of interest and to investigate their contribution to observed OCT signals. Ex-vivo tissue specimens can be obtained from either well-characterized animal models or human patients. A number of appropriate animal models exist for human diseases. For example, N-methyl-N-nitrosourea (MNU) -induced rat mammary tumors model human ductal carcinoma, and atherogenic rabbit diets induce atherosclerotic lesions similar to those in humans. Human tissue specimens may be available from local medical institutions in the form of discarded pathology specimens or from tissue banks and repositories157, 158 run by medical centers, hospital consortiums, or governmental agencies such as the United States National Institutes of Health. As OCT system designs have become more portable, many in-vivo imaging opportunities have become available. A number of unique issues are introduced during in-vivo testing such as motion artifacts, the mechanical properties of tissue, the physical location and frequent inaccessibility of the in-vivo tissue, the presence of additional biological components not present in tissue phantoms or ex-vivo samples such as blood, fluid from saline washings, cauterized or scar tissue, and finally, the new logistics of incorporating new hardware and technology into clinical protocols and settings. Tissue validation studies are typically compared with light microscopy of histological sections, the medical gold standard. Histological evaluation itself has a degree of uncertainty, however, since pathological diagnoses suffer from sampling variability and interobserver variability.159 For example, if a pathologist is uncertain as to the grade of dysplasia present in a sample, he or she may obtain a second or third opinion to provide a consensus diagnosis. This type of analysis is highly dependent on pathologist experience, suggesting that the diagnosis process is expert based, rather than evidence based.160 Imaging modalities, on the other hand, rely on quantitative, or evidence-based, methods to distinguish between tissue types. Additional issues also arise when tissue specimen treatment is considered. Histopathological examination typically requires that the tissue be excised, preserved in formalin, embedded in paraffin wax, thinly sliced, and stained prior to examination. It is clear that significant morphological artifacts may be induced as a result of this processing, and that the histological sections may not truly reflect the structural features in vivo. It is also recognized that a number of optically induced artifacts arise in OCT images. The high degree of correlation between OCT images and histological sections remains remarkable, considering that images from each technique are generated by the transmission of light from orthogonal directions. Still, the diagnostic usefulness of histopathology and OCT stems from the ability of each to detect deviations from established baseline image features that arise from normal morphology. These issues raise a logical question: is histology the most appropriate standard to which OCT imaging should be compared? In the case of structural OCT, histopathology is likely the most appropriate method for evaluation of morphological features, despite these issues. However, as OCT incorporates molecular sensitivity and functional imaging, this may no longer hold true. Ultimately, one means by which to bypass the discrepancies between in-vivo imaging and histopathologic evaluation is to employ evidence-based medical outcome investigations such as randomized clinical trials, which further validate the use of OCT in clinical and surgical practice. Imaging techniques are primarily developed for their diagnostic capabilities. There are four stages of technology validation for assessment of the utility of a diagnostic test.161, 162, 163 In the first stage, test results are assessed for their ability to show differences between patients with and without a specific disease or disorder. Stage two studies aim to ensure that all patients with the disease yield abnormal test results, while stage three studies evaluate test results for the ability to differentiate between patients with and without the disorder. Finally, the fourth stage assesses the effect of early treatment on patients who were diagnosed using the test. This validation process requires the incorporation of animal and human tissues into the research environment. 3.2.Animal and Human StudiesIn the United States, studies involving the use of animal or human tissue require compliance with federal and state laws that regulate the humane use of animals and the rights of human subjects. At most institutions, two oversight committees exist: the Institutional Animal Care and Use Committee (IACUC) and the Institutional Review Board (IRB). These committees review and approve all research studies involving the use of animals and human subjects, respectively, prior to initiation. The use of research animals in the U.S. is primarily regulated under the Animal Welfare Act164 and the Health Research Extension Act,165 which specifies IACUC committee membership requirements that strive to represent the interests of researchers, animals, and the community at large. IACUC protocols address issues such as the study rationale, the justification of animal use, and the number of animals to be used. The protocol evaluation time frame varies by institution, but often takes on the order of , requiring that protocols be developed well in advance of the intended start of research. Many institutions also have an enforcement arm that is responsible for maintaining the well being of research animals by providing animal care services and performing inspections of protocol compliance. Finally, individual funding agencies often have separate requirements and guidelines regarding the proper use of research animals.165 Studies involving human subjects face similar regulations. The primary responsibility of an IRB is to protect the rights of participating human subjects by regulating patient consent procedures and the protection of personal information. Informed consent protocols require that, only after potential study subjects are fully informed and fully understand the research study, can they voluntarily consent to participation. Proper informed consent includes information on investigators, a layman’s explanation of the research, and a clear description of the proposed procedures. Additionally, the potential personal and societal risks and benefits of the research must be presented. The personal health information of enrolled patients must also be protected, a process that can be complex when attempting to correlate research results with clinical test results. Investigators often require access to diagnostic information regarding disease state and, in the case of OCT, direct correlation between OCT images and histological sections from the imaged area are typically necessary for validation. Medical records and privacy are protected under the Health Insurance Portability and Accountability Act166 that preserves patient confidentiality by requiring the use of code sets or keys to deidentify medical information that is made available to researchers. Records to be released under these provisions must be detailed in the informed consent document. IRB membership and protocols are subject to U.S. federal regulation. Protocols may be classified as exempt research, expedited review research, or full board review research based on the nature and location of the research. Most optical imaging research studies undergo expedited review by IRB members due to the minimal risks involved, especially in the case of ex-vivo studies. Minimally invasive OCT protocols, such as intravascular or gastrointestinal tract studies, are likely to undergo full review by the entire board. With the exception of exempt research, continuing reviews are conducted every to evaluate the progress of the research study, the impact of adverse events, any protocol changes, and any changes in the risks/benefits balance. Safety protocols and training are also required for those handling biohazardous materials from animal or human subjects. In addition to institutional human subject training, the U.S. National Institutes of Health (NIH) offer web-based training modules. This training generally covers regulation history and justification, in addition to presenting information on unethical human research and informed consent. 3.3.Clinical System DesignOnce the fundamental technology has been tested or proven in a laboratory setting during translation Step 0, imaging instrument hardware and software must be adapted for compatibility with the clinical setting in which it will be used. Many issues must be taken into account, including the size, stability, and ease of use of the instrument, the acquisition and processing speeds of the system, and the accessibility and sterility of any probes that may be in close proximity to or come in contact with tissue. In addition, instrument and data standardization is critical to aiding physicians and researchers in system operation and image evaluation. As OCT continues to be developed for new applications, standardization among investigators and across locations would be of significant benefit to the community. Since OCT can be implemented in a fiber-based system, construction of the optical components of a portable OCT system is rather straightforward. Recent advances in compact light sources and detectors have allowed the footprint of such a system to shrink significantly, an important factor to consider, since many clinical settings have minimal available space. Issues of stability and ease of use are also of critical importance when an OCT system is to be used in demanding environments that require the system to be operational within minutes of being initialized. In this case, the optical system must maintain its optical alignment, or be rapidly realigned, following frequent movements within the hospital environment. Recent advances in OCT detection schemes have enabled axial-scan acquisition speeds on the order of hundreds of kilohertz. This capability necessitates the implementation of high-speed data processing hardware and software that are capable of incorporating new computational algorithms that compensate for dispersion and beam focusing aberrations. These requirements can be met by using digital signal processing units, multiple processors, or parallel computing schemes. The sample arm of an OCT system can range from a handheld scanning probe to a fiber-based probe used in a catheter, endoscope, or biopsy needle. In surgical applications, probes used outside of the sterile surgical field may be easily sterilized with a bleach solution and disinfected after contact with biological materials. To alleviate the need for repeated sterilization and also as an economic incentive, probes can be made as single-use disposable medical devices, given the relatively low cost associated with the optical components. Fiber-based probes, for instance, are often constructed so that the optical components do not come in direct contact with the tissue but are protected by a transparent sheath, or a metal sheath with a clear window for the imaging beam. Handheld probes with sufficiently long working distances can also be easily protected by covering them with disposable sterile plastic wraps. While these methods are sufficient for ex-vivo use, in-vivo applications have more rigorous requirements. Sterile plastic covers may still be used for handheld probes, but fiber-based probes must either be disposable after a single use or be able to withstand sterilization in an autoclave, a device that exposes materials to high temperature steam. Clinical data can be expected to vary across patients, tissue specimens, diagnoses, and imaging systems. System standardization and calibration procedures can reduce system-induced effects. For example, measuring the system’s signal-to-noise ratio or imaging a standard tissue phantom prior to an imaging session can be useful for system alignment and the comparison of image quality over time. Other forms of variability, such as specimen or patient health and state of disease, may be overcome by recruiting a sufficient number of study participants to achieve appropriate statistical power. Software standardization is also a significant issue, since many research teams develop unique software to control systems, acquire data, and analyze images.167 No standard image or visualization formats currently exist in the OCT research community. Data standardization would bring benefits in data interpretation from multiple sites and make algorithm development and data analysis easier to apply retroactively. An equally important issue is the definition of the role that OCT data will play in the clinical applications of interest. For example, if OCT will compliment that of another imaging modality, one must consider the means by which OCT results will be merged with existing acquisition techniques, data storage systems, and visualization methods. Efforts are underway by the NIH and industry groups to establish a standard for optical imaging technologies.167 Development of an open source platform is also underway, potentially allowing modalities to become “plug-ins,” potentially providing standardization and reduced software development requirement on the part of individual investigators. Medical instruments typically must undergo testing prior to hospital use to ensure that operation will not interfere with the clinical environment. For example, electromagnetic interference with other equipment must be ruled out, electrical power quality requirements must be insured, and laser radiation must be kept at safe levels. The latter issue is of little concern for clinical OCT systems that expose the sample to less than a few milliwatts of power, most often falling well under the laser radiation maximum permissible exposure limits set forth under ANSI laser safety standards for skin and soft-tissue exposure.168 Attenuation of the incident power is frequently needed to meet the safety requirements for ophthalmic OCT imaging. Future issues to be addressed include the incorporation of OCT results into medical records and assignment of clinical responsibility for the acquisition and interpretation of the OCT results within the medical team. Increased data acquisition rates generate very large OCT datasets that must be properly stored and analyzed. It is also evident that new approaches for computer-based detection algorithms will become important as the acquired data volume exceeds the ability of users to extract diagnostically useful information in relatively short periods of time. 3.4.Clinical Trials and CommercializationRandomized clinical trials form the basis of evidence-based medicine and are conducted in four phases. In phase 1 trials, the technology is applied to a small group of individuals to evaluate its safety and to identify any potential issues or side effects. Phase 2 trials are expanded to a larger group of patients, further testing the effectiveness and safety of the technology. Phase 3 trials are traditionally multicenter studies and are carried out to confirm the effectiveness of the new technology, compare it to other commonly used diagnostic methods, and collect any information on anomalies or adverse effects that may occur as side effects. Phase 4 trials are almost always carried out by the private sector in an effort to determine the risks, benefits, and optimal uses of the technology. In the late stages of development and in clinical trials, private sector individuals with specializations in biomedical imaging technologies are often introduced for guidance and funding. Corporate partners frequently prefer to pursue technologies with established manufacturing processes that are easily scalable and transferable, rather than investing in fundamental research and development. Major medical companies also primarily focus investments on technologies with demonstrated clinical success and strong market potential. Before a technology can be fertile for commercialization, it must be tied to a specific procedure rather than simply a clinical field of application. The tight restrictions surrounding device approval as part of the standard of care require that the approved uses be well developed and validated. Only successful clinical trials will yield clinical adoption of new technologies and, in the U.S., the necessary premarket approval by the FDA. Currently, the burden of clinical trial costs is shared by the academic community and the private sector. There are currently no reimbursements available from the U.S. Centers for Medicare and Medicaid Services (CMS) for technology evaluation, as physician reimbursement rates have not kept up with rising medical costs and are expected to decline in the near future. Reimbursements made for clinical imaging trials would most likely take away from funds allocated to other diagnostic or screening procedures. Standardization of optical imaging validation processes may assist the community in gaining FDA approval and potential CMS reimbursement.169 3.5.Barriers to TranslationThe barriers of translation156 can be separated into cultural and logistical challenges. Cultural challenges arise due to differences in communication and career expectations. The clinical language of medicine is often not intuitive to the scientists and engineers focused on basic research. The opposite is also true as scientists and engineers find it difficult to explain their research to physicians. Additional cultural barriers exist between the academic professional community (medical, basic science, or technology research) and the more clinical (nonresearch) medical professionals. For example, scientists are often focused on the discovery and development of new technologies, while physicians are focused on how to best treat patients or help introduce new techniques to benefit patients. Institutional expectations for career development also tend to be quite different, often leading to mismatches in research translation goals and focus. There is clearly a role for physician-scientists or physician-engineers to break down these cultural barriers, as these individuals have been trained for the specific purpose of translating the basic science or technology research into the clinic, helping to bridge the gap between these communities. The remaining barriers are logistical in nature. First, geographic limitations may create barriers to collaboration. The research campuses where biomedical optics research is conducted are often located far from the medical campuses or the institutions where patient care is delivered. The difficulties presented by this scenario may be overcome by creating physical space at both locations where visitors can be embedded, potentially opening new lines of communication and collaboration. Institutions with medical and university campuses located within close proximity of one another, however, have a distinct advantage when pursuing technology translation. The legal implications of collaborations occurring across multiple institutions can be complex. In the U.S., the Bayh-Dole Act gives universities intellectual property control over federally funded research. Though the effects of this legislation are widely debated, it may potentially act to impede the flow of scientific discovery by pressuring institutions to devote resources to the development and commercialization of intellectual property. By increasing the involvement of the private sector in clinical trials, however, technology development barriers may also be reduced as funding is potentially increased. Operational and navigational barriers also exist. The introduction of a new medical imaging technology increases the need for trained users of a nonstandard technology, for robust and reliable instrumentation, for interpreters of nonstandard data, for duplication of the technology, and for the establishment of standard operating procedures. Finally, a wealth of specialized knowledge is needed to navigate through the complex landscape of study design, federal regulations, oversight committees, patient recruitment and consent, outcome measures, legal implications, and commercialization requirements. Many of these challenges can be overcome through the involvement of all stakeholders in the development and translation of a technology. This cooperation will open lines of communication between the various parties and thereby speed translation, especially in the early phases of technology development. Feedback about upcoming or potential issues can be obtained early in the translation process, assisting scientists and engineers as they maneuver through the process. The establishment of physical and interpersonal infrastructures may assist researchers to navigate the complicated technology translation landscape. Mentorship networks and physical infrastructure may be developed for patient recruitment, team member communication, data analysis, data sharing, and regulation compliance. Other proposals have called for increased funding for the standardization, duplication, and validation processes. Finally, networks and teams of independent investigators often form in the medical research field to advance a field of research. Research teams often consist of an independent investigator with expertise in biomedical optics and basic science, as well as physicians with expertise in the pathogenesis and systemic effects of the disease being investigated. With a research team that carries expertise in multiple arenas, some translation barriers can be avoided and research can often advance at a quicker pace. Such an interdisciplinary team allows members to train each other on technology issues, including the advantages and limitations of the technology, on disease pathophysiology, local and systemic disease effects, diagnoses, and treatments. Interdisciplinary teams such as these have been established and supported through the Network for Translational Research in Optical Imaging (NTROI) and through other NIH centers that bring together physicians and biomedical optics investigators. 4.Bench Work Poised for Clinical Translation4.1.Molecular ImagingThe clinical utility of OCT would be greatly enhanced if it provided contrast to specific biomolecules. This capability, known as molecular imaging, has become a major emphasis in many areas of biomedical imaging.170 Molecular imaging strategies can be divided into two broad classes: using exogenous contrast agents that are introduced into the body, which bind specifically to the biomolecules of interest (molecular contrast imaging); or direct imaging of the endogenous biomolecules (endogenous molecular imaging). The ability to design contrast agents for use with a variety of optical techniques makes molecular contrast imaging extremely attractive in spite of difficulties such as contrast agent toxicity, in-vivo agent transport and clearance, and specificity to the molecular target. In comparison, direct endogenous molecular imaging is not complicated by the introduction of outside agents, but is limited to the spectroscopic data obtained by directly querying the molecule. 4.1.1.Contrast agentsContrast agents currently under development for OCT span a range of sizes and include single-molecule dyes, nanoparticles, and microspheres.171 While many of these experimental agents are not yet approved for human use, most incorporate established nontoxic materials, such as gold or iron oxide. Although traditional fluorescent and bioluminescent probes do not emit coherent light, and thus provide no contrast with OCT, other agents that exhibit large optical scattering or absorption cross sections can be used to provide positive or negative contrast enhancement, respectively. Similar to ultrasound contrast agents,172 submicron particles and microspheres are typically introduced into the blood pool or lymphatic system, where they remain until cleared via the reticuloendothelial system. Because arterial OCT imaging is well established,63 targets of particular interest include inflammation (e.g., via phagocytosis by active macrophages) and angiogenesis (e.g., targeted via the integrin receptor) for identifying disease sites such as atherosclerotic plaques.173 Liquid-core protein microspheres have been modified for OCT imaging by incorporating gold, carbon, and melanin nanoparticles into their shells to increase optical scattering.88 These provide positive contrast in OCT and have been demonstrated in a mouse liver after injection in the tail vein.88 In a related study, an RGD tripeptide was attached to the surface of protein microspheres via electrostatic layer-by-layer adhesion, and specificity to human colon tumor cells was demonstrated in vitro.174 Another promising class of contrast agents includes silica-core gold-shelled particles, known as nanoshells, which exploit the surface-plasmon resonance property of gold.175 Nanoshells in diameter exhibit large backscattering efficiencies, which provide significant OCT contrast in tissue phantoms at concentrations near .176 Smaller nanoparticles and molecules have increased capacity to extravasate and thereby access tissue targets outside of the vasculature.177 Fundamentally, the OCT attenuation due to these smaller contrast agents is dominated by absorption, not scattering. This is beneficial for photothermal therapy, where heat generated by light absorption kills targeted cells using light intensities significantly greater than those used for OCT imaging. This concept was demonstrated using nanoshells having an optical absorption peak at . The nanoshells have been targeted to human breast cancer cells in vitro using an anti-HER2 antibody, and have also been shown to decrease tumor load in mice in vivo.178 Other types of gold plasmon-resonant structures have been investigated for imaging and therapy. Nanocages, which consist of hollowed-out gold cubes, have been detected in tissue phantoms at concentrations using OCT, and have also been coated with anti-HER2 antibodies for targeted imaging in vitro.179 Nanorods of gold ( in size) also provide absorption-based OCT contrast, and have been detected in 2% intralipid tissue phantoms at using an albedo-based detection algorithm.180 Gold nanorods have also been used in photothermal therapy applications, and have been targeted to malignant cell lines using anti-EGFR antibodies.181 4.1.2.Spectroscopic contrastSpectroscopic OCT signal analysis was first demonstrated for detection of optical absorption by melanin in an African frog tadpole,182 and more recently has been applied to the assessment of blood oxygen saturation.183 It is also possible to use endogenous spectroscopic OCT signals to determine the size and density of scatterers using Mie theory.184 One promising application is nuclear size measurement for the detection of dysplastic changes in the esophagus, as demonstrated using angle-resolved low-coherence interferometry, a related technique.133 Also, spectroscopic contrast and associated algorithms are required to augment traditional OCT scatterer sizing methods that are affected by multiple scatterers and variations in their size and density.185 To this end, the spectroscopic OCT scattering and absorption signals, which are inherently coupled, may be separated using least-squares computational methods.186 Spectroscopic OCT has also been extensively explored for molecular imaging using contrast agents with well-characterized absorption or scattering signatures. Near-infrared dyes, including the FDA-approved agent indocyanine green,95 have been used to provide absorption in specific spectral regions of interest.93 A related principle is utilized for the detection of plasmon-resonant nanoparticles, which have a tunable absorption band that is ideally designed to absorb in a spectral region that is off-center with respect to the incident light.187 This principle could potentially be used to track photodynamic therapy dyes during treatment, a concept that was recently demonstrated in tissue phantoms.188 4.1.3.Magnetomotive agentsMagnetic iron oxide nanoparticles are used as magnetic resonance imaging (MRI) contrast agents in humans, and are clinically useful for the detection of metastatic lymph nodes.189 These nanoparticles may also be detected optically with high spatial resolution by perturbing them with an externally applied magnetic field gradient. The resulting nanometer-scale displacements (magnetomotion) give rise to light scattering changes observable with OCT (Fig. 9 ).90 Magnetomotive OCT benefits from background rejection that is possible because of the correlation between scattering changes and field excitation. These techniques have been used to differentiate magnetically labeled from nonlabeled cells within 3-D scaffolds,90 and to detect nanoparticles inside a living Xenopus laevis African frog tadpole190 using a magnetic field modulated at . Because smaller imaging volumes are used in OCT than in MRI, the electromagnets are more compact and portable. Erythrocyte magnetomotion has also been detected in extracted blood using Doppler analysis of OCT signals, yielding a potential application to blood flow imaging.191 Fig. 9Magnetomotive OCT images of freshly excised carcinogen-induced rat mammary tumor. Red displays the standard OCT image and green indicates magnetomotion. The left image is of control tumor tissue without nanoparticles. The right image is of tumor after injection with iron-oxide nanoparticles. Nanoparticles courtesy of Wuang and Pack (University of Illinois at Urbana-Champaign), images by Oldenburg and Boppart. 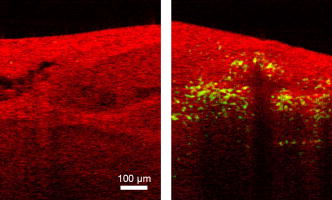 The ability to label magnetic iron oxide agents with antibodies or proteins to target diseased cells is an active area of interest.192 Passive uptake models are also promising for targeting disease, such as exclusion by lymph node metastases189 and endocytosis by macrophages in atherosclerotic plaques.193 Coupling whole-body MRI or ultrasound imaging194 with high-resolution magnetomotive OCT may become a powerful new tool for drug development for molecular imaging of nanoparticle uptake. Magnetic iron oxides also have potential therapeutic applications using hyperthermic therapy techniques, where magnetic fields are modulated at high frequencies to induce local heating.195 4.1.4.Pump probe and RamanMolecular specificity may also be achieved using multiple light pulses or spectral wavelengths to probe the electronic or vibrational states of specific molecules. Coupling these techniques with interferometric imaging further increases the signal-to-noise ratio of such imaging. In pump-probe OCT, a pump pulse tuned to an electronic transition places a molecule into an excited state. A probe pulse monitors either the population transferred into the excited state, or its transient relaxation to an intermediate or ground state, which can be accomplished by several different methods.196 In one study, the transient absorption of methylene blue dye was imaged using differential measurement of the OCT signal.91 In another, the plant protein phytochrome A, which exhibits a switchable absorption maximum, was imaged using a two-color pump-probe method.94 A technique not requiring two colors (and thus two light sources) has been implemented by monitoring ground-state recovery with a probe at the same wavelength as the pump.197 Using this method, chromophores have been imaged within zebra fish, and differentiation of multiple chromophores such as hemoglobin and dyes has been demonstrated.197 Another promising technique for imaging endogenous molecules is coherent anti-Stokes Raman scattering (CARS). This is a four-wave mixing technique where three incident photons (two pump and one probe) mix to produce a fourth anti-Stokes photon. The anti-Stokes response is resonant if the pump/probe energy difference is equal to the vibrational energy level spacing. Thus, CARS measures molecules based on their vibrational bands, providing vibrational contrast in microscopy experiments.198 Because CARS is a coherent process, it can be used for interferometric depth-resolved imaging, a technique known as nonlinear interferometric vibrational imaging (NIVI).89 An important benefit of interferometric CARS is the ability to separate resonant and nonresonant signals, resulting in high molecular specificity.199, 200 To date, specificity to C-H vibrations in lipids has been demonstrated using in-vitro cell models201 and in thicker constructs such as lipid-rich tissues.86 Although significant development will be necessary prior to translation of these techniques into the clinic, they exhibit great promise for noninvasive, endogenous molecular imaging. 4.2.Computational TechniquesOngoing improvements to the instrumentation and signal processing used for OCT imaging continue to enhance acquisition speed and image fidelity. To maximize clinical utility, OCT instruments will need to provide real-time 202, 203, 204, 205, 206, 207, 208, 209, 210, 211, 212, 213 imagery of 2-D slices and 3-D volumes. SD-OCT214, 215, 216, 217, 218, 219 has greatly increased the quality and acquisition speed of OCT images by increasing the signal-to-noise ratio220, 221, 222 of acquired data. Swept-source imaging223, 224, 225, 226, 227 greatly simplifies OCT instrumentation by scanning the wavelength of a rapidly tunable laser rather than using a broadband source such as a mode-locked laser or superluminescent diode. Recent advances such as Fourier-domain mode locking228, 229 are able to scan the wavelength hundreds of thousands of times per second, potentially providing video-rate imaging of 3-D volumes. A new method to scan the wavelength millions of times per second230 has been demonstrated by sweeping the wavelength of every pulse produced by a supercontinuum laser source. With sufficient source power, this technique has the potential to sample billions of volume elements per second. Such rapid data acquisition will require very fast signal processing to compute images from the data. Digital signal processing (DSP) has been incorporated into some OCT instrumentation to provide this capability.231, 232, 233, 234 Although analog electronics can be used for envelope detection to display structural images, Doppler OCT, one of the most important DSP applications in early OCT imaging,235, 236, 237 requires phase-resolved imaging to capture flow-dependent time-varying phase data. With the advent of SD and SS-OCT, methods that require Fourier data analysis, DSP has become essential to modern OCT imaging. The well-demonstrated advantages of these methods over time-domain OCT will likely result in universal adoption of DSP techniques in OCT instruments. Finally, DSP-enabled 3-D computer graphics visualization238, 239, 240, 241, 242 can be employed to allow dynamic visualization of tissues along arbitrary surfaces and planes, not just those that are biopsied and sectioned. Computed imaging methods similar to those employed in x-ray computed tomography and magnetic resonance imaging are being increasingly employed for OCT to overcome OCT instrument limitations. As in conventional microscopy, OCT systems typically use objective lenses to focus light at a fixed depth in the tissue, causing features outside the focal volume to be poorly resolved. However, unlike traditional microscopy, OCT measures phase-resolved signals that can be used243 to computationally image the out-of-focus features. This technique, called Interferometric Synthetic Aperture Microscopy244 (ISAM), allows the out-of-focus features to be inferred from the phase information without scanning the focus. It can be implemented for both low and high245 numerical aperture OCT imaging, rotationally scanned catheters used for endoscopy,246 and full-field illumination microscopes.247 4.3.Source DevelopmentThe performance of OCT systems has been dramatically improved over the last decade by technological light source advances, and future enhancements in acquisition speed and imaging resolution are on the horizon. The axial resolution in an OCT image is inversely proportional to the bandwidth of the light source, and the sensitivity is proportional to the optical power. Thus, broadband light sources with high optical power are required for OCT imaging.248 Additionally, optimal OCT imaging wavelengths are in the near-infrared spectral region at approximately , where there is minimal light absorption by biological tissues. Simple broadband sources such as tungsten or xenon lamps can be used to provide hundreds of nanometers of bandwidth, but are limited by low fluence that significantly limits the single-mode coupled power needed for interferometric imaging.249, 250 Pulsed lamp sources can, however, be used with full-field OCT systems to obtain ultrahigh resolution, real-time images.251 Other spontaneous emission sources such as semiconductor optical amplifiers (SOAs),219 superluminescent diodes,252, 253 and diode-pumped NIR gain media254, 255 are typically inexpensive and commercially available. Ultrashort pulse mode-locked lasers are also widely used for OCT imaging. The most common is the Ti:sapphire laser, centered near with bandwidths ranging from ,256, 257 with turnkey commercial sources available.258 Future sources under investigation include low-cost mode-locked Ti:sapphire lasers with lower pump power requirements,259 or lasers that can be directly diode pumped.260, 261 Because ultrashort pulses have extremely high peak powers, they cause nonlinear interactions such as self-phase modulation, thereby broadening the optical bandwidth (also known as supercontinuum generation). This is extremely convenient for enhancing the resolution of OCT systems, since supercontinua, which are typically obtained by focusing laser light into a single-mode silica fiber, can be generated in the same fiber used for beam delivery. 202, 206, 261, 262, 263, 264, 265, 266 Microstructured fibers, also known as photonic crystal fibers, are designed with anomalous dispersion characteristics that increase the interaction length of light pulses for more efficient supercontinuum generation,267 and have been used for in-vivo OCT imaging,268 producing bandwidths over and nominally tens of milliwatts of output power.269, 270, 271, 272, 273, 274 Several nonlinear processes involved in this supercontinuum generation, however, may exhibit greater noise in comparison to the self-phase modulation in silica fibers.268, 274 Fourier-domain OCT systems may also employ frequency-swept light sources,223, 225 which have sensitivity advantages over time-domain OCT systems,224, 275 and enable high-speed imaging that reduces motion artifacts during in-vivo imaging.276 Most swept-source systems are based on SOAs operating with a center wavelength near ,227, 277, 278, 279 although shorter wavelengths have recently become available.280, 281, 282 Fourier-domain mode-locking sources synchronize the wavelength sweep with the laser cavity roundtrip time, permitting exceptionally high sweep rates for real-time imaging.228, 229 5.ConclusionThis work has given an overview of the development of OCT, the current state of research and commercial development, and the future of clinical OCT imaging. The development of advanced OCT source, beam delivery, and detection technologies has driven investigations into a wide array of clinical applications in the fields of ophthalmology, cardiology, and oncology, among many others. As new technological advances are made to enhance contrast, provide molecular sensitivity, enhance image features, and speed image acquisition, new OCT applications will certainly be enabled. The future of OCT will continue to benefit from and be strengthened by the translational research of moving technology from the bench to the bedside, and back again. AcknowledgmentsWe wish to thank all of our colleagues for their contributions to this review, for advancing the OCT technology toward clinical use, and for beginning to impact the lives and healthcare of many patients. We apologize to those whose work could not be included due to length constraints. We acknowledge the dedication and contributing efforts of the members from the Biophotonics Imaging Laboratory at the Beckman Institute for Advanced Science and Technology at the University of Illinois at Urbana-Champaign, and the clinical work of our collaborators Frank Bellafiore, John Brokenbrough, Mark Faith, Patricia Johnson, Jan Kotynek, Uretz Oliphant, and Kendrith Rowland at Carle Foundation Hospital and Carle Clinic Association, Urbana, Illinois. Our research was supported in part by grants from the National Institutes of Health (Roadmap Initiative and NIBIB, 1 R21 EB005321 and 1 R01 EB005221, S.A.B.), the National Science Foundation (BES 03-47747 and BES 05-19920, S.A.B.), the Beckman Institute for Advanced Science and Technology, and Carle Foundation Hospital. The authors and supporting agencies do not endorse any specific company or product described in this review. ReferencesD. Huang,
E. A. Swanson,
C. P. Lin,
J. S. Schuman,
W. G. Stinson,
W. Chang,
M. R. Hee,
T. Flotte,
K. Gregory,
C. A. Puliafito, and
J. G. Fujimoto,
“Optical coherence tomography,”
Science, 254
(5035), 1178
–1181
(1991). https://doi.org/10.1126/science.1957169 0036-8075 Google Scholar
M. Brezinski, Optical Coherence Tomography: Principles and Applications, Academic Press, London
(2006). Google Scholar
B. E. Bouma and
G. J. Tearney, Handbook of Optical Coherence Tomography, Informa Healthcare, New York
(2001). Google Scholar
K. Takada,
I. Yokohama,
K. Chida, and
J. Noda,
“New measurement system for fault location in optical waveguide devices based on an interferometric technique,”
Appl. Opt., 26
(9), 1603
–1606
(1987). 0003-6935 Google Scholar
R. C. Youngquist,
S. Carr, and
D. E. N. Davies,
“Optical coherence-domain reflectometry: a new optical evaluation technique,”
Opt. Lett., 12
(3), 158
–160
(1987). https://doi.org/10.1038/327158a0 0146-9592 Google Scholar
A. F. Fercher,
K. Mengedoht, and
W. Werner,
“Eye-length measurement by interferometry with partially coherent light,”
Opt. Lett., 13
(3), 186
–188
(1988). 0146-9592 Google Scholar
“Carl Zeiss Meditec Announces Installation of 6,000th Stratus OCT,”
(2006) Google Scholar
M. Walz,
“Hot technologies for 2007: OCT: imaging of the future,”
R&D Mag., 6
(12),
(2006) Google Scholar
R. A. Costa,
M. Skaf,
L. A. S. Melo,
D. Calucci,
J. A. Cardillo,
J. C. Castro,
D. Huang, and
M. Wojtkowski,
“Retinal assessment using optical coherence tomography,”
Prog. Retin Eye Res., 25
(3), 325
–353
(2006). 1350-9462 Google Scholar
M. R. Dogra,
A. Gupta, and
V. Gupta, Atlas of Optical Coherence Tomography of Macular Diseases, Taylor & Francis, New York
(2004). Google Scholar
M. R. Hee,
C. A. Puliafito,
C. Wong,
J. S. Duker,
E. Reichel,
B. Rutledge,
J. S. Schuman,
E. A. Swanson, and
J. G. Fujimoto,
“Quantitative assessment of macular edema with optical coherence tomography,”
Arch. Ophthalmol. (Chicago), 113
(8), 1019
–1029
(1995). 0003-9950 Google Scholar
J. S. Schuman,
C. A. Puliafito, and
J. G. Fujimoto, Optical Coherence Tomography of Ocular Diseases, Slack, Inc., Thorofare, NJ
(2004). Google Scholar
L. Alexander and
W. Choate,
“Optical coherence tomography: rewriting the standard of care in diagnosis, management and interventional assessment,”
Rev. Optometry, 141
(9), 1CE
–8CE
(2004). Google Scholar
E. Uchino,
A. Uemura, and
N. Ohba,
“Initial stages of posterior vitreous detachment in healthy eyes of older persons evaluated by optical coherence tomography,”
Arch. Ophthalmol. (Chicago), 119
(10), 1475
–1479
(2001). 0003-9950 Google Scholar
M. Altaweel and
M. Ip,
“Macular hole: improved understanding of pathogenesis, staging, and management based on optical coherence tomography,”
Semin Ophthalmol., 18
(2), 58
–66
(2003). 0882-0538 Google Scholar
A. Gaudric,
B. Haouchine,
P. Massin,
M. Paques,
P. Blain, and
A. Erginay,
“Macular hole formation: new data provided by optical coherence tomography,”
Arch. Ophthalmol. (Chicago), 117
(6), 744
–751
(1999). 0003-9950 Google Scholar
M. R. Hee,
C. A. Puliafito,
C. Wong,
J. S. Duker,
E. Reichel,
J. S. Schuman,
E. A. Swanson, and
J. G. Fujimoto,
“Optical coherence tomography of macular holes,”
Ophthalmology, 102
(5), 748
–756
(1995). 0161-6420 Google Scholar
C. A. Puliafito,
M. R. Hee,
C. P. Lin,
E. Reichel,
J. S. Schuman,
J. S. Duker,
J. A. Izatt,
E. A. Swanson, and
J. G. Fujimoto,
“Imaging of macular diseases with optical coherence tomography,”
Ophthalmology, 102
(2), 217
–229
(1995). 0161-6420 Google Scholar
M. N. Apostolopoulos,
C. N. Koutsandrea,
M. N. Moschos,
D. A. Alonistiotis,
A. E. Papaspyrou,
J. A. Mallias,
T. E. Kyriaki,
P. G. Theodossiadis, and
G. P. Theodossiadis,
“Evaluation of successful macular hole surgery by optical coherence tomography and multifocal electroretinography,”
Am. J. Ophthalmol., 134
(5), 667
–674
(2002). https://doi.org/10.1016/S0002-9394(02)01700-2 0002-9394 Google Scholar
J. M. Jumper,
R. P. Gallemore,
B. W. McCuen, and
C. A. Toth,
“Features of macular hole closure in the early postoperative period using optical coherence tomography,”
Retina, 20
(3), 232
–237
(2000). 0275-004X Google Scholar
H. Sato,
R. Kawasaki, and
H. Yamashita,
“Observation of idiopathic full-thickness macular hole closure in early postoperative period as evaluated by optical coherence tomography,”
Am. J. Ophthalmol., 136
(1), 185
–187
(2003). https://doi.org/10.1016/S0002-9394(03)00094-1 0002-9394 Google Scholar
R. J. Antcliff,
M. R. Stanford,
D. S. Chauhan,
E. M. Graham,
D. J. Spalton,
J. S. Shilling,
T. J. ffytche, and
J. Marshall,
“Comparison between optical coherence tomography and fundus fluorescein angiography for the detection of cystoid macular edema in patients with uveitis,”
Ophthalmology, 107
(3), 593
–599
(2000). https://doi.org/10.1016/S0161-6420(99)00087-1 0161-6420 Google Scholar
M. R. Hee,
C. A. Puliafito,
J. S. Duker,
E. Reichel,
J. G. Coker,
J. R. Wilkins,
J. S. Schuman,
E. A. Swanson, and
J. G. Fujimoto,
“Topography of diabetic macular edema with optical coherence tomography,”
Ophthalmology, 105
(2), 360
–370
(1998). https://doi.org/10.1016/S0161-6420(98)93601-6 0161-6420 Google Scholar
P. Massin,
C. Allouch,
B. Haouchine,
F. Metge,
M. Paques,
L. Tangui,
A. Erginay, and
A. Gaudric,
“Optical coherence tomography of idiopathic macular epiretinal membranes before and after surgery,”
Am. J. Ophthalmol., 130
(6), 732
–739
(2000). https://doi.org/10.1016/S0002-9394(00)00574-2 0002-9394 Google Scholar
T. Otani,
S. Kishi, and
Y. Maruyama,
“Patterns of diabetic macular edema with optical coherence tomography,”
Am. J. Ophthalmol., 127
(6), 688
–693
(1999). https://doi.org/10.1016/S0002-9394(99)00033-1 0002-9394 Google Scholar
M. R. Hee,
C. R. Baumal,
C. A. Puliafito,
J. S. Duker,
E. Reichel,
J. R. Wilkins,
J. G. Coker,
J. S. Schuman,
E. A. Swanson, and
J. G. Fujimoto,
“Optical coherence tomography of age-related macular degeneration and choroidal neovascularization,”
Ophthalmology, 103
(8), 1260
–1270
(1996). 0161-6420 Google Scholar
F. A. Medeiros,
L. M. Zangwill,
C. Bowd,
R. M. Vessani,
R. Susanna, and
R. N. Weinreb,
“Evaluation of retinal nerve fiber layer, optic nerve head, and macular thickness measurements for glaucoma detection using optical coherence tomography,”
Am. J. Ophthalmol., 139
(1), 44
–55
(2005). https://doi.org/10.1016/j.ajo.2004.08.069 0002-9394 Google Scholar
M. Mujat,
R. C. Chan,
B. Cense,
B. H. Park,
C. Joo,
T. Akkin,
T. C. Chen, and
J. F. de Boer,
“Retinal nerve fiber layer thickness map determined from optical coherence tomography images,”
Opt. Express, 13
(23), 9480
–9491
(2005). https://doi.org/10.1364/OPEX.13.009480 1094-4087 Google Scholar
E. Z. Blumenthal,
J. M. Williams,
R. N. Weinreb,
C. A. Girkin,
C. C. Berry, and
L. M. Zangwill,
“Reproducibility of nerve fiber layer thickness measurements by use of optical coherence tomography,”
Ophthalmology, 107
(12), 2278
–2282
(2000). https://doi.org/10.1016/S0161-6420(00)00341-9 0161-6420 Google Scholar
D. L. Budenz,
R. T. Chang,
X. Huang,
R. W. Knighton, and
J. M. Tielsch,
“Reproducibility of retinal nerve fiber thickness measurements using the Stratus OCT in normal and glaucomatous eyes,”
Invest. Ophthalmol. Visual Sci., 46
(7), 2440
–2443
(2005). https://doi.org/10.1167/iovs.04-1174 0146-0404 Google Scholar
P. Carpineto,
M. Ciancaglini,
E. Zuppardi,
G. Falconio,
E. Doronzo, and
L. Mastropasqua,
“Reliability of nerve fiber layer thickness measurements using optical coherence tomography in normal and glaucomatous eyes,”
Ophthalmology, 110
(1), 190
–195
(2003). https://doi.org/10.1016/S0161-6420(02)01296-4 0161-6420 Google Scholar
L. A. Paunescu,
J. S. Schuman,
L. L. Price,
P. C. Stark,
S. Beaton,
H. Ishikawa,
G. Wollstein, and
J. G. Fujimoto,
“Reproducibility of nerve fiber thickness, macular thickness, and optic nerve head measurements using StratusOCT,”
Invest. Ophthalmol. Visual Sci., 45
(6), 1716
–1724
(2004). https://doi.org/10.1167/iovs.03-0514 0146-0404 Google Scholar
G. Wollstein,
J. S. Schuman,
L. L. Price,
A. Aydin,
P. C. Stark,
E. Hertzmark,
E. Lai,
H. Ishikawa,
C. Mattox,
J. G. Fujimoto, and
L. A. Paunescu,
“Optical coherence tomography longitudinal evaluation of retinal nerve fiber layer thickness in glaucoma,”
Arch. Ophthalmol. (Chicago), 123
(4), 464
–470
(2005). https://doi.org/10.1001/archopht.123.4.464 0003-9950 Google Scholar
C. K. S. Leung,
W. H. Yung,
A. C. K. Ng,
J. Woo,
M. K. Tsang, and
K. K. Tse,
“Evaluation of scanning resolution on retinal nerve fiber layer measurement using optical coherence tomography in normal and glaucomatous eyes,”
J. Glaucoma, 13
(6), 479
–485
(2004). 1057-0829 Google Scholar
J. S. Schuman,
M. R. Hee,
C. A. Puliafito,
C. Wong,
T. Pedut-Kloizman,
C. P. Lin,
E. Hertzmark,
J. A. Izatt,
E. A. Swanson, and
J. G. Fujimoto,
“Quantification of nerve fiber layer thickness in normal and glaucomatous eyes using optical coherence tomography: A pilot study,”
Arch. Ophthalmol. (Chicago), 113
(5), 586
–596
(1995). 0003-9950 Google Scholar
C. A. Sánchez-Galeana,
C. Bowd,
L. M. Zangwill,
P. A. Sample, and
R. N. Weinreb,
“Short-wavelength automated perimetry results are correlated with optical coherence tomography retinal nerve fiber layer thickness measurements in glaucomatous eyes,”
Ophthalmology, 111
(10), 1866
–1872
(2004). https://doi.org/10.1016/j.ophtha.2004.04.017 0161-6420 Google Scholar
D. Thomas and
G. Duguid,
“Optical coherence tomography—a review of the principles and contemporary uses in retinal investigation,”
Eye, 18
(6), 561
–570
(2004). https://doi.org/10.1038/sj.eye.6700729 0950-222X Google Scholar
M. Pircher,
E. Götzinger,
R. Leitgeb,
A. F. Fercher, and
C. K. Hitzenberger,
“Measurement and imaging of water concentration in human cornea with differential absorption optical coherence tomography,”
Opt. Express, 11
(18), 2190
–2197
(2003). 1094-4087 Google Scholar
R. A. Costa,
L. Scapucin,
N. S. Moraes,
D. Calucci,
L. A. Melo,
J. A. Cardillo, and
M. E. Farah,
“Indocyanine green-mediated photothrombosis as a new technique of treatment for persistent central serous chorioretinopathy,”
Curr. Eye Res., 25
(5), 287
–297
(2002). https://doi.org/10.1076/ceyr.25.5.287.13496 0271-3683 Google Scholar
P. A. Campochiaro,
“Reduction of diabetic macular edema by oral administration of the kinase inhibitor PKC412,”
Invest. Ophthalmol. Visual Sci., 45
(3), 922
–931
(2004). https://doi.org/10.1167/iovs.03-0955 0146-0404 Google Scholar
S. Michels,
P. J. Rosenfeld,
C. A. Puliafito,
E. N. Marcus, and
A. S. Venkatraman,
“Systemic bevacizumab (avastin) therapy for neovascular age-related macular degeneration: Twelve-week results of an uncontrolled open-label clinical study,”
Ophthalmology, 112
(6), 1035
–1047
(2005). https://doi.org/10.1016/j.ophtha.2005.02.007 0161-6420 Google Scholar
J. A. Cardillo,
L. A. S. Melo,
R. A. Costa,
M. Skaf,
R. Belfort,
A. A. Souza-Filho,
M. E. Farah, and
B. D. Kuppermann,
“Comparison of intravitreal versus posterior sub-tenon’s capsule injection of triamcinolone acetonide for diffuse diabetic macular edema,”
Ophthalmology, 112
(9), 1557
–1563
(2005). https://doi.org/10.1016/j.ophtha.2005.03.023 0161-6420 Google Scholar
M. A. Bonini-Filho,
R. Jorge,
J. C. Barbosa,
D. Calucci,
J. A. Cardillo, and
R. A. Costa,
“Intravitreal injection versus sub-tenon’s infusion of triamcinolone acetonide for refractory diabetic macular edema: A randomized clinical trial,”
Invest. Ophthalmol. Visual Sci., 46
(10), 3845
–3849
(2005). https://doi.org/10.1167/iovs.05-0297 0146-0404 Google Scholar
N. Eter, and
R. F. Spaide,
“Comparison of fluorescein angiography and optical coherence tomography for patients with choroidal neovascularization after photodynamic therapy,”
Retina, 25
(6), 691
–696
(2005). 0275-004X Google Scholar
A. Salinas-Alamán,
A. García-Layana,
M. J. Maldonado,
C. Sainz-Gómez, and
A. Alvárez-Vidal,
“Using optical coherence tomography to monitor photodynamic therapy in age related macular degeneration,”
Am. J. Ophthalmol., 140
(1), 23
–28
(2005). 0002-9394 Google Scholar
J. Sahni,
P. Stanga,
D. Wong, and
S. Harding,
“Optical coherence tomography in photodynamic therapy for subfoveal choroidal neovascularisation secondary to age related macular degeneration: a cross sectional study,”
Br. J. Ophthamol., 89
(3), 316
–320
(2005). https://doi.org/10.1136/bjo.2004.043364 0007-1161 Google Scholar
C. K. Hitzenberger,
P. Trost,
P. W. Lo, and
Q. Zhou,
“Three-dimensional imaging of the human retina by high-speed optical coherence tomography,”
Opt. Express, 11
(21), 2753
–2761
(2003). 1094-4087 Google Scholar
M. Pircher,
E. Götzinger,
O. Findl,
S. Michels,
W. Geitzenauer,
C. Leydolt,
U. Schmidt-Erfurth, and
C. K. Hitzenberger,
“Human macula investigated in vivo with polarization-sensitive optical coherence tomography,”
Invest. Ophthalmol. Visual Sci., 47
(12), 5487
–5495
(2006). https://doi.org/10.1167/iovs.05-1589 0146-0404 Google Scholar
E. Götzinger,
M. Pircher,
M. Sticker,
A. F. Fercher, and
C. K. Hitzenberger,
“Measurement and imaging of birefringent properties of the human cornea with phase-resolved, polarization-sensitive optical coherence tomography,”
J. Biomed. Opt., 9
(1), 94
–102
(2004). https://doi.org/10.1117/1.1629308 1083-3668 Google Scholar
Y. Zhang,
J. Rha,
R. S. Jonnal, and
D. T. Miller,
“Adaptive optics parallel spectral domain optical coherence tomography for imaging the living retina,”
Opt. Express, 13
(12), 4792
–4811
(2005). https://doi.org/10.1364/OPEX.13.004792 1094-4087 Google Scholar
R. J. Zawadzki,
S. M. Jones,
S. S. Olivier,
M. Zhao,
B. A. Bower,
J. A. Izatt,
S. Choi,
S. Laut, and
J. S. Werner,
“Adaptive-optics optical coherence tomography for high-resolution and high-speed 3D retinal in vivo imaging,”
Opt. Express, 13
(21), 8532
–8546
(2005). https://doi.org/10.1364/OPEX.13.008532 1094-4087 Google Scholar
K. Bizheva,
R. Pflug,
B. Hermann,
B. Považay,
H. Sattmann,
P. Qiu,
E. Anger,
H. Reitsamer,
S. Popov,
J. R. Taylor,
A. Unterhuber,
P. Ahnelt, and
W. Drexler,
“Optophysiology: Depth-resolved probing of retinal physiology with functional ultrahigh-resolution optical coherence tomography,”
Proc. Natl. Acad. Sci. U.S.A., 103
(13), 5066
–5071
(2006). https://doi.org/10.1073/pnas.0506997103 0027-8424 Google Scholar
B. E. Bouma and
G. J. Tearney,
“Clinical imaging with optical coherence tomography,”
Acad. Radiol., 9
(8), 942
–953
(2002). 1076-6332 Google Scholar
B. E. Bouma,
G. J. Tearney,
H. Yabushita,
M. Shishkov,
C. R. Kauffman,
D. DeJoseph Gauthier,
B. D. MacNeill,
S. L. Houser,
H. T. Aretz,
E. F. Halpern, and
I. K. Jang,
“Evaluation of intracoronary stenting by intravascular optical coherence tomography,”
Heart, 89
(3), 317
–320
(2003). 1355-6037 Google Scholar
M. E. Brezinski,
G. J. Tearney,
B. E. Bouma,
J. A. Izatt,
M. R. Hee,
E. A. Swanson,
J. F. Southern, and
J. G. Fujimoto,
“Optical coherence tomography for optical biopsy: Properties and demonstration of vascular pathology,”
Circulation, 93
(6), 1206
–1213
(1996). 0009-7322 Google Scholar
M. E. Brezinski,
G. J. Tearney,
B. E. Bouma,
S. A. Boppart,
M. R. Hee,
E. A. Swanson,
J. F. Southern, and
J. G. Fujimoto,
“Imaging of coronary artery microstructure (in vitro) with optical coherence tomography,”
Am. J. Cardiol., 77
(1), 92
–93
(1996). https://doi.org/10.1016/S0002-9149(97)89143-6 0002-9149 Google Scholar
M. E. Brezinski,
G. J. Tearney,
N. J. Weissman,
S. A. Boppart,
B. E. Bouma,
M. R. Hee,
A. E. Weyman,
E. A. Swanson,
J. F. Southern, and
J. G. Fujimoto,
“Assessing atherosclerotic plaque morphology: comparison of optical coherence tomography and high frequency intravascular ultrasound,”
Heart, 77
(5), 397
–403
(1997). 1355-6037 Google Scholar
A. H. Chau,
R. C. Chan,
M. Shishkov,
B. MacNeill,
N. Iftimia,
G. J. Tearney,
R. D. Kamm,
B. E. Bouma, and
M. R. Kaazempur-Mofrad,
“Mechanical analysis of atherosclerotic plaques based on optical coherence tomography,”
Ann. Biomed. Eng., 32
(11), 1494
–1503
(2004). https://doi.org/10.1114/B:ABME.0000049034.75368.4a 0090-6964 Google Scholar
J. G. Fujimoto,
S. A. Boppart,
G. J. Tearney,
B. E. Bouma,
C. Pitris, and
M. E. Brezinski,
“High resolution in vivo intra-arterial imaging with optical coherence tomography,”
Heart, 82
(2), 128
–133
(1999). 1355-6037 Google Scholar
M. Gupta,
A. M. Rollins,
J. A. Izatt, and
I. R. Efimov,
“Imaging of the atrioventricular node using optical coherence tomography,”
J. Cardiovasc. Electrophysiol., 13
(1), 95
(2002). https://doi.org/10.1046/j.1540-8167.2002.00095.x 1045-3873 Google Scholar
I. K. Jang,
G. Tearney, and
B. Bouma,
“Visualization of tissue prolapse between coronary stent struts by optical coherence tomography: Comparison with intravascular ultrasound,”
Circulation, 104
(22), 2754
(2001). https://doi.org/10.1161/hc4701.098069 0009-7322 Google Scholar
I. K. Jang,
B. E. Bouma,
D. H. Kang,
S. J. Park,
S. W. Park,
K. B. Seung,
K. B. Choi,
M. Shishkov,
K. Schlendorf,
E. Pomerantsev,
S. L. Houser,
H. T. Aretz, and
G. J. Tearney,
“Visualization of coronary atherosclerotic plaques in patients using optical coherence tomography: comparison with intravascular ultrasound,”
J. Am. Coll. Cardiol., 39
(4), 604
–609
(2002). https://doi.org/10.1016/S0735-1097(01)01799-5 0735-1097 Google Scholar
I. K. Jang,
G. J. Tearney,
B. MacNeill,
M. Takano,
F. Moselewski,
N. Iftima,
M. Shishkov,
S. Houser,
H. T. Aretz,
E. F. Halpern, and
B. E. Bouma,
“In vivo characterization of coronary atherosclerotic plaque by use of optical coherence tomography,”
Circulation, 111
(12), 1551
–1555
(2005). https://doi.org/10.1161/01.CIR.0000159354.43778.69 0009-7322 Google Scholar
B. D. MacNeill,
I. K. Jang,
B. E. Bouma,
N. Iftimia,
M. Takano,
H. Yabushita,
M. Shishkov,
C. R. Kauffman,
S. L. Houser,
H. T. Aretz,
D. DeJoseph,
E. F. Halpern, and
G. J. Tearney,
“Focal and multi-focal plaque macrophage distributions in patients with acute and stable presentations of coronary artery disease,”
J. Am. Coll. Cardiol., 44
(5), 972
–979
(2004). https://doi.org/10.1016/j.jacc.2004.05.066 0735-1097 Google Scholar
G. J. Tearney,
M. E. Brezinski,
S. A. Boppart,
B. E. Bouma,
N. Weissman,
J. F. Southern,
E. A. Swanson, and
J. G. Fujimoto,
“Catheter-based optical imaging of a human coronary artery,”
Circulation, 94
(11), 3013
(1996). 0009-7322 Google Scholar
G. J. Tearney,
M. E. Brezinski,
B. E. Bouma,
S. A. Boppart,
C. Pitris,
J. F. Southern, and
J. G. Fujimoto,
“In vivo endoscopic optical biopsy with optical coherence tomography,”
Science, 276
(5321), 2037
–2039
(1997). https://doi.org/10.1126/science.276.5321.2037 0036-8075 Google Scholar
G. J. Tearney and
B. E. Bouma,
“Method and apparatus for determination of atherosclerotic plaque type by measurement of tissue optical properties,”
(2003) Google Scholar
G. J. Tearney,
H. Yabushita,
S. L. Houser,
H. T. Aretz,
I. K. Jang,
K. H. Schlendorf,
C. R. Kauffman,
M. Shishkov,
E. F. Halpern, and
B. E. Bouma,
“Quantification of macrophage content in atherosclerotic plaques by optical coherence tomography,”
Circulation, 107
(1), 113
–119
(2003). https://doi.org/10.1161/01.CIR.0000044384.41037.43 0009-7322 Google Scholar
H. Yabushita,
B. E. Bouma,
S. L. Houser,
H. T. Aretz,
I. K. Jang,
K. H. Schlendorf,
C. R. Kauffman,
M. Shishkov,
D. H. Kang,
E. F. Halpern, and
G. J. Tearney,
“Characterization of human atherosclerosis by optical coherence tomography,”
Circulation, 106
(13), 1640
–1645
(2002). https://doi.org/10.1161/01.CIR.0000029927.92825.F6 0009-7322 Google Scholar
T. M. Yelbuz,
M. A. Choma,
L. Thrane,
M. L. Kirby, and
J. A. Izatt,
“Optical coherence tomography: a new high-resolution imaging technology to study cardiac development in chick embryos,”
Circulation, 106
(22), 2771
–2774
(2002). https://doi.org/10.1161/01.CIR.0000042672.51054.7B 0009-7322 Google Scholar
W. Luo,
D. L. Marks,
T. S. Ralston, and
S. A. Boppart,
“Three-dimensional optical coherence tomography of the embryonic murine cardiovascular system,”
J. Biomed. Opt., 11
(2), 021014
(2006). https://doi.org/10.1117/1.2193465 1083-3668 Google Scholar
A. F. Zuluaga and
B. E. Bouma,
“Multi-channel optical coupler for spinning catheter,”
(2005) Google Scholar
D. Yelin,
B. E. Bouma,
N. Iftimia, and
G. J. Tearney,
“Three-dimensional spectrally encoded imaging,”
Opt. Lett., 28
(23), 2321
–2323
(2003). https://doi.org/10.1364/OL.28.002321 0146-9592 Google Scholar
“Heart disease and stroke statistics—2005 update,”
(2005) Google Scholar
G. J. Tearney,
I. K. Jang, and
B. E. Bouma,
“Optical coherence tomography for imaging the vulnerable plaque,”
J. Biomed. Opt., 11
(2), 021002
(2006). https://doi.org/10.1117/1.2192697 1083-3668 Google Scholar
B. D. MacNeill,
B. E. Bouma,
H. Yabushita,
I. K. Jang, and
G. J. Tearney,
“Intravascular optical coherence tomography: cellular imaging,”
J. Nucl. Cardiol., 12
(4), 460
–465
(2005). 1071-3581 Google Scholar
T. Kume,
T. Akasaka,
T. Kawamoto,
N. Watanabe,
E. Toyota,
Y. Neishi,
R. Sukmawan,
Y. Sadahira, and
K. Yoshida,
“Assessment of coronary intima-media thickness by optical coherence tomography: comparison with intravascular ultrasound,”
Jpn. Circ. J., 69
(8), 903
–907
(2005). 0047-1828 Google Scholar
T. Kume,
T. Akasaka,
T. Kawamoto,
H. Okura,
N. Watanabe,
E. Toyota,
Y. Neishi,
R. Sukmawan,
Y. Sadahira, and
K. Yoshida,
“Measurement of the thickness of the fibrous cap by optical coherence tomography,”
Am. Heart J., 152
(4), 755e1
–755e4
(2006). 0002-8703 Google Scholar
F. J. van der Meer,
D. J. Faber,
D. M. B. Sassoon,
M. C. Aalders,
G. Pasterkamp, and
T. G. van Leeuwen,
“Localized measurement of optical attenuation coefficients of atherosclerotic plaque constituents by quantitative optical coherence tomography,”
IEEE Trans. Med. Imaging, 24
(10), 1369
–1376
(2005). https://doi.org/10.1109/TMI.2005.854297 0278-0062 Google Scholar
F. J. van der Meer,
D. J. Faber,
J. Perrée,
G. Pasterkamp,
D. B. Sassoon, and
T. G. van Leeuwen,
“Quantitative optical coherence tomography of arterial wall components,”
Lasers Med. Sci., 20
(1), 45
–51
(2005). 0268-8921 Google Scholar
Y. Takeda and
O. Katoh,
“OCT-guided wiring technique for chronic total coronary occlusion,”
Optical Coherence Tomography in Cardiovascular Research, 183
–190 Informa Healthcare, London
(2007). Google Scholar
J. Tanigawa,
O. Katoh, and
C. Di Mario,
“Chronic total occlusion: do we need intravascular imaging guidance?,”
Optical Coherence Tomography in Cardiovascular Research, 171
–182 Informa Healthcare, London
(2007). Google Scholar
T. Kume,
T. Akasaka,
T. Kawamoto,
N. Watanabe,
E. Toyota,
R. Sukmawan,
Y. Sadahira, and
K. Yoshida,
“Visualization of neointima formation by optical coherence tomography,”
Intl. Heart J., 46
(6), 1133
–1136
(2005). Google Scholar
E. Regar,
H. M. M. van Beusekom,
W. J. van der Giessen, and
P. W. Serruys,
“Optical coherence tomography findings at follow-up after coronary stent implantation,”
Circulation, 112
(23), e345
–e346
(2005). 0009-7322 Google Scholar
J. F. Surmely,
Y. Takeda,
T. Ito, and
T. Suzuki,
“Acute OCT findings after stenting,”
Optical Coherence Tomography in Cardiovascular Research, 153
–160 Informa Healthcare, London
(2007). Google Scholar
J. S. Bredfeldt,
C. Vinegoni,
D. L. Marks, and
S. A. Boppart,
“Molecularly sensitive optical coherence tomography,”
Opt. Lett., 30
(5), 495
–497
(2005). https://doi.org/10.1364/OL.30.000495 0146-9592 Google Scholar
M. Lazebnik,
D. L. Marks,
K. Potgieter,
R. Gillette, and
S. A. Boppart,
“Functional optical coherence tomography for detecting neural activity through scattering changes,”
Opt. Lett., 28
(14), 1218
–1220
(2003). https://doi.org/10.1364/OL.28.001218 0146-9592 Google Scholar
T. M. Lee,
A. L. Oldenburg,
S. Sitafalwalla,
D. L. Marks,
W. Luo,
F. J. J. Toublan,
K. S. Suslick, and
S. A. Boppart,
“Engineered microsphere contrast agents for optical coherence tomography,”
Opt. Lett., 28
(17), 1546
–1548
(2003). https://doi.org/10.1364/OL.28.001546 0146-9592 Google Scholar
D. L. Marks and
S. A. Boppart,
“Nonlinear interferometric vibrational imaging,”
Phys. Rev. Lett., 92
(12), 123905
(2004). https://doi.org/10.1103/PhysRevLett.92.123905 0031-9007 Google Scholar
A. L. Oldenburg,
J. R. Gunther, and
S. A. Boppart,
“Imaging magnetically labeled cells with magnetomotive optical coherence tomography,”
Opt. Lett., 30
(7), 747
–749
(2005). https://doi.org/10.1364/OL.30.000747 0146-9592 Google Scholar
K. D. Rao,
M. A. Choma,
S. Yazdanfar,
A. M. Rollins, and
J. A. Izatt,
“Molecular contrast in optical coherence tomography by use of a pump-probe technique,”
Opt. Lett., 28
(5), 340
–342
(2003). https://doi.org/10.1038/425340a 0146-9592 Google Scholar
J. E. Roth,
J. A. Izatt, and
A. M. Rollins,
“Method and apparatus for polarization-sensitive optical coherence tomography,”
(2002) Google Scholar
C. Xu,
J. Ye,
D. L. Marks, and
S. A. Boppart,
“Near-infrared dyes as contrast-enhancing agents for spectroscopic optical coherence tomography,”
Opt. Lett., 29
(14), 1647
–1649
(2004). https://doi.org/10.1364/OL.29.001647 0146-9592 Google Scholar
C. Yang,
M. A. Choma,
L. E. Lamb,
J. D. Simon, and
J. A. Izatt,
“Protein-based molecular contrast optical coherence tomography with phytochrome as the contrast agent,”
Opt. Lett., 29
(12), 1396
–1398
(2004). https://doi.org/10.1364/OL.29.001396 0146-9592 Google Scholar
C. Yang,
L. E. L. McGuckin,
J. D. Simon,
M. A. Choma,
B. E. Applegate, and
J. A. Izatt,
“Spectral triangulation molecular contrast optical coherence tomography with indocyanine green as the contrast agent,”
Opt. Lett., 29
(17), 2016
–2018
(2004). https://doi.org/10.1364/OL.29.002016 0146-9592 Google Scholar
C. Yang,
“Molecular contrast optical coherence tomography: A review,”
Photochem. Photobiol., 81
(2), 215
–237
(2005). https://doi.org/10.1562/2004-08-06-IR-266.1 0031-8655 Google Scholar
S. D. Giattina,
B. K. Courtney,
P. R. Herz,
M. Harman,
S. Shortkroff,
D. L. Stamper,
B. Liu,
J. G. Fujimoto, and
M. E. Brezinski,
“Assessment of coronary plaque collagen with polarization sensitive optical coherence tomography (PS-OCT),”
Int. J. Cardiol., 107
(3), 400
–409
(2006). https://doi.org/10.1016/j.ijcard.2005.11.036 0167-5273 Google Scholar
W. C. Kuo,
N. K. Chou,
C. Chou,
C. M. Lai,
H. J. Huang,
S. S. Wang, and
J. J. Shyu,
“Polarization-sensitive optical coherence tomography for imaging human atherosclerosis,”
Appl. Opt., 46
(13), 2520
–2527
(2007). https://doi.org/10.1364/AO.46.002520 0003-6935 Google Scholar
A. I. Kholodnykh,
I. Y. Petrova,
M. Motamedi, and
R. O. Esenaliev,
“Accurate measurement of total attenuation coefficient of thin tissue with optical coherence tomography,”
IEEE J. Sel. Top. Quantum Electron., 9
(2), 210
–221
(2003). https://doi.org/10.1109/JSTQE.2003.814194 1077-260X Google Scholar
F. J. van der Meer,
D. J. Faber,
I. Çilesiz,
M. J. C. Van Gemert, and
T. G. van Leeuwen,
“Temperature-dependent optical properties of individual vascular wall components measured by optical coherence tomography,”
J. Biomed. Opt., 11
(4), 041120
(2006). https://doi.org/10.1117/1.2333613 1083-3668 Google Scholar
J. Rogowska,
N. A. Patel,
J. G. Fujimoto, and
M. E. Brezinski,
“Optical coherence tomographic elastography technique for measuring deformation and strain of atherosclerotic tissues,”
Heart, 90
(5), 556
–562
(2004). 1355-6037 Google Scholar
J. Rogowska,
N. Patel,
S. Plummer, and
M. E. Brezinski,
“Quantitative optical coherence tomographic elastography: method for assessing arterial mechanical properties,”
Br. J. Radiol., 79
(945), 707
–711
(2006). https://doi.org/10.1259/bjr/22522280 0007-1285 Google Scholar
S. A. Boppart,
W. Luo,
D. L. Marks, and
K. W. Singletary,
“Optical coherence tomography: feasibility for basic research and image-guided surgery of breast cancer,”
Breast Cancer Res. Treat., 84
(2), 85
–97
(2004). https://doi.org/10.1023/B:BREA.0000018401.13609.54 0167-6806 Google Scholar
A. M. Zysk and
S. A. Boppart,
“Computational methods for analysis of human breast tumor tissue in optical coherence tomography images,”
J. Biomed. Opt., 11
(5), 054015
(2006). https://doi.org/10.1117/1.2358964 1083-3668 Google Scholar
D. Cao,
C. Lin,
S. H. Woo,
R. Vang,
T. N. Tsangaris, and
P. Argani,
“Separate cavity margin sampling at the time of initial breast lumpectomy significantly reduces the need for reexcisions,”
Am. J. Surg. Pathol., 29
(12), 1625
–1632
(2005). 0147-5185 Google Scholar
F. T. Nguyen,
A. M. Zysk,
J. G. Kotynek,
F. J. Bellafiore,
K. M. Rowland,
P. A. Johnson,
E. J. Chaney, and
S. A. Boppart,
“Portable real-time optical coherence tomography system for intraoperative imaging and staging of breast cancer,”
Proc. SPIE, 6430 64300H
(2007). 0277-786X Google Scholar
W. Luo,
F. T. Nguyen,
A. M. Zysk,
T. S. Ralston,
J. Brockenbrough,
D. L. Marks,
A. L. Oldenburg, and
S. A. Boppart,
“Optical biopsy of lymph node morphology using optical coherence tomography,”
Technol. Cancer Res. Treat., 4
(5), 539
–548
(2005). 1533-0346 Google Scholar
N. V. Iftimia,
B. E. Bouma,
M. B. Pitman,
B. Goldberg,
J. Bressner, and
G. J. Tearney,
“A portable, low coherence interferometry based instrument for fine needle aspiration biopsy guidance,”
Rev. Sci. Instrum., 76
(6), 064301
(2005). https://doi.org/10.1063/1.1921509 0034-6748 Google Scholar
A. F. Zuluaga,
M. Follen,
I. Boiko,
A. Malpica, and
R. Richards-Kortum,
“Optical coherence tomography: A pilot study of a new imaging technique for noninvasive examination of cervical tissue,”
Am. J. Obstet. Gynecol., 193
(1), 83
–88
(2005). 0002-9378 Google Scholar
A. M. Zysk,
S. G. Adie,
J. J. Armstrong,
M. S. Leigh,
A. Paduch,
D. D. Sampson,
F. T. Nguyen, and
S. A. Boppart,
“Needle-based refractive index measurement using low-coherence interferometry,”
Opt. Lett., 32
(4), 385
–387
(2007). https://doi.org/10.1364/OL.32.000385 0146-9592 Google Scholar
A. M. Zysk,
D. L. Marks,
D. Y. Liu, and
S. A. Boppart,
“Needle-based reflection refractometry of scattering samples using coherence-gated detection,”
Opt. Express, 15
(8), 4787
–4794
(2007). https://doi.org/10.1364/OE.15.004787 1094-4087 Google Scholar
P. R. Herz,
Y. Chen,
A. D. Aguirre,
K. Schneider,
P. Hsiung,
J. G. Fujimoto,
K. Madden,
J. Schmitt,
J. Goodnow, and
C. Petersen,
“Micromotor endoscope catheter for in vivo, ultrahigh-resolution optical coherence tomography,”
Opt. Lett., 29
(19), 2261
–2263
(2004). https://doi.org/10.1364/OL.29.002261 0146-9592 Google Scholar
P. H. Tran,
D. S. Mukai,
M. Brenner, and
Z. Chen,
“In vivo endoscopic optical coherence tomography by use of a rotational microelectromechanical system probe,”
Opt. Lett., 29
(11), 1236
–1238
(2004). https://doi.org/10.1364/OL.29.001236 0146-9592 Google Scholar
T. Xie,
H. Xie,
G. K. Fedder, and
Y. Pan,
“Endoscopic optical coherence tomography with a modified microelectromechanical systems mirror for detection of bladder cancers,”
Appl. Opt., 42
(31), 6422
–6426
(2003). https://doi.org/10.1364/AO.42.006422 0003-6935 Google Scholar
A. G. Bibas,
A. G. Podoleanu,
R. G. Cucu,
M. Bonmarin,
G. M. Dobre,
V. M. M. Ward,
E. Odell,
A. Boxer,
M. J. Gleeson, and
D. A. Jackson,
“3-D optical coherence tomography of the laryngeal mucosa,”
Clin. Otolaryngol., 29
(6), 713
–720
(2004). 0307-7772 Google Scholar
W. B. Armstrong,
J. M. Ridgway,
D. E. Vokes,
S. Guo,
J. Perez,
R. P. Jackson,
M. Gu,
J. Su,
R. L. Crumley,
T. Y. Shibuya,
U. Mahmood,
Z. Chen, and
B. J. F. Wong,
“Optical coherence tomography of laryngeal cancer,”
Laryngoscope, 116
(7), 1107
–1113
(2006). https://doi.org/10.1097/01.mlg.0000217539.27432.5a 0023-852X Google Scholar
B. J. F. Wong,
R. P. Jackson,
S. Guo,
J. M. Ridgway,
U. Mahmood,
J. Su,
T. Y. Shibuya,
R. L. Crumley,
M. Gu,
W. B. Armstrong, and
Z. Chen,
“In vivo optical coherence tomography of the human larynx: normative and benign pathology in 82 patients,”
Laryngoscope, 115
(11), 1904
–1911
(2005). https://doi.org/10.1097/01.MLG.0000181465.17744.BE 0023-852X Google Scholar
K. Lüerβen,
H. Lubatschowski,
K. Ursinus,
H. Gasse,
R. Koch, and
M. Ptok,
“Optical coherence tomography in the diagnosis of vocal folds,”
HNO, 54
(8), 611
–615
(2006). https://doi.org/10.1007/s00106-005-1373-4 0017-6192 Google Scholar
U. Mahmood,
J. Ridgway,
R. Jackson,
S. Guo,
J. Su,
W. Armstrong,
T. Shibuya,
R. Crumley,
Z. Chen, and
B. Wong,
“In vivo optical coherence tomography of the nasal mucosa,”
Am. J. Rhinol., 20
(2), 155
–159
(2006). 1050-6586 Google Scholar
J. M. Ridgway,
W. B. Armstrong,
S. Guo,
U. Mahmood,
J. Su,
R. P. Jackson,
T. Shibuya,
R. L. Crumley,
M. Gu,
Z. Chen, and
B. J. F. Wong,
“In vivo optical coherence tomography of the human oral cavity and oropharynx,”
Arch. Otolaryngol. Head Neck Surg., 132
(10), 1074
–1081
(2006). 0886-4470 Google Scholar
S. Brand,
J. M. Poneros,
B. E. Bouma,
G. J. Tearney,
C. C. Compton, and
N. S. Nishioka,
“Optical coherence tomography in the gastrointestinal tract,”
Endoscopy, 32
(10), 796
–803
(2000). 0013-726X Google Scholar
S. Jäckle,
N. Gladkova,
F. Feldchtein,
A. Terentieva,
B. Brand,
G. Gelikonov,
V. Gelikonov,
A. Sergeev,
A. Fritscher-Ravens,
J. Freund,
U. Seitz,
S. Schröder, and
N. Soehendra,
“In vivo endoscopic optical coherence tomography of the human gastrointestinal tract–toward optical biopsy,”
Endoscopy, 32
(10), 743
–749
(2000). 0013-726X Google Scholar
C. Pitris,
C. Jesser,
S. A. Boppart,
D. Stamper,
M. E. Brezinski, and
J. G. Fujimoto,
“Feasibility of optical coherence tomography for high-resolution imaging of human gastrointestinal tract malignancies,”
J. Gastroenterol., 35
(2), 87
–92
(2000). 0944-1174 Google Scholar
G. J. Tearney,
M. E. Brezinski,
J. F. Southern,
B. E. Bouma,
S. A. Boppart, and
J. G. Fujimoto,
“Optical biopsy in human gastrointestinal tissue using optical coherence tomography,”
Am. J. Gastroenterol., 92
(10), 1800
–1804
(1997). 0002-9270 Google Scholar
A. Chak,
M. B. Wallace, and
J. M. Poneros,
“Optical coherence tomography of Barrett’s esophagus,”
Endoscopy, 37
(6), 587
–590
(2005). 0013-726X Google Scholar
S. A. Faruqi,
V. Arantes, and
M. S. Bhutani,
“Barrett’s esophagus: current and future role of endosonography and optical coherence tomography,”
Dis. Esophagus, 17
(2), 118
–123
(2004). 1120-8694 Google Scholar
G. Isenberg,
M. V. Sivak,
A. Chak,
R. C. K. Wong,
J. E. Willis,
B. Wolf,
D. Y. Rowland,
A. Das, and
A. Rollins,
“Accuracy of endoscopic optical coherence tomography in the detection of dysplasia in Barrett’s esophagus: a prospective, double-blinded study,”
Gastrointest. Endosc., 62
(6), 825
–831
(2005). 0016-5107 Google Scholar
S. Jäckle,
N. Gladkova,
F. Feldchtein,
A. Terentieva,
B. Brand,
G. Gelikonov,
V. Gelikonov,
A. Sergeev,
A. Fritscher-Ravens,
J. Freund,
U. Seitz,
S. Schröder, and
N. Soehendra,
“In vivo endoscopic optical coherence tomography of esophagitis, Barrett’s esophagus, and adenocarcinoma of the esophagus,”
Endoscopy, 32
(10), 750
–755
(2000). 0013-726X Google Scholar
X. D. Li,
S. A. Boppart,
J. Van Dam,
H. Mashimo,
M. Mutinga,
W. Drexler,
M. Klein,
C. Pitris,
M. L. Krinsky,
M. E. Brezinski, and
J. G. Fujimoto,
“Optical coherence tomography: advanced technology for the endoscopic imaging of Barrett’s esophagus,”
Endoscopy, 32
(12), 921
–930
(2000). 0013-726X Google Scholar
J. M. Poneros and
N. S. Nishioka,
“Diagnosis of Barrett’s esophagus using optical coherence tomography,”
Gastrointest Endosc Clin. N. Am., 13
(2), 309
–323
(2003). 1052-5157 Google Scholar
J. Poneros,
“Optical coherence tomography and the detection of dysplasia in Barrett’s esophagus,”
Gastrointest. Endosc., 62
(6), 832
–833
(2005). 0016-5107 Google Scholar
X. Qi,
M. V. Sivak,
G. Isenberg,
J. E. Willis, and
A. M. Rollins,
“Computer-aided diagnosis of dysplasia in Barrett’s esophagus using endoscopic optical coherence tomography,”
J. Biomed. Opt., 11
(4), 044010
(2006). https://doi.org/10.1117/1.2337314 1083-3668 Google Scholar
A. Wax,
J. W. Pyhtila,
R. N. Graf,
R. Nines,
C. W. Boone,
R. R. Dasari,
M. S. Feld,
V. E. Steele, and
G. D. Stoner,
“Prospective grading of neoplastic change in rat esophagus epithelium using angle-resolved low-coherence interferometry,”
J. Biomed. Opt., 10
(5), 051604
(2005). https://doi.org/10.1117/1.2102767 1083-3668 Google Scholar
P. F. Escobar,
J. L. Belinson,
A. White,
N. M. Shakhova,
F. I. Feldchtein,
M. V. Kareta, and
N. D. Gladkova,
“Diagnostic efficacy of optical coherence tomography in the management of preinvasive and invasive cancer of uterine cervix and vulva,”
Intl. J. Gynecolog. Cancer, 14
(3), 470
–474
(2004). Google Scholar
R. Drezek,
M. Guillaud,
T. Collier,
I. Boiko,
A. Malpica,
C. Macaulay,
M. Follen, and
R. Richards-Kortum,
“Light scattering from cervical cells throughout neoplastic progression: influence of nuclear morphology, DNA content, and chromatin texture,”
J. Biomed. Opt., 8
(1), 7
–16
(2003). https://doi.org/10.1117/1.1528950 1083-3668 Google Scholar
I. V. Turchin,
E. A. Sergeeva,
L. S. Dolin,
V. A. Kamensky,
N. M. Shakhova, and
R. Richards-Kortum,
“Novel algorithm of processing optical coherence tomography images for differentiation of biological tissue pathologies,”
J. Biomed. Opt., 10
(6), 064024
(2005). https://doi.org/10.1117/1.2137670 1083-3668 Google Scholar
N. D. Gladkova,
G. A. Petrova,
N. K. Nikulin,
S. G. Radenska-Lopovok,
L. B. Snopova,
Y. P. Chumakov,
V. A. Nasonova,
V. M. Gelikonov,
G. V. Gelikonov,
R. V. Kuranov,
A. M. Sergeev, and
F. I. Feldchtein,
“In vivo optical coherence tomography imaging of human skin: norm and pathology,”
Skin Res. Technol., 6
(1), 6
–16
(2000). 0909-752X Google Scholar
C. A. Jesser,
S. A. Boppart,
C. Pitris,
D. L. Stamper,
G. P. Nielsen,
M. E. Brezinski, and
J. G. Fujimoto,
“High resolution imaging of transitional cell carcinoma with optical coherence tomography: feasibility for the evaluation of bladder pathology,”
Br. J. Radiol., 72
(864), 1170
–1176
(1999). 0007-1285 Google Scholar
M. J. Manyak,
N. D. Gladkova,
J. H. Makari,
A. M. Schwartz,
E. V. Zagaynova,
L. Zolfaghari,
J. M. Zara,
R. Iksanov, and
F. I. Feldchtein,
“Evaluation of superficial bladder transitional-cell carcinoma by optical coherence tomography,”
J. Endourol, 19
(5), 570
–574
(2005). 0892-7790 Google Scholar
A. Pagnoni,
A. Knuettel,
P. Welker,
M. Rist,
T. Stoudemayer,
L. Kolbe,
I. Sadiq, and
A. M. Kligman,
“Optical coherence tomography in dermatology,”
Skin Res. Technol., 5
(2), 83
–87
(1999). 0909-752X Google Scholar
Y. T. Pan,
T. Q. Xie,
C. W. Du,
S. Bastacky,
S. Meyers, and
M. L. Zeidel,
“Enhancing early bladder cancer detection with fluorescence-guided endoscopic optical coherence tomography,”
Opt. Lett., 28
(24), 2485
–2487
(2003). https://doi.org/10.1364/OL.28.002485 0146-9592 Google Scholar
M. C. Pierce,
J. Strasswimmer,
B. H. Park,
B. Cense, and
J. F. de Boer,
“Advances in optical coherence tomography imaging for dermatology,”
J. Invest. Dermatol., 123
(3), 458
–463
(2004). https://doi.org/10.1111/j.0022-202X.2004.23404.x 0022-202X Google Scholar
J. M. Schmitt,
M. J. Yadlowsky, and
R. F. Bonner,
“Subsurface imaging of living skin with optical coherence microscopy,”
Dermatology (Basel, Switz.), 191
(2), 93
–98
(1995). 1018-8665 Google Scholar
Z. G. Wang,
D. B. Durand,
M. Schoenberg, and
Y. T. Pan,
“Fluorescence guided optical coherence tomography for the diagnosis of early bladder cancer in a rat model,”
J. Urol. (Baltimore), 174
(6), 2376
–2381
(2005). https://doi.org/10.1097/01.ju.0000180413.98752.a1 0022-5347 Google Scholar
E. V. Zagaynova,
O. S. Streltsova,
N. D. Gladkova,
L. B. Snopova,
G. V. Gelikonov,
F. I. Feldchtein, and
A. N. Morozov,
“In vivo optical coherence tomography feasibility for bladder disease,”
J. Urol. (Baltimore), 167
(3), 1492
–1496
(2002). https://doi.org/10.1016/S0022-5347(05)65351-7 0022-5347 Google Scholar
J. Welzel,
E. Lankenau,
R. Birngruber, and
R. Engelhardt,
“Optical coherence tomography of the human skin,”
J. Am. Acad. Dermatol., 37
(6), 958
–963
(1997). 0190-9622 Google Scholar
J. Welzel,
“Optical coherence tomography in dermatology: a review,”
Skin Res. Technol., 7
(1), 1
–9
(2001). 0909-752X Google Scholar
J. Welzel,
C. Reinhardt,
E. Lankenau,
C. Winter, and
H. H. Wolff,
“Changes in function and morphology of normal human skin: evaluation using optical coherence tomography,”
Br. J. Dermatol., 150
(2), 220
–225
(2004). https://doi.org/10.1111/j.1365-2133.2004.05810.x 0007-0963 Google Scholar
W. Drexler,
D. Stamper,
C. Jesser,
X. Li,
C. Pitris,
K. Saunders,
S. Martin,
M. B. Lodge,
J. G. Fujimoto, and
M. E. Brezinski,
“Correlation of collagen organization with polarization sensitive imaging of in vitro cartilage: implications for osteoarthritis,”
J. Rheumatol., 28
(6), 1311
–1318
(2001). 0315-162X Google Scholar
X. Li,
S. Martin,
C. Pitris,
R. Ghanta,
D. L. Stamper,
M. Harman,
J. G. Fujimoto, and
M. E. Brezinski,
“High-resolution optical coherence tomographic imaging of osteoarthritic cartilage during open knee surgery,”
Arthritis Res. Ther., 7
(2), R318
–R323
(2005). https://doi.org/10.1186/ar1491 1478-6354 Google Scholar
T. Xie,
S. Guo,
J. Zhang,
Z. Chen, and
G. M. Peavy,
“Determination of characteristics of degenerative joint disease using optical coherence tomography and polarization sensitive optical coherence tomography,”
Lasers Surg. Med., 38
(9), 852
–865
(2006). https://doi.org/10.1002/lsm.20394 0196-8092 Google Scholar
J. J. Armstrong,
M. S. Leigh,
I. D. Walton,
A. V. Zvyagin,
S. A. Alexandrov,
S. Schwer,
D. D. Sampson,
D. R. Hillman, and
P. R. Eastwood,
“In vivo size and shape measurement of the human upper airway using endoscopic long-range optical coherence tomography,”
Opt. Express, 11
(15), 1817
–1826
(2003). 1094-4087 Google Scholar
J. J. Armstrong,
M. S. Leigh,
D. D. Sampson,
J. H. Walsh,
D. R. Hillman, and
P. R. Eastwood,
“Quantitative upper airway imaging with anatomic optical coherence tomography,”
Am. J. Respir. Crit. Care Med., 173
(2), 226
–233
(2006). 1073-449X Google Scholar
A. Z. Freitas,
D. M. Zezell,
N. D. Vieira,
A. C. Ribeiro, and
A. S. L. Gomes,
“Imaging carious human dental tissue with optical coherence tomography,”
J. Appl. Phys., 99
(2), 024906
(2006). https://doi.org/10.1063/1.2160716 0021-8979 Google Scholar
L. L. Otis,
M. J. Everett,
U. S. Sathyam, and
B. W. Colston,
“Optical coherence tomography: A new imaging technology for dentistry,”
J. Am. Dent. Assoc., 131
(4), 511
–514
(2000). 0002-8177 Google Scholar
B. J. Tromberg,
“Overcoming barriers to clinical translation,”
Optical Imaging 2006: Fifth Inter-Institute Workshop on Optical Diagnostic Imaging from Bench to Bedside at the National Institutes of Health,
(2006) Google Scholar
J. M. Crawford,
“Optics and the pathology gold standard,”
Optical Imaging 2006: Fifth Inter-Institute Workshop on Optical Diagnostic Imaging from Bench to Bedside at the National Institutes of Health,
(2006) Google Scholar
D. M. Eddy,
“Practice policies: where do they come from?,”
JAMA, J. Am. Med. Assoc., 263
(9), 1265
(1990). https://doi.org/10.1001/jama.263.9.1265 0098-7484 Google Scholar
M. J. McQueen,
“Overview of evidence-based medicine: Challenges for evidence-based laboratory medicine,”
Clin. Chem., 47
(8), 1536
–1546
(2001). 0009-9147 Google Scholar
C. P. Price,
“Evidence-based laboratory medicine: supporting decision-making,”
Clin. Chem., 46
(8), 1041
–1050
(2000). 0009-9147 Google Scholar
D. L. Sackett and
R. B. Haynes,
“The architecture of diagnostic research. (Evidence base of clinical diagnosis),”
Br. Med. J., 324
(7336), 539
–541
(2002). https://doi.org/10.1136/bmj.324.7336.539 0007-1447 Google Scholar
“Animal welfare act of 1966 as amended 1970, 1976, 1984, 1985, 1990, 1991 and 1995,”
(1966) Google Scholar
“Health research extension act of 1985,”
(1985) Google Scholar
“Health insurance portability and accountability act of 1996,”
(1996) Google Scholar
J. C. Pearson,
“Informatics platforms to support collaboration and drive standardization,”
Optical Imaging 2006: Fifth Inter-Institute Workshop on Optical Diagnostic Imaging from Bench to Bedside at the National Institutes of Health,
(2006) Google Scholar
“ANSI Z136.3 Safe use of lasers in health care facilities,”
(2005) Google Scholar
B. J. Tromberg,
J. C. Pearson,
J. M. Crawford,
D. A. Benaron,
A. Hayward,
R. Waynant, and
P. Barker,
“Panel discussion: Translating optical technologies from benchtop to clinical standard,”
Optical Imaging 2006: Fifth Inter-Institute Workshop on Optical Diagnostic Imaging from Bench to Bedside at the National Institutes of Health,
(2006) Google Scholar
R. Weissleder and
U. Mahmood,
“Molecular imaging,”
Radiology, 219
(2), 316
–333
(2001). 0033-8419 Google Scholar
S. A. Boppart,
A. L. Oldenburg,
C. Xu, and
D. L. Marks,
“Optical probes and techniques for molecular contrast enhancement in coherence imaging,”
J. Biomed. Opt., 10
(4), 041208
(2005). https://doi.org/10.1117/1.2008974 1083-3668 Google Scholar
P. A. Dayton and
K. W. Ferrara,
“Targeted imaging using ultrasound,”
J. Magn. Reson Imaging, 16
(4), 362
–377
(2002). 1053-1807 Google Scholar
P. M. Winter,
A. M. Morawski,
S. D. Caruthers,
R. W. Fuhrhop,
H. Zhang,
T. A. Williams,
J. S. Allen,
E. K. Lacy,
J. D. Robertson,
G. M. Lanza, and
S. A. Wickline,
“Molecular imaging of angiogenesis in early-stage atherosclerosis with αvβ3-integrin-targeted nanoparticles,”
Circulation, 108
(18), 2270
–2274
(2003). https://doi.org/10.1161/01.CIR.0000093185.16083.95 0009-7322 Google Scholar
F. J. J. Toublan,
S. Boppart, and
K. S. Suslick,
“Tumor targeting by surface-modified protein microspheres,”
J. Am. Chem. Soc., 128
(11), 3472
–3473
(2006). https://doi.org/10.1021/ja0544455 0002-7863 Google Scholar
S. J. Oldenburg,
R. D. Averitt,
S. L. Westcott, and
N. J. Halas,
“Nanoengineering of optical resonances,”
Chem. Phys. Lett., 288
(2), 243
–247
(1998). https://doi.org/10.1016/S0009-2614(98)00277-2 0009-2614 Google Scholar
A. Agrawal,
S. Huang,
A. W. H. Lin,
M. H. Lee,
J. K. Barton,
R. A. Drezek, and
T. J. Pfefer,
“Quantitative evaluation of optical coherence tomography signal enhancement with gold nanoshells,”
J. Biomed. Opt., 11
(4), 041121
(2006). https://doi.org/10.1117/1.2339071 1083-3668 Google Scholar
G. Kong,
R. D. Braun, and
M. W. Dewhirst,
“Hyperthermia enables tumor-specific nanoparticle delivery: Effect of particle size,”
Cancer Res., 60
(16), 4440
–4445
(2000). 0008-5472 Google Scholar
L. R. Hirsch,
R. J. Stafford,
J. A. Bankson,
S. R. Sershen,
B. Rivera,
R. E. Price,
J. D. Hazle,
N. J. Halas, and
J. L. West,
“Nanoshell-mediated near-infrared thermal therapy of tumors under magnetic resonance guidance,”
Proc. Natl. Acad. Sci. U.S.A., 100
(23), 13549
–13554
(2003). https://doi.org/10.1073/pnas.2232479100 0027-8424 Google Scholar
J. Chen,
F. Saeki,
B. J. Wiley,
H. Cang,
M. J. Cobb,
Z. Y. Li,
L. Au,
H. Zhang,
M. B. Kimmey,
X. Li, and
Y. Xia,
“Gold nanocages: Bioconjugation and their potential use as optical imaging contrast agents,”
Nano Lett., 5
(3), 473
–477
(2005). https://doi.org/10.1021/nl047950t 1530-6984 Google Scholar
A. L. Oldenburg,
M. N. Hansen,
D. A. Zweifel,
A. Wei, and
S. A. Boppart,
“Plasmon-resonant gold nanorods as low backscattering albedo contrast agents for optical coherence tomography,”
Opt. Express, 14
(15), 6724
–6738
(2006). https://doi.org/10.1364/OE.14.006724 1094-4087 Google Scholar
X. Huang,
I. H. El-Sayed,
W. Qian, and
M. A. El-Sayed,
“Cancer cell imaging and photothermal therapy in the near-infrared region by using gold nanorods,”
J. Am. Chem. Soc., 128
(6), 2115
–2120
(2006). https://doi.org/10.1021/ja057254a 0002-7863 Google Scholar
U. Morgner,
W. Drexler,
F. X. Kärtner,
X. D. Li,
C. Pitris,
E. P. Ippen, and
J. G. Fujimoto,
“Spectroscopic optical coherence tomography,”
Opt. Lett., 25
(2), 111
–113
(2000). https://doi.org/10.1364/OL.25.000111 0146-9592 Google Scholar
D. J. Faber, G. Mik,
M. C. G. Aalders, and
T. G. van Leeuwen,
“Toward assessment of blood oxygen saturation by spectroscopic optical coherence tomography,”
Opt. Lett., 30
(9), 1015
–1017
(2005). https://doi.org/10.1364/OL.30.001015 0146-9592 Google Scholar
D. C. Adler,
T. H. Ko,
P. R. Herz, and
J. G. Fujimoto,
“Optical coherence tomography contrast enhancement using spectroscopic analysis with spectral autocorrelation,”
Opt. Express, 12
(22), 5487
–5501
(2004). https://doi.org/10.1364/OPEX.12.005487 1094-4087 Google Scholar
C. Xu,
P. S. Carney, and
S. A. Boppart,
“Wavelength-dependent scattering in spectroscopic optical coherence tomography,”
Opt. Express, 13
(14), 5450
–5462
(2005). https://doi.org/10.1364/OPEX.13.005450 1094-4087 Google Scholar
C. Xu,
D. L. Marks,
M. N. Do, and
S. A. Boppart,
“Separation of absorption and scattering profiles in spectroscopic optical coherence tomography using a least-squares algorithm,”
Opt. Express, 12
(20), 4790
–4803
(2004). https://doi.org/10.1364/OPEX.12.004790 1094-4087 Google Scholar
H. Cang,
T. Sun,
Z. Y. Li,
J. Chen,
B. J. Wiley,
Y. Xia, and
X. Li,
“Gold nanocages as contrast agents for spectroscopic optical coherence tomography,”
Opt. Lett., 30
(22), 3048
–3050
(2005). https://doi.org/10.1364/OL.30.003048 0146-9592 Google Scholar
T. Støren,
A. Røyset,
L. O. Svaasand, and
T. Lindmo,
“Functional imaging of dye concentration in tissue phantoms by spectroscopic optical coherence tomography,”
J. Biomed. Opt., 10
(2), 024037
(2005). https://doi.org/10.1117/1.1898242 1083-3668 Google Scholar
M. G. Harisinghani,
J. Barentsz,
P. F. Hahn,
W. M. Deserno,
S. Tabatabaei,
C. H. van de Kaa,
J. de la Rosette, and
R. Weissleder,
“Noninvasive detection of clinically occult lymph-node metastases in prostate cancer,”
N. Engl. J. Med., 348
(25), 2491
–2499
(2003). https://doi.org/10.1056/NEJMoa022749 0028-4793 Google Scholar
A. L. Oldenburg,
F. J. J. Toublan,
K. S. Suslick,
A. Wei, and
S. A. Boppart,
“Magnetomotive contrast for in vivo optical coherence tomography,”
Opt. Express, 13
(17), 6597
–6614
(2005). https://doi.org/10.1364/OPEX.13.006597 1094-4087 Google Scholar
J. Kim,
J. Oh,
T. E. Milner, and
J. S. Nelson,
“Hemoglobin contrast in magnetomotive optical Doppler tomography,”
Opt. Lett., 31
(6), 778
–780
(2006). https://doi.org/10.1364/OL.31.000778 0146-9592 Google Scholar
D. Artemov,
N. Mori,
B. Okollie, and
Z. M. Bhujwalla,
“MR molecular imaging of the Her-2/neu receptor in breast cancer cells using targeted iron oxide nanoparticles,”
Magn. Reson. Med., 49
(3), 403
–408
(2003). https://doi.org/10.1002/mrm.10406 0740-3194 Google Scholar
W. J. Rogers and
P. Basu,
“Factors regulating macrophage endocytosis of nanoparticles: implications for targeted magnetic resonance plaque imaging,”
Atherosclerosis, 178
(1), 67
–73
(2005). https://doi.org/10.1016/j.atherosclerosis.2004.08.017 0021-9150 Google Scholar
J. Oh,
M. D. Feldman,
J. Kim,
C. Condit,
S. Emalianov, and
T. E. Milner,
“Detection of magnetic nanoparticles in tissue using magneto-motive ultrasound,”
Nanotechnology, 17
(16), 4183
–4190
(2006). https://doi.org/10.1088/0957-4484/17/16/031 0957-4484 Google Scholar
S. Hamaguchi,
I. Tohnai,
A. Ito,
K. Mitsudo,
T. Shigetomi,
M. Ito,
H. Honda,
T. Kobayashi, and
M. Ueda,
“Selective hyperthermia using magnetoliposomes to target cervical lymph node metastasis in a rabbit tongue tumor model,”
Cancer Sci., 94
(9), 834
–839
(2003). Google Scholar
B. E. Applegate,
C. Yang, and
J. A. Izatt,
“Theoretical comparison of the sensitivity of molecular contrast optical coherence tomography techniques,”
Opt. Express, 13
(20), 8146
–8163
(2005). https://doi.org/10.1364/OPEX.13.008146 1094-4087 Google Scholar
B. E. Applegate and
J. A. Izatt,
“Molecular imaging of endogenous and exogenous chromophores using ground state recovery pump-probe optical coherence tomography,”
Opt. Express, 14
(20), 9142
–9155
(2006). https://doi.org/10.1364/OE.14.009142 1094-4087 Google Scholar
A. Zumbusch,
G. R. Holtom, and
X. S. Xie,
“Three-dimensional vibrational imaging by coherent anti-Stokes Raman scattering,”
Phys. Rev. Lett., 82
(20), 4142
–4145
(1999). https://doi.org/10.1103/PhysRevLett.82.4142 0031-9007 Google Scholar
D. L. Marks,
C. Vinegoni,
J. S. Bredfeldt, and
S. A. Boppart,
“Interferometric differentiation between resonant coherent anti-Stokes Raman scattering and nonresonant four-wave-mixing processes,”
Appl. Phys. Lett., 85
(23), 5787
–5789
(2004). https://doi.org/10.1063/1.1829162 0003-6951 Google Scholar
C. L. Evans,
E. O. Potma, and
X. S. Xie,
“Coherent anti-Stokes Raman scattering spectral interferometry: determination of the real and imaginary components of nonlinear susceptibility chi(3) for vibrational microscopy,”
Opt. Lett., 29
(24), 2923
–2925
(2004). https://doi.org/10.1364/OL.29.002923 0146-9592 Google Scholar
E. O. Potma,
C. L. Evans, and
X. S. Xie,
“Heterodyne coherent anti-Stokes Raman scattering (CARS) imaging,”
Opt. Lett., 31
(2), 241
–243
(2006). https://doi.org/10.1364/OL.31.000241 0146-9592 Google Scholar
P. R. Herz,
Y. Chen,
A. D. Aguirre,
J. G. Fujimoto,
H. Mashimo,
J. Schmitt,
A. Koski,
J. Goodnow, and
C. Petersen,
“Ultrahigh resolution optical biopsy with endoscopic optical coherence tomography,”
Opt. Express, 12
(15), 3532
–3542
(2004). https://doi.org/10.1364/OPEX.12.003532 1094-4087 Google Scholar
M. Laubscher,
M. Ducros,
B. Karamata,
T. Lasser, and
R. Salathé,
“Video-rate three-dimensional optical coherence tomography,”
Opt. Express, 10
(9), 429
–435
(2002). 1094-4087 Google Scholar
N. A. Nassif,
B. Cense,
B. H. Park,
M. C. Pierce,
S. H. Yun,
B. E. Bouma,
G. J. Tearney,
T. C. Chen, and
J. F. de Boer,
“In vivo high-resolution video-rate spectral-domain optical coherence tomography of the human retina and optic nerve,”
Opt. Express, 12
(3), 367
–376
(2004). https://doi.org/10.1364/OPEX.12.000367 1094-4087 Google Scholar
N. Nassif,
B. Cense,
B. H. Park,
S. H. Yun,
T. C. Chen,
B. E. Bouma,
G. J. Tearney, and
J. F. de Boer,
“In vivo human retinal imaging by ultrahigh-speed spectral domain optical coherence tomography,”
Opt. Lett., 29
(5), 480
–482
(2004). https://doi.org/10.1364/OL.29.000480 0146-9592 Google Scholar
N. Nishizawa,
Y. Chen,
P. Hsiung,
E. P. Ippen, and
J. G. Fujimoto,
“Real-time, ultrahigh-resolution, optical coherence tomography with an all-fiber, femtosecond fiber laser continuum at ,”
Opt. Lett., 29
(24), 2846
–2848
(2004). https://doi.org/10.1364/OL.29.002846 0146-9592 Google Scholar
B. H. Park,
M. C. Pierce,
B. Cense, and
J. F. de Boer,
“Real-time multi-functional optical coherence tomography,”
Opt. Express, 11
(7), 782
–793
(2003). 1094-4087 Google Scholar
A. M. Rollins,
R. Ung-arunyawee,
A. Chak,
R. C. K. Wong,
K. Kobayashi,
M. V. Sivak, and
J. A. Izatt,
“Real-time in vivo imaging of human gastrointestinal ultrastructure by use of endoscopic optical coherence tomography with a novel efficient interferometer design,”
Opt. Lett., 24
(19), 1358
–1360
(1999). 0146-9592 Google Scholar
A. M. Rollins,
M. D. Kulkarni,
S. Yazdanfar,
R. Ung-arunyawee, and
J. A. Izatt,
“In vivo video rate optical coherence tomography,”
Opt. Express, 3
(6), 219
–229
(1998). 1094-4087 Google Scholar
M. V. Sarunic,
B. E. Applegate, and
J. A. Izatt,
“Real-time quadrature projection complex conjugate resolved Fourier domain optical coherence tomography,”
Opt. Lett., 31
(16), 2426
–2428
(2006). https://doi.org/10.1364/OL.31.002426 0146-9592 Google Scholar
M. Wojtkowski,
T. Bajraszewski,
P. Targowski, and
A. Kowalczyk,
“Real-time in vivo imaging by high-speed spectral optical coherence tomography,”
Opt. Lett., 28
(19), 1745
–1747
(2003). https://doi.org/10.1364/OL.28.001745 0146-9592 Google Scholar
V. X. D. Yang,
M. L. Gordon,
B. Qi,
J. Pekar,
S. Lo,
E. Seng-Yue,
A. Mok,
B. C. Wilson, and
I. A. Vitkin,
“High speed, wide velocity dynamic range Doppler optical coherence tomography (Part I): system design, signal processing, and performance,”
Opt. Express, 11
(7), 794
–809
(2003). 1094-4087 Google Scholar
A. V. Zvyagin,
J. B. FitzGerald,
K. K. M. B. D. Silva, and
D. D. Sampson,
“Real-time detection technique for Doppler optical coherence tomography,”
Opt. Lett., 25
(22), 1645
–1647
(2000). https://doi.org/10.1364/OL.25.001645 0146-9592 Google Scholar
A. F. Fercher,
C. K. Hitzenberger,
G. Kamp, and
S. Y. El-Zaiat,
“Measurement of intraocular distances by backscattering spectral interferometry,”
Opt. Commun., 117
(1–2), 43
–48
(1995). https://doi.org/10.1016/0030-4018(95)00119-S 0030-4018 Google Scholar
G. Häusler and
M. W. Lindner,
“‘Coherence’ radar and ‘spectral radar’—New tools for dermatological diagnosis,”
J. Biomed. Opt., 3
(1), 21
–31
(1998). https://doi.org/10.1117/1.429899 1083-3668 Google Scholar
R. A. Leitgeb,
W. Drexler,
A. Unterhuber,
B. Hermann,
T. Bajraszewski,
T. Le,
A. Stingl, and
A. F. Fercher,
“Ultrahigh-resolution Fourier domain optical coherence tomography,”
Opt. Express, 12
(10), 2156
–2165
(2004). https://doi.org/10.1364/OPEX.12.002156 1094-4087 Google Scholar
M. Wojtkowski,
V. J. Srinivasan,
T. H. Ko,
J. G. Fujimoto,
A. Kowalczyk, and
J. S. Duker,
“Ultrahigh-resolution, high-speed, Fourier domain optical coherence tomography and methods for dispersion compensation,”
Opt. Express, 12
(11), 2404
–2422
(2004). https://doi.org/10.1364/OPEX.12.002404 1094-4087 Google Scholar
C. Xu,
C. Vinegoni,
T. S. Ralston,
W. Luo,
W. Tan, and
S. A. Boppart,
“Spectroscopic spectral-domain optical coherence microscopy,”
Opt. Lett., 31
(8), 1079
–1081
(2006). https://doi.org/10.1364/OL.31.001079 0146-9592 Google Scholar
S. H. Yun,
G. J. Tearney,
B. E. Bouma,
B. H. Park, and
J. F. de Boer,
“High-speed spectral-domain optical coherence tomography at wavelength,”
Opt. Express, 11
(30), 3598
–3604
(2003). 1094-4087 Google Scholar
P. Blazkiewicz,
M. Gourlay,
J. R. Tucker,
A. D. Rakic, and
A. V. Zvyagin,
“Signal-to-noise ratio study of full-field Fourier-domain optical coherence tomography,”
Appl. Opt., 44
(36), 7722
–7729
(2005). https://doi.org/10.1364/AO.44.007722 0003-6935 Google Scholar
J. F. de Boer,
B. Cense,
B. H. Park,
M. C. Pierce,
G. J. Tearney, and
B. E. Bouma,
“Improved signal-to-noise ratio in spectral-domain compared with time-domain optical coherence tomography,”
Opt. Lett., 28
(21), 2067
–2069
(2003). https://doi.org/10.1364/OL.28.002067 0146-9592 Google Scholar
R. Leitgeb,
C. K. Hitzenberger, and
A. F. Fercher,
“Performance of fourier domain vs. time domain optical coherence tomography,”
Opt. Express, 11
(8), 889
–894
(2003). 1094-4087 Google Scholar
S. R. Chinn,
E. A. Swanson, and
J. G. Fujimoto,
“Optical coherence tomography using a frequency-tunable optical source,”
Opt. Lett., 22
(5), 340
–342
(1997). 0146-9592 Google Scholar
M. A. Choma,
M. V. Sarunic,
C. Yang, and
J. A. Izatt,
“Sensitivity advantage of swept source and Fourier domain optical coherence tomography,”
Opt. Express, 11
(18), 2183
–2189
(2003). 1094-4087 Google Scholar
B. Golubovic,
B. E. Bouma,
G. J. Tearney, and
J. G. Fujimoto,
“Optical frequency-domain reflectometry using rapid wavelength tuning of a laser,”
Opt. Lett., 22
(22), 1704
–1706
(1997). 0146-9592 Google Scholar
U. H. P. Haberland,
V. Blazek, and
H. J. Schmitt,
“Chirp optical coherence tomography of layered scattering media,”
J. Biomed. Opt., 3
(3), 259
–266
(1998). https://doi.org/10.1117/1.429889 1083-3668 Google Scholar
R. Huber,
M. Wojtkowski,
J. G. Fujimoto,
J. Y. Jiang, and
A. E. Cable,
“Three-dimensional and C-mode OCT imaging with a compact, frequency swept laser source at ,”
Opt. Express, 13
(26), 10523
–10538
(2005). https://doi.org/10.1364/OPEX.13.010523 1094-4087 Google Scholar
R. Huber,
M. Wojtkowski, and
J. G. Fujimoto,
“Fourier Domain Mode Locking (FDML): A new laser operating regime and applications for optical coherence tomography,”
Opt. Express, 14
(8), 3225
–3237
(2006). https://doi.org/10.1364/OE.14.003225 1094-4087 Google Scholar
R. Huber,
D. C. Adler, and
J. G. Fujimoto,
“Buffered Fourier domain mode locking: unidirectional swept laser sources for optical coherence tomography imaging at 370,000 lines/s,”
Opt. Lett., 31
(20), 2975
–2977
(2006). https://doi.org/10.1364/OL.31.002975 0146-9592 Google Scholar
S. Moon and
D. Y. Kim,
“Ultra-high-speed optical coherence tomography with a stretched pulse supercontinuum source,”
Opt. Express, 14
(24), 11575
–11584
(2006). https://doi.org/10.1364/OE.14.011575 1094-4087 Google Scholar
M. D. Kulkarni and
J. A. Izatt,
“Digital signal processing in optical coherence tomography,”
Proc. SPIE, 2981 2
–6
(1997). https://doi.org/10.1117/12.274307 0277-786X Google Scholar
H. E. Larsen,
R. T. Nilsson,
L. Thrane,
D. K. Kristensen,
F. Pedersen,
T. M. Jorgensen,
A. Gualdino, and
P. E. Andersen,
“Optical Doppler coherence tomography based on a field-programmable gate array,”
Proc. SPIE, 5690 263
–270
(2005). https://doi.org/10.1117/12.592760 0277-786X Google Scholar
S. Yan,
D. Piao,
Y. Chen, and
Q. Zhu,
“DSP-based optical Doppler tomography system for real-time signal processing,”
Proc. SPIE, 4956 187
–196
(2003). https://doi.org/10.1117/12.477860 0277-786X Google Scholar
S. Yan,
D. Piao,
Y. Chen, and
Q. Zhu,
“Digital signal processor-based real-time optical Doppler tomography system,”
J. Biomed. Opt., 9
(3), 454
–463
(2004). https://doi.org/10.1117/1.1695409 1083-3668 Google Scholar
T. S. Ralston,
J. A. Mayen,
D. L. Marks, and
S. A. Boppart,
“Real-time digital design for an optical coherence tomography acquisition and processing system,”
Proc. SPIE, 5324 159
–170
(2004). https://doi.org/10.1117/12.527829 0277-786X Google Scholar
A. W. Schaefer,
J. J. Reynolds,
D. L. Marks, and
S. A. Boppart,
“Real-time digital signal processing-based optical coherence tomography and Doppler optical coherence tomography,”
IEEE Trans. Biomed. Eng., 51
(1), 186
–190
(2004). https://doi.org/10.1109/TBME.2003.820369 0018-9294 Google Scholar
V. Westphal,
S. Yazdanfar,
A. M. Rollins, and
J. A. Izatt,
“Real-time, high velocity-resolution color Doppler optical coherence tomography,”
Opt. Lett., 27
(1), 34
–36
(2002). https://doi.org/10.1364/OL.27.000034 0146-9592 Google Scholar
M. Pircher,
E. Goetzinger,
R. Leitgeb, and
C. K. Hitzenberger,
“Three dimensional polarization sensitive OCT of human skin in vivo,”
Opt. Express, 12
(14), 3236
–3244
(2004). https://doi.org/10.1364/OPEX.12.003236 1094-4087 Google Scholar
B. M. Hoeling,
A. D. Fernandez,
R. C. Haskell,
E. Huang,
W. R. Myers,
D. C. Petersen,
S. E. Ungersma,
R. Wang,
M. E. Williams, and
S. E. Fraser,
“An optical coherence microscope for 3-dimensional imaging in developmental biology,”
Opt. Express, 6
(7), 136
–146
(2000). 1094-4087 Google Scholar
P. L. Hsiung,
Y. Chen,
T. H. Ko,
J. G. Fujimoto,
C. J. S. de Matos,
S. V. Popov,
J. R. Taylor, and
V. P. Gapontsev,
“Optical coherence tomography using a continuous-wave, high-power, Raman continuum light source,”
Opt. Express, 12
(22), 5287
–5295
(2004). https://doi.org/10.1364/OPEX.12.005287 1094-4087 Google Scholar
C. Xi,
D. L. Marks,
D. S. Parikh,
L. Raskin, and
S. A. Boppart,
“Structural and functional imaging of 3D microfluidic mixers using optical coherence tomography,”
Proc. Natl. Acad. Sci. U.S.A., 101
(20), 7516
–7521
(2004). https://doi.org/10.1073/pnas.0402433101 0027-8424 Google Scholar
C. Xi,
D. Marks,
S. Schlachter,
W. Luo, and
S. A. Boppart,
“High-resolution three-dimensional imaging of biofilm development using optical coherence tomography,”
J. Biomed. Opt., 11
(3), 034001
(2006). https://doi.org/10.1117/1.2209962 1083-3668 Google Scholar
T. S. Ralston,
D. L. Marks,
P. S. Carney, and
S. A. Boppart,
“Inverse scattering for optical coherence tomography,”
J. Opt. Soc. Am. A Opt. Image Sci. Vis, 32
(5), 1027
–1037
(2006). 1084-7529 Google Scholar
T. S. Ralston,
D. L. Marks,
P. S. Carney, and
S. A. Boppart,
“Interferometric synthetic aperture microscopy,”
Nat. Phys., 3
(2), 129
–134
(2007). 1745-2473 Google Scholar
T. S. Ralston,
D. L. Marks,
S. A. Boppart, and
P. S. Carney,
“Inverse scattering for high-resolution interferometric microscopy,”
Opt. Lett., 31
(24), 3585
–3587
(2006). https://doi.org/10.1364/OL.31.003585 0146-9592 Google Scholar
D. L. Marks,
T. S. Ralston,
P. S. Carney, and
S. A. Boppart,
“Inverse scattering for rotationally scanned optical coherence tomography,”
J. Opt. Soc. Am. A Opt. Image Sci. Vis, 23
(10), 2433
–2439
(2006). 1084-7529 Google Scholar
D. L. Marks,
T. S. Ralston,
S. A. Boppart, and
P. S. Carney,
“Inverse scattering for frequency-scanned full-field optical coherence tomography,”
J. Opt. Soc. Am. A Opt. Image Sci. Vis, 24
(4), 1034
–1041
(2007). 1084-7529 Google Scholar
W. Drexler,
“Ultrahigh-resolution optical coherence tomography,”
J. Biomed. Opt., 9
(1), 47
–74
(2004). https://doi.org/10.1117/1.1629679 1083-3668 Google Scholar
A. F. Fercher,
C. K. Hitzenberger,
M. Sticker,
E. Moreno-Barriuso,
R. Leitgeb,
W. Drexler, and
H. Sattmann,
“A thermal light source technique for optical coherence tomography,”
Opt. Commun., 185
(1), 57
–64
(2000). https://doi.org/10.1016/S0030-4018(00)00986-X 0030-4018 Google Scholar
L. Vabre,
A. Dubois, and
A. C. Boccara,
“Thermal-light full-field optical coherence tomography,”
Opt. Lett., 27
(7), 530
–532
(2002). https://doi.org/10.1364/OL.27.000530 0146-9592 Google Scholar
G. Moneron,
A. C. Boccara, and
A. Dubois,
“Stroboscopic ultrahigh-resolution full-field optical coherence tomography,”
Opt. Lett., 30
(11), 1351
–1353
(2005). 0146-9592 Google Scholar
A. Baumgartner,
C. K. Hitzenberger,
H. Sattmann,
W. Drexler, and
A. F. Fercher,
“Signal and resolution enhancements in dual beam optical coherence tomography of the human eye,”
J. Biomed. Opt., 3
(1), 45
–54
(1998). https://doi.org/10.1117/1.429861 1083-3668 Google Scholar
T. H. Ko,
D. C. Adler,
J. G. Fujimoto,
D. Mamedov,
V. Prokhorov,
V. Shidlovski, and
S. Yakubovich,
“Ultrahigh resolution optical coherence tomography imaging with a broadband superluminescent diode light source,”
Opt. Express, 12
(10), 2112
–2119
(2004). https://doi.org/10.1364/OPEX.12.002112 1094-4087 Google Scholar
A. Unterhuber,
B. Považay,
B. Hermann,
H. Sattmann,
A. Chavez-Pirson, and
W. Drexler,
“In vivo retinal optical coherence tomography at -enhanced penetration into the choroid,”
Opt. Express, 13
(9), 3252
–3258
(2005). https://doi.org/10.1364/OPEX.13.003252 1094-4087 Google Scholar
A. M. Kowalevicz,
T. Ko,
I. Hartl,
J. G. Fujimoto,
M. Pollnau, and
R. P. Salathé,
“Ultrahigh resolution optical coherence tomography using a superluminescent light source,”
Opt. Express, 10
(7), 349
–353
(2002). 1094-4087 Google Scholar
B. Bouma,
G. J. Tearney,
S. A. Boppart,
M. R. Hee,
M. E. Brezinski, and
J. G. Fujimoto,
“High-resolution optical coherence tomographic imaging using a mode-locked Ti:Al2O3 laser source,”
Opt. Lett., 20
(13), 1486
–1488
(1995). 0146-9592 Google Scholar
W. Drexler,
U. Morgner,
F. X. Kärtner,
C. Petris,
S. A. Boppart,
X. D. Li,
E. P. Ippen, and
J. G. Fujimoto,
“In vivo ultrahigh-resolution optical coherence tomography,”
Opt. Lett., 24
(17), 1221
–1223
(1999). 0146-9592 Google Scholar
A. Unterhuber,
B. Považay,
B. Hermann,
H. Sattmann,
W. Drexler,
V. Yakovlev,
G. Tempea,
C. Schubert,
E. M. Anger,
P. K. Ahnelt,
M. Stur,
J. E. Morgan,
A. Cowey,
G. Jung,
T. Le, and
A. Stingl,
“Compact, low-cost Ti:Al2O3 laser for in vivo ultrahigh-resolution optical coherence tomography,”
Opt. Lett., 28
(11), 905
–907
(2003). https://doi.org/10.1364/OL.28.000905 0146-9592 Google Scholar
A. M. Kowalevicz,
T. R. Schibli,
F. X. Kärtner, and
J. G. Fujimoto,
“Ultralow-threshold Kerr-lens mode-locked Ti:Al2O3 laser,”
Opt. Lett., 27
(22), 2037
–2039
(2002). https://doi.org/10.1364/OL.27.002037 0146-9592 Google Scholar
S. Bourquin,
A. D. Aguirre,
I. Hartl,
P. Hsiung,
T. H. Ko,
J. G. Fujimoto,
T. A. Birks,
W. J. Wadsworth,
U. Bünting, and
D. Kopf,
“Ultrahigh resolution real time OCT imaging using a compact femtosecond Nd:Glass laser and nonlinear fiber,”
Opt. Express, 11
(24), 3290
–3297
(2003). 1094-4087 Google Scholar
P. C. Wagenblast,
T. H. Ko,
J. G. Fujimoto,
F. X. Kaertner, and
U. Morgner,
“Ultrahigh-resolution optical coherence tomography with a diode-pumped broadband laser,”
Opt. Express, 12
(14), 3257
–3263
(2004). https://doi.org/10.1364/OPEX.12.003257 1094-4087 Google Scholar
K. Bizheva,
B. Považay,
B. Hermann,
H. Sattmann,
W. Drexler,
M. Mei,
R. Holzwarth,
T. Hoelzenbein,
V. Wacheck, and
H. Pehamberger,
“Compact, broad-bandwidth fiber laser for sub- axial resolution optical coherence tomography in the wavelength region,”
Opt. Lett., 28
(9), 707
–709
(2003). https://doi.org/10.1364/OL.28.000707 0146-9592 Google Scholar
S. A. Boppart,
B. E. Bouma,
C. Pitris,
J. F. Southern,
M. E. Brezinski, and
J. G. Fujimoto,
“In vivo cellular optical coherence tomography imaging,”
Nat. Med., 4
(7), 861
–865
(1998). 1078-8956 Google Scholar
B. E. Bouma,
G. J. Tearney,
I. P. Bilinsky,
B. Golubovic, and
J. G. Fujimoto,
“Self-phase-modulated Kerr-lens mode-locked Cr:forsterite laser source for optical coherence tomography,”
Opt. Lett., 21
(22), 1839
–1841
(1996). 0146-9592 Google Scholar
D. L. Marks,
A. L. Oldenburg,
J. J. Reynolds, and
S. A. Boppart,
“Study of an ultrahigh-numerical-aperture fiber continuum generation source for optical coherence tomography,”
Opt. Lett., 27
(22), 2010
–2012
(2002). https://doi.org/10.1364/OL.27.002010 0146-9592 Google Scholar
Y. Wang,
I. Tomov,
J. S. Nelson,
Z. Chen,
H. Lim, and
F. Wise,
“Low-noise broadband light generation from optical fibers for use in high-resolution optical coherence tomography,”
J. Opt. Soc. Am. A Opt. Image Sci. Vis, 22
(8), 1492
–1499
(2005). 1084-7529 Google Scholar
J. K. Ranka,
R. S. Windeler, and
A. J. Stentz,
“Visible continuum generation in air-silica microstructure optical fibers with anomalous dispersion at ,”
Opt. Lett., 25
(1), 25
–27
(2000). https://doi.org/10.1364/OL.25.000025 0146-9592 Google Scholar
I. Hartl,
X. D. Li,
C. Chudoba,
R. K. Ghanta,
T. H. Ko,
J. G. Fujimoto,
J. K. Ranka, and
R. S. Windeler,
“Ultrahigh-resolution optical coherence tomography using continuum generation in an air-silica micro structure optical fiber,”
Opt. Lett., 26
(9), 608
–610
(2001). https://doi.org/10.1038/35069118 0146-9592 Google Scholar
A. D. Aguirre,
N. Nishizawa,
J. G. Fujimoto,
W. Seitz,
M. Lederer, and
D. Kopf,
“Continuum generation in a novel photonic crystal fiber for ultrahigh resolution optical coherence tomography at and ,”
Opt. Express, 14
(3), 1145
–1160
(2006). https://doi.org/10.1364/OE.14.001145 1094-4087 Google Scholar
G. Humbert,
W. J. Wadsworth,
S. G. Leon-Saval,
J. C. Knight,
T. A. Birks,
P. S. J. Russell,
M. J. Lederer,
D. Kopf,
K. Wiesauer,
E. I. Breuer, and
D. Stifter,
“Supercontinuum generation system for optical coherence tomography based on tapered photonic crystal fibre,”
Opt. Express, 14
(4), 1596
–1603
(2006). https://doi.org/10.1364/OE.14.001596 1094-4087 Google Scholar
H. Lim,
Y. Jiang,
Y. Wang,
Y. C. Huang,
Z. Chen, and
F. W. Wise,
“Ultrahigh-resolution optical coherence tomography with a fiber laser source at ,”
Opt. Lett., 30
(10), 1171
–1173
(2005). https://doi.org/10.1364/OL.30.001171 0146-9592 Google Scholar
B. Považay,
K. Bizheva,
A. Unterhuber,
B. Hermann,
H. Sattmann,
A. F. Fercher,
W. Drexler,
A. Apolonski,
W. J. Wadsworth,
J. C. Knight,
P. S. J. Russell,
M. Vetterlein, and
E. Scherzer,
“Submicrometer axial resolution optical coherence tomography,”
Opt. Lett., 27
(20), 1800
–1802
(2002). https://doi.org/10.1364/OL.27.001800 0146-9592 Google Scholar
B. Považay,
K. Bizheva,
B. Hermann,
A. Unterhuber,
H. Sattmann,
A. F. Fercher,
W. Drexler,
C. Schubert,
P. K. Ahnelt,
M. Mei,
R. Holzwarth,
W. J. Wadsworth,
J. C. Knight, and
P. S. J. Russel,
“Enhanced visualization of choroidal vessels using ultrahigh resolution ophthalmic OCT at ,”
Opt. Express, 11
(17), 1980
–1986
(2003). 1094-4087 Google Scholar
Y. Wang,
Y. Zhao,
J. S. Nelson,
Z. Chen, and
R. S. Windeler,
“Ultrahigh-resolution optical coherence tomography by broadband continuum generation from a photonic crystal fiber,”
Opt. Lett., 28
(3), 182
–184
(2003). https://doi.org/10.1038/nature01298 0146-9592 Google Scholar
S. H. Yun,
G. J. Tearney,
J. F. de Boer,
N. Iftimia, and
B. E. Bouma,
“High-speed optical frequency-domain imaging,”
Opt. Express, 11
(22), 2953
–2963
(2003). 1094-4087 Google Scholar
S. H. Yun,
G. J. Tearney,
J. F. de Boer, and
B. E. Bouma,
“Pulsed-source and swept-source spectral-domain optical coherence tomography with reduced motion artifacts,”
Opt. Express, 12
(23), 5614
–5624
(2004). https://doi.org/10.1364/OPEX.12.005614 1094-4087 Google Scholar
M. A. Choma,
K. Hsu, and
J. A. Izatt,
“Swept source optical coherence tomography using an all-fiber ring laser source,”
J. Biomed. Opt., 10
(4), 044009
(2005). https://doi.org/10.1117/1.1961474 1083-3668 Google Scholar
R. Huber,
M. Wojtkowski,
K. Taira,
J. G. Fujimoto, and
K. Hsu,
“Amplified, frequency swept lasers for frequency domain reflectometry and OCT imaging: design and scaling principles,”
Opt. Express, 13
(9), 3513
–3528
(2005). https://doi.org/10.1364/OPEX.13.003513 1094-4087 Google Scholar
Y. Yasuno,
V. D. Madjarova,
S. Makita,
M. Akiba,
A. Morosawa,
C. Chong,
T. Sakai,
K. P. Chan,
M. Itoh, and
T. Yatagai,
“Three-dimensional and high-speed swept-source optical coherence tomography for in vivo investigation of human anterior eye segments,”
Opt. Express, 13
(26), 10652
–10664
(2005). https://doi.org/10.1364/OPEX.13.010652 1094-4087 Google Scholar
E. C. W. Lee,
J. F. de Boer,
M. Mujat,
H. Lim, and
S. H. Yun,
“In vivo optical frequency domain imaging of human retina and choroid,”
Opt. Express, 14
(10), 4403
–4411
(2006). https://doi.org/10.1364/OE.14.004403 1094-4087 Google Scholar
H. Lim,
M. Mujat,
C. Kerbage,
E. C. W. Lee,
Y. Chen,
T. C. Chen, and
J. F. de Boer,
“High-speed imaging of human retina in vivo with swept-source optical coherence tomography,”
Opt. Express, 14
(26), 12902
–12908
(2006). https://doi.org/10.1364/OE.14.012902 1094-4087 Google Scholar
H. Lim,
J. F. de Boer,
B. H. Park,
E. C. W. Lee,
R. Yelin, and
S. H. Yun,
“Optical frequency domain imaging with a rapidly swept laser in the range,”
Opt. Express, 14
(13), 5937
–5944
(2006). https://doi.org/10.1364/OE.14.005937 1094-4087 Google Scholar
|