|
|
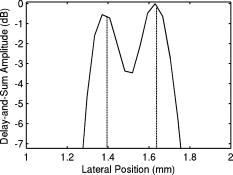
1.IntroductionPhotoacoustic tomography (PAT) has emerged as a promising biomedical imaging modality due to its ability to produce ultrasound-resolution images using intrinsic optical contrast.1 As with other modalities, animal models provide a controlled environment for development and evaluation of the technology due to the ability to control the disease stage and perform extensive histological validation. The most common configurations used for PAT investigations involve scanning of a single wideband point detector or highly focused single-element transducer. The sample or detector is rotated to produce a complete 2-D or 3-D measurement surface. Measurement times of minutes to hours are generally required with these approaches, however. Control of animal physiological parameters, motion, and anesthesia during these extended measurement periods can present significant challenges for obtaining quality images. Furthermore, stimulus-response measurements, such as those employed with functional brain imaging, are not realistic without real-time or near-real-time data-acquisition rates. Ultrasound transducer arrays with linear 2, 3, 4, 5, 6, 7 and curved8, 9 geometries have been employed for PAT imaging to reduce imaging times and address clinical applications. The majority of these systems, however, have been optimized for imaging of human subjects (large size and field of view, low operating frequencies) or limited to phantom studies. Only the curved array system of Kruger 10 was specifically designed and used for small animal imaging. This system featured a 128-element curved array that formed an open-capped spherical surface with sample rotation. Extensive images of various organs from sacrificed mice were presented. Image quality was compromised, however, due to nonoptimal matching of the transducer frequency to the dimensions of key anatomical features such as blood vessels. In this paper, we present characterization and ex vivo imaging results for a curved array photoacoustic system optimized for high-resolution tomographic small animal imaging. The system employs a higher operating frequency transducer for resolution of fine features such as brain vasculature while retaining high sensitivity for deeper imaging. Combined with a 128-channel acquisition system constructed by our group, complete 2-D scans can be completed in less than . High-fidelity imaging demands equal attention to experimental parameters such as the target size, orientation, and geometry as to the system hardware and software. For example, the spectrum of emitted acoustic frequencies is dependent on both the illumination pulse and the absorption distribution. This is in contrast to ultrasound imaging, where the response is determined by the narrowband transmitter excitation. Because most tissues exhibit spatial frequencies ranging from low-frequency background to high-frequency features such as blood vessels, the photoacoustic signals possess significant spectral energy outside the bandwidth of even state-of-the-art wideband transducers. Second, the (nearly) simultaneous excitation of the tissue due to the short optical pulses and the high speed of light produce phase-coherent acoustic signals. The generated ultrasonic waves preserve this coherency throughout propagation to the detectors. As a result, absorption features extending greater than a half wavelength act as phased antennas and can exhibit directional radiation patterns. This concentration of photoacoustic energy can be oriented out of the field of view and limit visibility. Reconstruction errors, both qualitative and quantitative, also occur when the energy is oriented within the field of view. Transducer arrays can capture a greater fraction of directional photoacoustic emission from flat, specular interfaces relative to rounded isotropic features that radiate uniformly. As a result, relative contrast and quantitative imaging can be biased toward highly oriented absorption profiles. Third, practical considerations limit the achievable measurement surface for capturing the photoacoustic signals. Clinical applications, for example, provide limited access due to physical constraints (e.g., interfering tissue) or limited penetration of the optical signals due to absorption and scattering. Furthermore, cost and size can further restrict the measurement aperture. Focused transducers are often employed to improve the detection sensitivity and the resulting acoustic response profile additionally limits the measurement volume. The combination of these factors, collectively known as the limited-view problem, limits the available photoacoustic signals for imaging and introduces geometric and quantitative artifacts. The impacts of limited measurement apertures on photoacoustic reconstruction have been extensively studied recently 11, 12, 13, 14 with emphasis on identification of sufficiency criteria and simulation results. These studies, however, considered only square and circular targets and provided limited experimental validation. Furthermore, the effect of transducer frequency response on quantitative reconstruction was not examined. In this paper, we present the first systematic evaluation of a PAT system with near-real-time capability considering both transducer and target effects. We begin with a detailed review of the system design and characterization in terms of resolution, field of view, and sensitivity. We then examine the impact of absorption geometry and orientation in determining the radiation profiles and the resulting 2-D image reconstructions. The influence of transducer frequency response is also evaluated and the variations with feature size are correlated with an analytic model of the photoacoustic signal. The impacts of these effects and the system imaging fidelity are illustrated through tomographic imaging of ex vivo mouse brain vasculature. Finally, we address the implications of these observations for experimental and system design. 2.Materials and Methods2.1.System DescriptionFigure 1 depicts the block diagram of our tomographic photoacoustic system. A Ti:sapphire (Symphotics TII, LS-2134) laser optically pumped with a -switched Nd:YAG laser (Symphotics-TII, LS-2122) delivers 8 to 12-ns pulses at with a wavelength tunable from 700 to . The beam is diverged with a planoconcave lens and homogenized by a circular profile engineered diffuser (ED1-S20, ThorLabs, Newton, New Jersey) to produce a uniform approximately 50-mm-diam illumination at the sample stage. The laser light is positioned at the center of curvature of our transducer and the beam strikes the stage orthogonal to the imaging plane of the transducer for maximum uniformity. Fig. 1Block diagram of the curved array photoacoustic system. Definitions: MUX=multiplexer, FPGA=field programmable gate array, MSPS DAQ=megasamples/second data acquisition system. The details of the system design and operation are described in the text.  The transducer consists of 128 elements arranged along a 90-deg arc with a 25-mm radius of curvature (Fig. 2 ). The array was designed as a building block for a 512-element closed-ring system. The array was custom fabricated by Imasonic, Inc. (Besançon, France) using piezocomposite technology for high sensitivity and SNR. The center frequency of the array is with a reception bandwidth of greater than 80%. Individual elements feature an elevation height of with an azimuthal pitch of one wavelength and a kerf of . The array elements are formed in the elevation direction to produce an arc-shaped focus at from the transducer without the distortions and loss of sensitivity encountered with external acoustic lens materials. The small of 1.9 produces an elevation resolution of approximately at the focal depth and about at the annular ring center. Electronic-beam formation provides in-plane (azimuthal) dynamic focusing. In the full 512-element configuration, this focus results in a uniform approximately 16-mm-diam central imaging region. Fig. 2(a) Side view illustration of the elevation focus of the curved array transducer. The piezocomposite transducer material for each element is directly shaped in the elevation direction ( radius) and the elements are arranged in a 25-mm radius arc in azimuth for tomographic imaging. (b) Top view depiction of the elevation focus arc from the azimuthal center. 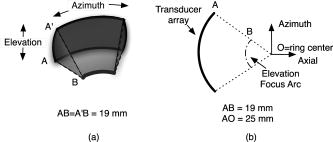 Sixteen receiver boards, each supporting eight channels, amplify the signals from the transducer elements with programmable gains of 50 to . Within each board, dedicated receiver electronics (AD8099) individually amplify the eight photoacoustic channels with a 20-dB gain before multiplexing (MAX4051) into a single channel. The multiplexed signal is subsequently amplified with an AD604 amplifier with programmable gain of 30 to and output with a coaxial connection to the data acquisition system. Several design features were introduced to achieve high system sensitivity. First, cabling between the transducer and amplification electronics is maintained below to minimize signal loss. Furthermore, front-end amplifiers for nonselected channels are automatically disabled to reduce crosstalk below the system noise level. Crosstalk from adjacent channels in the receiver electronics was not observable above the noise floor up to input signal levels of , approximately greater than the signal required to saturate the receiver for a typical gain of . The mapping of the transducer elements to the 16 receiver boards ensures that for each acquisition sampled channels are spaced by four channels. Crosstalk in the data acquisition system was at . SNRs of 95 and were measured over a 2- to 8-MHz frequency range for gains of 54 and , respectively. Due to the multiplexing, eight laser firings are required to generate a single 128-channel capture. Four custom 4-channel PCI (peripheral component interconnect) cards, developed in our laboratory, sample the 16 outputs for each firing at with 12-bit precision. Each acquisition board preprocesses the signals through transformer coupling (Mini-Circuits T1-1T) and a 15-MHz antialiasing filter (MCL PLP-15). Each channel is independently sampled with an AD9236 analog-to-digital converter (DAC) operating at and the samples are accumulated in a static random access memory (SRAM) (CY7C1041CV33-10, Cypress Semiconductor, San Jose, California). At each laser firing, 4096 samples are acquired by each DAC, corresponding to of data, and all eight captures (corresponding to eight channels) are stored in the SRAM. After acquisition of all 128 channels of data, the host computer configures the PCI interface (PCI 9054, PLX Technology, Inc., Sunnyvale, California) for transfer over PCI to the host computer at . The data are subsequently saved to disk for postprocessing. The acquisition rate is , leading to a maximum rate of . All samples were mounted on a rotary stage positioned at the center of curvature that was turned in 90-deg increments to emulate the response of a full ring. The temperature was continuously monitored with a digital thermometer for precise determination of the sound speed. Without corrections using this measurement, temperature variations throughout the duration of experimentation produced registration errors of up to in 360-deg tomographic imaging. The registration of the rotation center with respect to the transducer arc was calibrated using a rotated pencil lead phantom prior to each set of measurements. The effects of residual registration errors were corrected in the imaging software through adjustments of the location and orientation of the transducer relative to each point in the imaging zone for each of the four rotations. Images were reconstructed using delay-and-sum or the exact backprojection algorithm of Xu and Wang.15 Throughout this paper, delay-and-sum refers to backprojection reconstruction without the far-field time-derivative term. The implementation of the algorithm included Wiener deconvolution of the per-channel impulse response from the measured data. The Wiener deconvolution was performed in the Frequency domain using the fast Fourier transform16 (FFT): where is the deconvolved estimate of the true pressure, is the complex conjugate of the Fourier transform of the system impulse response, is the Fourier transform of the measured pressure, and is the noise variance of the system. The additive noise term in the denominator limits the scaling of noisy data for frequencies with low response (small ). This contribution was measured from a channel without photoacoustic excitation and assumed equal for all channels. In addition, theoretically calculated corrections for the directivity of individual elements, assuming a rectangular element profile, were incorporated.2.2.System CharacterizationThe in-plane resolution of the system was evaluated by imaging isolated and closely spaced black nylon threads. The threads were suspended perpendicular to the imaging plane and at a slight angle to the incident optical beam. The resolution for isolated threads was calculated by subtraction of the thread diameter from the point spread function measured using delay-and-sum and backprojection algorithms for both quarter and full ring configurations. Alternatively, pairs of threads were arranged with a tapered separation in the elevation plane and the height was then adjusted so that critical (Rayleigh) resolution of the two threads was observed. System sensitivity determines the response uniformity and the maximum imaging depth in turbid media. A 0.5-mm pencil lead tip was mounted on a plastic optical fiber and translated across the transducer field of view. The absorbed energy value, obtained using a delay-and-sum algorithm, was normalized to the peak value to represent the relative sensitivity within the imaging plane. The absolute sensitivity was evaluated by imaging of 1-cm-long, (inner diameter) polyethylene tubing filled with blood at a radiant energy fluence of . A 1:6 milk/water solution covered the tubes to depths ranging from 3 to . The calibrated optical absorption and reduced scattering coefficients were and (typical values for biological tissues) at the 780-nm operating wavelength using a frequency-domain diffusive optical system. 2.3.Investigation of Transducer and Feature Geometry EffectsTo examine the effects of target geometry and orientation, India-ink-filled polyethylene tubes with an inner diameter of were used as contrast targets. The tubes, with lengths ranging from 1.5 to , were hot glued onto the tips of 1-mm plastic optical fiber for mounting. The corresponding aspect ratios of these structures were 3:1 to 18:1. The tubes were oriented parallel to the transducer face in the azimuthal plane for the quarter ring configuration. A vertically mounted black nylon thread served as an isotropic source with a 1:1 aspect ratio. The radiation patterns for all targets were evaluated using the dominant derivative (far-field) term of the backprojection formula for each element. The radiation amplitude versus direction was plotted to yield the photoacoustic radiation pattern as a function of the target aspect ratio. In a second set of experiments examining the effect of target orientation, the 5.5-mm-long and tube was fixed at the elevation focus of the quarter circle configuration. The tube was oriented parallel, perpendicular, and at to the azimuthal axis. The reconstructed images were quantitatively analyzed for measurement apertures ranging from 32 to 512 elements. The analysis considered the reconstructions with and without the backprojection three-dimensional (3-D) solid angle weighting factor ( in the expression of Xu and Wang). To simplify interpretation of results with varying measurement aperture, the 2-D (“solid”) angle formed by the transducer measurement surface in the azimuthal plane is used for all plot axes even though the true 3-D solid angle is used for normalization. Proper matching of the generated photoacoustic frequency spectrum to the transducer response is essential for high sensitivity and minimum distortion. The photoacoustic impulse response of the transducer array was measured by illumination of the transducer element faces with isotropically scattered light. Figure 3a depicts the amplitude frequency response along with the theoretical spectra for uniformly absorbing spheres with radii of 0.1 and . The spectra were obtained from FFT of the expressions derived by Diebold 17 The center frequency and 3-dB bandwidth of the mainlobe of the 0.2-mm-diam sphere match the transducer response well. In contrast, the 1-mm-diam sphere possesses a narrower spectrum located near the low-frequency edge of the transducer response. As a result, the system should exhibit an optimum sensitivity for objects with dimensions near 0.2 to . Fig. 3(a) Comparison of transducer element impulse response (solid) and the frequency spectrums of solid absorbing spheres with diameters of 0.2 and (coarse and fine dashed curves, respectively). The transducer response was measured by illumination of the transducer surface diffusely with the laser beam. (b) Experimental configuration for evaluation of target size effects. Selective illumination of a uniform ink-dyed gelatin cylinder produced absorption disks with diameters ranging from 0.2 to . The mask was translated to maintain the same position within the transducer field. The radiant energy fluence was .  To quantitatively evaluate the effect of target size on the reconstructed absorption value, a 25-mm uniform ink-dyed gelatin phantom was employed. Cylindrical disk targets with diameters ranging from 0.2 to were produced by selective illumination through an absorbing mask [Fig. 3b]. The circular absorption profile was located near the ring center of curvature to minimize interelement variations due to the elevation focus and images were based on 128 elements (quarter ring). The mean value and normalized standard deviation (=standard deviation/mean) of the disk absorption profile were calculated from the backprojection reconstructions with solid angle weighting. Deconvolution of the system impulse response (via Wiener or standard means) is often used to equalize the phase and amplitude characteristics of the transducer elements. The effects of this signal processing in modifying the size response were investigated by incorporating the phase or the amplitude and phase components [full ] of a Wiener deconvolution filter. The phase contribution of the Wiener filter accounts for the phase and time delay associated with the transducer and receiver electronics and thus properly sets the “time zero” for calculations of delays from the transducer elements to all imaging points as well as any phase distortion introduced by the system. The amplitude contribution of the filter accounts for the bandpass frequency-dependent amplitude response of the complete system and attempts to recover the response that would be measured by a system with a flat frequency response. The filter parameters limit deconvolution filtering to components of the spectrum with frequencies between approximately and to reduce amplification of noise. 2.4.Ex Vivo ImagingAxial plane images of brain vasculature have become a widely used standard for demonstration of photoacoustic imaging quality due to the comparatively high contrast and defined anatomy.18, 19, 20 We imaged the brains of freshly sacrificed 50-g white mice with intact skull and skin (hair removed). The mice were acquired from the University of Connecticut Office of Animal Research and were euthanized in accordance with procedures of the University Institutional Animal Care and Use Committee as well as the National Institutes of Health. The mice were mounted in a 1-in.-diam PVC pipe with the skull level with the imaging plane. Full tomographic images were obtained at depths spanning over using a combination of linear (elevation) and rotational (azimuth) motors. Incident power levels of the light were maintained below . To evaluate the system sensitivity with biological samples, the mice were submerged in turbid milk/water solution with measured and to depths up to . No averaging was performed for the measurements except for the 2.5-cm depth where 16 averages were used for image formation. For these measurements, the 13-mm incident optical beam was not homogenized and therefore provided a radiant energy fluence of . 3.Results3.1.Resolution, Imaging Uniformity, and SensitivityThe measured point spread function for the system with the quarter ring configuration using the isolated thread was 150 (axial) and (azimuth), in good agreement with the theoretical value of (azimuth) for an effective aperture of and center frequency of . The ability to resolve closely spaced features is demonstrated by Fig. 4 , which depicts the Rayleigh criterion image of two threads spaced apart. In the full-ring configuration, the resolution is determined by the location of the target within the cylindrical measurement surface with minimum tangential resolution at the center.21 The 6-dB full width at half maximum for this case was approximately when the thread was positioned at the center of curvature, closely matching the thread diameter. Figure 5 presents the relative sensitivity over the transducer field of view. The response exhibits a broad peak located at the elevation focal depth. The flatness of the response produces a uniform approximately 1.6-cm-diam imaging region about the lateral radius of curvature as the sample is rotated. Figure 6 depicts the high absolute sensitivity of the system as measured by the peak-to-peak photoacoustic signal voltage for a blood tube versus the depth of the overlying milk/water solution. At , the signal amplitude for a single transducer element after 70-dB gain is still greater than [Fig. 6d], over 3 times the noise floor. The corresponding image, shown in Fig. 6b, illustrates the good contrast obtainable at this depth and highlights the suitability for deep in vivo imaging. Fig. 5Measured system sensitivity over the transducer field of view for the 128-element quarter-ring configuration. The transducer is located at the top at axial and the dashed arc depicts the elevation focal depth for the full ring configuration. All energy values have been normalized to the peak value. 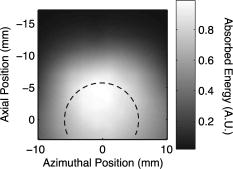 Fig. 6(a) Variation of peak-to-peak photoacoustic voltage for a single transducer element after 70-dB amplification versus submersion depth of a blood tube in a solution. The radiant energy fluence was at a 780-nm wavelength. (b) Image of the tube at depth. Signals from a single element at (c) and (d) depths without averaging.  3.2.Effects of Target Geometry and Transducer Characteristics on Quantitative ImagingFigure 7 depicts the photoacoustic radiation patterns for the black thread and ink tubes. The 90-deg position corresponds to the origin of the measurement aperture (azimuthal center of transducer face) for the following reconstructions. The radiation is isotropically uniform for the cylindrical thread with progressive directionality with increased tube aspect ratio. The asymmetry in the sidelobes oriented along 0 and is due to acoustic interference from the mounting fiber and glue. For ratios greater than 5:1, the photoacoustic energy is concentrated in a narrow beam perpendicular to the tube surface (90 and ) along its length similar to a dipole antenna. This high directionality results in a small number of array elements with a significant contribution to the reconstruction. Fig. 7Measured radiation patterns for black thread (1:1) and tubes with lengths corresponding to aspect ratios of 5:1 to 18:1.  Figure 8a depicts the mean reconstructed values of absorption within the tubes normalized to their respective volumes as a function of the 2-D measurement aperture. For this figure, the solid angle weighting factor of the backprojection formulation was set to unity to display the unnormalized accumulation of photoacoustic energy with the number of transducer elements. Consistent with the radiation patterns, the accumulated backprojection terms increase linearly and monotonically with the 2-D angle for the cylindrical thread. With increasing aspect ratio (length), the energy contributions occur predominantly at the ends of the scan range resulting in a sigmoidal characteristic. Incorporation of the solid angle weighting factor [Fig. 8b] produces a monotonically decreasing estimated absorption for each case. All absorption values have been normalized to the full value. For smaller apertures, the reconstruction overestimates the true absorption value for all sample geometries. Fig. 8Plots of estimated mean absorption values for black thread and ink tubes (a) without and (b) with solid angle normalization using the backprojection algorithm. The 2-D solid angle refers to the measurement aperture in the imaging plane.  The directional radiation of high-aspect-ratio absorption features can concentrate the photoacoustic energy to positions near or outside the imaging field. Figure 9 depicts the measured mean absorption value for a 5.5-mm-long ink-filled tube oriented parallel, perpendicular, and at to the azimuthal center of the transducer. The estimated absorption values shown in Fig. 9a obtained without solid-angle weighting illustrate the more progressive increase in captured photoacoustic energy with the nonparallel orientations as the aperture expands to include the directional emission. Incorporation of the solid angle weighting [Fig. 9b] reveals that the gradual increase in captured photoacoustic energy with measurement aperture results in reduced sensitivity to the size of the total transducer surface. In contrast, the high-aspect-ratio feature oriented such that the photoacoustic energy concentrates at the aperture center exhibits a high sensitivity to the measurement surface area. The estimated absorbed energies are therefore overestimated with the weighting factor normalization unless larger apertures are used. The weighting factor intrinsically assumes isotropic radiation and hence linearly increasing total photoacoustic energy with measurement aperture. The weighting factor therefore cannot properly scale the absorbed energy value in the presence of directional radiation. Fig. 9Graphs of mean estimated absorption values for 5.5-mm-long ink filled tube oriented at different angles with respect to the transducer (a) with and (b) without the solid angle normalization factor using the backprojection algorithm. The 2-D solid angle refers to the measurement aperture in the imaging plane.  Figure 10a shows the effect of target size by means of the normalized mean absorption value for disk absorption profiles with diameters ranging from 0.2 to . The data have been normalized to the largest estimated absorption. The graph indicates a response peaked at the 0.3- to 0.4-mm diameter due to the bandpass transducer response with a sharp rolloff for smaller and larger sizes. The optimum diameter is slightly larger than that for a spherical target as suggested by the transducer frequency response , due to the lower photoacoustic frequency spectrum for cylindrical versus spherical sources. A 3-dB criterion (0.7071) for maximum amplitude variations translates to a target size range of about 100 to , less than a 10-fold range, with a bias toward the system resolution of . Although this result is specific to our system, state-of-the-art wideband transducers possess bandwidths of 60 to 80% and should exhibit similar amplitude responses. Separation of the phase (solid) and amplitude-plus-phase (dashed) deconvolution-filtering effects indicates some improvement in relative sensitivity for the larger diameters by equalization. Note that the two sets of curves are separately normalized with respect to feature size as the amplitude equalization produces higher absolute reconstructed values. Fig. 10Graphs of (a) mean value and (b) normalized standard deviation for absorbing gelatin cylinders with diameters from 0.2 to . The solid curves designate results using the phase of the Wiener deconvolution factor [set in Eq. 1] and the dashed curves correspond to results obtained using both the amplitude and phase of . 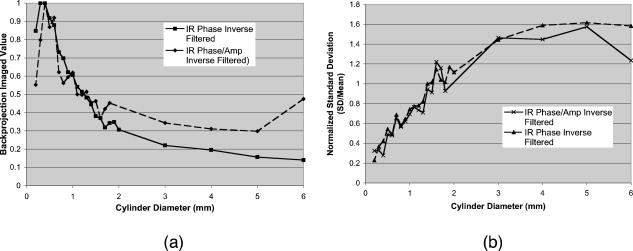 Figure 10b depicts the corresponding variations in uniformity for the absorption cylinders. For both phase and amplitude-plus-phase deconvolution filtering, the normalized standard deviation declines monotonically with feature size. This improvement reflects the better matching of the frequency spectrum to the bandpass transducer response and concomitant fidelity in reproducing the uniform absorption profile. Images of cylinders with diameters near the peak of the response (and resolution of the system) were uniform, whereas larger diameters were dominated by their edges, appearing as thin rings along the border of the absorption region due to the loss of low-frequency content. 3.3.Imaging of Mouse Brain VasculatureTo demonstrate the impact of feature geometry and orientation with a realistic specimen, we imaged the vasculature of a mouse brain in axial view. Figure 11 depicts the image centered on a plane approximately below the surface for measurement apertures corresponding to 90, 145, 180, 270, and . The center of the aperture is located at the top and center of all images. Due to the position of the sample within the uniform imaging region bordered by the elevation focus ring, the images include contributions from 0.6 (at elevation focus) to of depth (at center). Major vessels ranging from 50 to (determined independently from microscopy) in diameter are discernible in the image demonstrating the high resolution of the system for in vivo applications. Although vasculature in the caudal and rostral portions of the brain was resolved, vessels of similar size in the intervening portion of the brain exhibited very poor contrast or were not visible. This is due to their location in the central heavily defocused region of the imaging space (away from elevation focus) so that only the largest veins (e.g., superior sagittal) had sufficient contrast. For example, images performed on other mice with offset positions demonstrated resolution of vessels in this region at the expense of vasculature in the cerebellum and rostral locations. Fig. 11Ex vivo images of mouse brain in axial view with varying measurement apertures: 90, 145, 180, 270, and . The radiant energy fluence of the diffused beam was approximately . An open-skull photograph of a representative mouse brain used in the experiments is provided for comparison.  In the quarter-ring configuration, only features parallel to the azimuth axis, such as the superior sagittal sinuses, are discernible. As the measurement aperture expands to 145 or , vessels at oblique angles such as the transverse sinuses appear but with reduced intensity farther from the transducer, consistent with the results of the oriented blood tubing emissions. Only when the measurement surface closes to 270 or are the vessels oriented parallel to the axial dimension resolved. The full-ring configuration, however, is required to correctly identify the relative absorptions of the various features as evidenced by the dominance of the confluence of sinuses over the feeding transverse sinuses. Figure 12 shows images for the full-ring configuration with intervening tissue-simulating turbid media. Although the feature definition for this specimen exhibited poorer contrast than the previous example, resolution of the vasculature was maintained at effective depths greater than . Fig. 12Ex vivo images of mouse brain vasculature with intact skin and skull submerged in water and 1.7 and of turbid milk/water medium with and . The radiant energy fluence of the diffused 750-nm beam was approximately for water and for the turbid solution. (a) Images using a common absorption scale and (b) images independently normalized to facilitate visualization of vasculature. 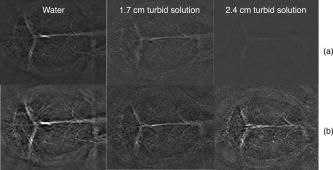 4.Discussion4.1.Imaging Performance and Full Ring DesignThe ex vivo imaging results demonstrate the capability of our photoacoustic system to simultaneously achieve fast imaging times with high sensitivity and resolution. These characteristics are essential for in vivo quantitative functional imaging where control of physiological parameters or motion is difficult. To our knowledge, this is the first demonstration of the resolution of sub- features with only intrinsic biological contrast at tissue-equivalent depths greater than . Large penetration depths have been predicted from modeling analyses,8 but experimental investigations have required use of extrinsic contrast agents for similar conditions.22, 23 The increased imaging depth is due to the high sensitivity of the piezocomposite material, large array element surface area, moderate transducer frequency, and deeper penetration of the near infrared wavelengths. With sufficient contrast beyond , PAT becomes attractive as a high-resolution alternative or adjunct imaging modality to conventional diffuse optical tomography systems. Higher resolution images have been reported using short wavelength excitation for improved vasculature contrast and either high-frequency focused transducers,24 broadband hydrophones,25 or optical Fabry-Pérot ultrasound transducers.20 While these approaches provide optimum performance for targeted applications, the use of commercial ultrasound transducer array technology in this system not only facilitates development of a practical clinical technology but also enables better translation of imaging performance with small animals to humans, where arrays will be required. The 128-channel system described here represents a building block for a 512-element closed-ring system. We are developing this next-generation configuration to enable single-capture, complete 2-D tomographic imaging of small animals without the necessity of subject rotation and fast 3-D imaging by simple linear translation. 4.2.Implications of Target and Transducer Characteristics on System DesignThe experimental results highlight the strong dependences of quantitative reconstructed values on feature geometry, orientation, and size, even when possessing equal absorption properties. The error reduces dramatically as the measurement aperture approaches half-view , in agreement with earlier studies.14 Absorption overestimates of greater than 30 to 60%, however, are possible in clinical applications (e.g., breast or epithelial tissues) that limit the aperture to approximately or less due to physical constraints. Because of the coherent and directional nature of the photoacoustic radiation, the amount of overestimation will depend on the solid angle subtended by the feature of interest and therefore will vary across the imaging field of view. Calibration cannot fully correct for the variations due to spatial location and feature geometry variances. The implication of this fact is that features within the imaging field will produce differing contrast and reconstructed absorption values that can vary by up to 30% or more for measurement surfaces less than . Model-based reconstruction algorithms that can account for the photoacoustic propagation and transducer detection may provide a means for improving quantitative robustness and accuracy. Although larger measurement apertures can minimize the effect of sample feature orientation and geometry, feature size variations presents a greater technological challenge. Figure 8 illustrated that the variations due to aperture sizes is approximately a factor of 2, whereas sensitivity differences of 5 or more are possible for realistic targets. As a result, the center frequencies of transducers must be carefully chosen so that the resolution is approximately 5 to 10 times the largest feature to be imaged to reduce variations to less than 30% for state-of-the-art wideband transducers. Uniform performance for a wider range of dimensions will require ultrawideband transducers8 or, as with ultrasound imaging, multiple transducer heads with differing frequency response characteristics may be employed to improve imaging accuracy.18 The variations with feature size will still be present for each transducer, however, complicating interpretations of contrast and quantitative parameters. 5.ConclusionWe developed and characterized a curved array photoacoustic system optimized for tomographic imaging of small animals. The system features resolutions below , high sensitivity, and can provide complete 2-D images in . Ex vivo imaging demonstrated the definition of fine vasculature in mouse brains to tissue-equivalent depths greater than . Using this system, the strong variations in reconstruction accuracy with feature size and orientation were experimentally quantified. The results highlight the need for improved reconstruction algorithms that account for the coherency of photoacoustic generation and the importance of ultrawideband transducer frequency detection. AcknowledgmentsWe acknowledge partial support from National Institutes of Health (NIH) grants NIH R01NS46214 and NIH R01EB002136. ReferencesM. H. Xu and
L. H. V. Wang,
“Photoacoustic imaging in biomedicine,”
Rev. Sci. Instrum., 77
(4), 041101
(2006). https://doi.org/10.1063/1.2195024 0034-6748 Google Scholar
V. Kozhushko,
T. Khokhlova,
A. Zharinov,
I. Pelivanov,
V. Solomatin, and
A. Karabutov,
“Focused array transducer for two-dimensional optoacoustic tomography,”
J. Acoust. Soc. Am., 116
(3), 1498
–1506
(2004). https://doi.org/10.1121/1.1781710 0001-4966 Google Scholar
R. A. Kruger,
W. L. Kiser,
D. R. Reinecke, and
G. A. Kruger,
“Thermoacoustic computed tomography using a conventional linear transducer array,”
Med. Phys., 30
(5), 856
–860
(2003). https://doi.org/10.1118/1.1565340 0094-2405 Google Scholar
S. Park,
S. Mallidi,
A. Karpiouk,
S. Alyamov, and
S. Emelianov,
“Photoacoustic imaging using array transducer,”
Proc. SPIE, 6437 643714
(2007). 0277-786X Google Scholar
B. Yin,
D. Xing,
Y. Wang,
Y. Zeng,
Y. Tan, and
Q. Chen,
“Fast photoacoustic imaging system based on 320-element linear transducer array,”
Phys. Med. Biol., 49
(7), 1339
–1346
(2004). https://doi.org/10.1088/0031-9155/49/7/019 0031-9155 Google Scholar
R. J. Zemp,
R. Bitton,
M. L. Li,
K. K. Shung,
G. Stoica, and
L. V. Wang,
“Photoacoustic imaging of the microvasculature with a high-frequency ultrasound array transducer,”
J. Biomed. Opt., 12
(1), 010501
(2007). https://doi.org/10.1117/1.2709850 1083-3668 Google Scholar
J. J. Niederhauser,
M. Jaeger,
R. Lemor,
P. Weber, and
M. Frenz,
“Combined ultrasound and optoacoustic system for real-time high-contrast vascular imaging in vivo,”
IEEE Trans. Med. Imaging, 24
(4), 436
–440
(2005). https://doi.org/10.1109/TMI.2004.843199 0278-0062 Google Scholar
A. A. Oraevsky and
A. Karabutov,
“Ultimate sensitivity of time-resolved opto-acoustic detection,”
Proc. SPIE, 3916 228
–239
(2000). 0277-786X Google Scholar
R. A. Kruger,
W. L. Kiser,
D. R. Reinecke,
G. A. Kruger, and
K. D. Miller,
“Thermoacoustic molecular imaging of small animals,”
Mol. Imaging, 2
(2), 113
–122
(2003). https://doi.org/10.1162/153535003322331993 1535-3508 Google Scholar
R. Kruger,
W. Kiser,
D. Reinecke, and
G. Kruger,
“Molecular imaging with thermoacoustic computed tomography,”
Med. Phys., 30
(6), 1542
–1154
(2003). 0094-2405 Google Scholar
M. A. Anastasio and
J. Zhang,
“Image reconstruction in photoacoustic tomography with truncated cylindrical measurement apertures,”
Proc. SPIE, 6086 608610
(2006). https://doi.org/10.1117/12.647623 0277-786X Google Scholar
S. K. Patch,
“Thermoacoustic tomography—consistency conditions and the partial scan problem,”
Phys. Med. Biol., 49
(11), 2305
–2315
(2004). https://doi.org/10.1088/0031-9155/49/11/013 0031-9155 Google Scholar
X. Pan,
Y. Zou, and
M. A. Anastasio,
“Data redundancy and reduced scan reconstruction in reflectivity tomography,”
IEEE Trans. Image Process., 12
(7), 784
–795
(2003). https://doi.org/10.1109/TIP.2003.814244 1057-7149 Google Scholar
Y. Xu,
L. V. Wang,
G. Ambartsoumian, and
P. Kuchment,
“Reconstructions in limited-view thermoacoustic tomography,”
Med. Phys., 31
(4), 724
–733
(2004). https://doi.org/10.1118/1.1644531 0094-2405 Google Scholar
M. Xu and
L. V. Wang,
“Universal back-projection algorithm for photoacoustic computed tomography,”
Phys. Rev. E, 71
(1 Pt 2), 016706
(2005). https://doi.org/10.1103/PhysRevE.71.016706 1063-651X Google Scholar
R. Gonzales,
R. Woods, and
S. Eddins, Digital Image Processing Using Matlab, Prentice Hall, Upper Saddle River, NJ (2003). Google Scholar
G. J. Diebold,
T. Sun, and
M. I. Khan,
“Photoacoustic monopole radiation in one, two, and three dimensions,”
Phys. Rev. Lett., 67
(24), 3384
–3387
(1991). https://doi.org/10.1103/PhysRevLett.67.3384 0031-9007 Google Scholar
G. Ku,
X. Wang,
G. Stoica, and
L. V. Wang,
“Multiple-bandwidth photoacoustic tomography,”
Phys. Med. Biol., 49
(7), 1329
–1338
(2004). https://doi.org/10.1088/0031-9155/49/7/018 0031-9155 Google Scholar
L. Zeng,
X. Da,
H. Gu,
D. Yang,
S. Yang, and
L. Xiang,
“High antinoise photoacoustic tomography based on a modified filtered backprojection algorithm with combination wavelet,”
Med. Phys., 34
(2), 556
–563
(2007). https://doi.org/10.1118/1.2426406 0094-2405 Google Scholar
E. Zhang,
J. Laufer, and
P. Beard,
“Three-dimensional photoacoustic imaging of vascular anatomy in small animals using an optical detection system,”
Proc. SPIE, 6437 64370S
(2007). https://doi.org/10.1117/12.700128 0277-786X Google Scholar
M. Xu and
L. V. Wang,
“Analytic explanation of spatial resolution related to bandwidth and detector aperture size in thermoacoustic or photoacoustic reconstruction,”
Phys. Rev. E, 67
(5 Pt 2), 056605
(2003). https://doi.org/10.1103/PhysRevE.67.056605 1063-651X Google Scholar
G. Ku and
L. V. Wang,
“Deeply penetrating photoacoustic tomography in biological tissues enhanced with an optical contrast agent,”
Opt. Lett., 30
(5), 507
–509
(2005). https://doi.org/10.1364/OL.30.000507 0146-9592 Google Scholar
X. Wang,
G. Ku,
M. A. Wegiel,
D. J. Bornhop,
G. Stoica, and
L. V. Wang,
“Noninvasive photoacoustic angiography of animal brains in vivo with near-infrared light and an optical contrast agent,”
Opt. Lett., 29
(7), 730
–732
(2004). https://doi.org/10.1364/OL.29.000730 0146-9592 Google Scholar
H. F. Zhang,
K. Maslov,
G. Stoica, and
L. V. Wang,
“Functional photoacoustic microscopy for high-resolution and noninvasive in vivo imaging,”
Nat. Biotechnol., 24
(7), 848
–851
(2006). https://doi.org/10.1038/nbt1220 1087-0156 Google Scholar
L. Xiang,
D. Xing,
H. Gu,
D. Yang,
S. Yang,
L. Zeng, and
W. Cheng,
“Real-time optoacoustic monitoring of vascular damage during photodynamic therapy treatment of tumor,”
J. Biomed. Opt., 12
(1), 014001
(2007). https://doi.org/10.1117/1.2437752 1083-3668 Google Scholar
|