|
|
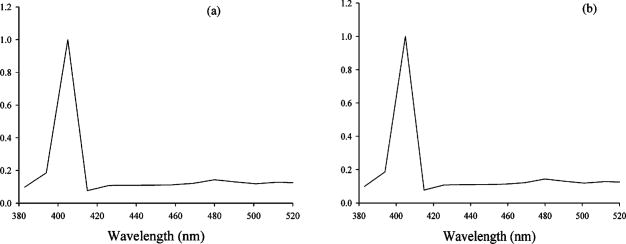
1.IntroductionCollagen forms the structural network of the extracellular matrix (ECM) in tissue and is the most abundant protein in vertebrates. Fibrillar collagen type I consists of a triple helical macromolecule that self-assembles into fibrils and fibers. The molecular organization, amount, and distribution of fibrillar collagen type I are important for the structural and mechanical properties of tissue and play an important role in wound healing and aging and in diseases such as cancer, atherosclerosis, and diabetes.1, 2, 3, 4 Collagen fiber type I has the crystalline and noncentrosymmetric properties required for generating the second-harmonic signal.5, 6, 7, 8 Second-harmonic generation (SHG) is an optically nonlinear coherent process where the emitted light has exactly half the wavelength of the two incident photons.9, 10 The energy is thus conserved, and no absorption occurs. This makes SHG a powerful tool for detecting and visualizing the 3-D collagen network without any exogenous labeling, and no photodamage takes place. Indeed, SHG combined with two-photon microscopy has been used to study collagen type I, both in tissue sections11 and intravitally,12, 13 and may be used for noninvasive tissue characterization and high-resolution imaging. Nonoptical techniques such as x-ray, magnetic resonance imaging (MRI), ultrasound, and optical techniques such as optical coherence tomography (OCT) are also noninvasive and are used for 3-D imaging of tissue. However, in these cases, the resolution is not sufficient to visualize cellular structures and collagen fibers. Histopathology in combination with light microscopy has been a traditional method in cancer diagnosis, although new molecular markers have refined the diagnostic work in recent years. The expression of HER2 in breast cancer is one example.14 Collagen may be an additional cancer marker, as the content and distribution of collagen in cancer tissue are different from corresponding normal tissue due to remodeling of the ECM during the malignant process.15, 16, 17 Metalloproteinases play an important role in degrading collagen type IV in the basement membrane and collagen type I and other collagen types in the ECM in order to promote invasion and metastasis of cancer cells.18 The purpose of the present work was to exploit SHG-based laser scanning imaging to characterize the content, structure, and distribution of collagen in frozen sections from various tumor tissues growing in mice (osteosarcoma, breast carcinoma, and melanoma) and corresponding normal mice tissues (femur, breast, and skin/dermis) to investigate whether the SHG signature of collagen is a potential diagnostic marker. Collagen type I was characterized both qualitatively and quantitatively by determining the collagen density and calculating structural material parameters such as the second-order nonlinear optical susceptibility and an anisotropy parameter. Large differences were observed in the content and distribution of collagen type I, and significant differences were found in the determined structural material properties. 2.Theory2.1.Second-Order Nonlinear Optical SusceptibilityThe polarization induced by an electromagnetic field can be expressed in a power series of the electric field strength : where ’th component of the induced polarization, vacuum permittivity, and is the ’th order susceptibility and is a tensor. is termed the second-order nonlinear optical susceptibility. It is a third-rank tensor and can be used to characterize the collagen structure. can be expressed by the third-rank -tensor given by . The effective -value is written as , where is a unit vector describing the electric field or polarization field of the light wave . The tensor related to SHG, , reflects the symmetrical and nonlinear optical properties of the material. Assuming that collagen has -symmetry along the fiber19, 20 and assuming Kleinman symmetry,21 the coefficient for parallel polarization relative to the polarization of the laser beam is given by:where is the angle in the -plane between the collagen fiber axis and the electric field, and is the angle between the fiber and the -plane as described by Erikson 22 Maximum SHG intensity is obtained when the collagen fibers are aligned parallel to the polarization direction of the laser beam, i.e., , and the collagen fibers are lying in the -plane, i.e., . In this case, , and this condition therefore allows determination of independent of the value of .The SHG signal intensity for a focused Gaussian laser beam is related to the coefficient by:20, 23 where is a parameter containing fundamental constants and beam characteristics such as the Rayleigh radius and the fundamental frequency, is the laser light intensity, is the refractive index at frequency , is the effective second-order nonlinear susceptibility, represents the value of at the entrance to the nonlinear medium, is the length of the medium, and is the phase mismatch.The coefficient of collagen can be determined based on the SHG signal intensity from collagen under , conditions and using a reference sample with known coefficient. crystal was used as a reference sample. The SHG signal intensity was measured as the average intensity in a given region of interest (ROI). The for collagen was determined by: where the thickness of the crystal and the tissue section was and , respectively. The other parameters were , , , , , where (Refs. 20, 24.2.2.Polarization of the SHG SignalThe efficiency of SHG light is sensitive to the collagen orientation when the incident light is polarized,25 and hence the polarization measurement of SHG light is effective in probing the collagen orientation in the tissues.7, 26 To quantify the collagen orientation in tissue, an empirical anisotropy parameter was introduced:27 where and were taken as the SHG intensity parallel and perpendicular to the polarization of the incident laser beam, respectively. The anisotropy parameter was used to quantify the order of alignment of fibers, ranging from 1 for completely ordered fibers to 0 for fibers not aligned at all.3.Material and Methods3.1.Sample PreparationTo determine the optical susceptibility of collagen in tissue sections, a -cut single-crystal (1691-5 Inrad Northvale, New Jersey) of known second-order nonlinear susceptibility was used as a reference sample. Four human cell lines were grown as xenografts in -old female athymic BALB/c nu/nu mice (Taconic, M&B, Ry, Denmark), by injecting suspension of cells subcutaneously. Two osteosarcoma cell lines OHS28 and KPDX,29 one melanoma cell line FME,30 all established at the Norwegian Radium Hospital, and one breast tumor line MCF7,31 from the American Type Culture Collection, were used. The xenografts were grown for , and tumor size varied from . The animals were kept under pathogen-free conditions at a constant temperature of , at a humidity of 30 to 50%, and allowed food and water ad libitum. All animal experiments were carried out with ethical committee approval. The mice were sacrificed by cervical dislocation and the tumor excised. Corresponding normal tissue was prepared from femur, dermis of the skin, and breast. The femurs were fixed in 4% paraformaldehyde and decalcified in 10% EDTA for before freezing. All tissue samples were embedded in Tissue Tec (O.C.T, Histolab Products, Gøteborg, Sweden) and frozen in liquid , and -thick sections were mounted on glass slides. Two sections per tissue were imaged, and the sections were obtained from two different mice. The sections were taken approximately and into the tumor and normal tissue, respectively. 3.2.Staining with Picrosirius RedSections were stained with Picrosirius red (Polyscience, Inc., Warrington, Pennsylvania) for collagen detection. In our procedure, Harris Hematoxylin (Sigma, St. Louis, Missouri) did not stain the nucleus and was therefore omitted. The sections were rinsed in water and incubated with 0.5% aqueous solution of Picrosirius red for at room temperature before rinsing with 0.5% acetic acid (Merck, Darmstadt, Germany). The sections were imaged shortly after staining without any fixation. 3.3.Two-Photon MicroscopyThe SHG measurements were performed using a confocal laser scanning microscope (CLSM) (LSM Meta 510, Zeiss, Germany) and a Plan-Neofluar objective. Samples were illuminated by a Ti:Sapphire laser (Mira Model 900-F, Coherent, Inc., Laser Group, Santa Clara, California) pumped with a Verdi laser. The SHG signal intensity was previously shown22 to yield the largest values between and the samples were excited at . The laser beam had a pulse width of approximately at the repetition rate. Maximum laser output at the objective was . This effect was used for imaging tumor tissue, whereas approximately 70% and 40% laser output were used for imaging normal tissue and the crystal, respectively. A bandpass filter was placed in front of the photomultiplier tube (PMT) detector. The SHG signal was detected in the forward direction. This setup was used to image the collagen distribution. To determine the nonlinear second-order optical susceptibility and the empirical anisotropy parameter, a rotation table was used and the sample was rotated in the -plane with the excitation laser light propagating along the axis, as described by Erikson 22 The sample was rotated one full revolution, and the SHG signal was imaged at every . SHG signal intensity was measured as described in Sec. 3.5. A linear polarizer (analyzer) was placed after the sample, between the condenser and the detector, oriented parallel to the linearly polarized laser light. The Rayleigh radius of the laser beam was determined as previously described22 and found to be for the objective used. The reference SHG signal became saturated when using the same laser power as for . To obtain the correct reference value of in Eq. 4, a nonlinear calibration curve was established. The calibration curve was based on measurements of by varying laser power until signal saturation occurred and subsequently extrapolating the established calibration curve to the intensity corresponding to collagen laser power. In order to determine the location in tissue from where the SHG signal emerged, the tissue was also imaged by light microscopy using differential interference contrast. The CLSM was equipped with a Meta detector, which uses a grating to disperse the emission light into 32 different channels at intervals in the spectral range from . The Meta detector, which operates in reflection mode, was used to study SHG spectra and spectra of two-photon excited autofluorescence. 3.4.Polarization MicroscopyThe Picrosirius red–stained samples were imaged with an Olympus microscope using a objective. Images were collected with a digital camera (Nikon Coolpix 995). Picrosirius red is known to strongly enhance the birefringence of collagen fibers and fibrils.32 To reveal this birefringence, the images were recorded without or with a polarizer in front of the sample and an analyzer placed after the sample perpendicular to the polarizer. In this way, the total collagen and the collagen that possesses birefringence could be compared. 3.5.Image AnalysisThresholding was performed to exclude background and noise. The threshold was set to a level where only one out of a thousand pixels in a collagen-free background image would be visible. The percentage collagen area represents the collagen density and was determined as the number of pixels in a thresholded image (i.e., SHG pixels) divided by the total number of pixels in the same image with no . Collagen fiber thickness was determined by placing a line perpendicular to collagen fibers in the -plane, and a specially written program analyzed the intensity plot and calculated the fiber thickness, i.e., full width at half maximum (FWHM). The program was developed as a macro in ImageJ (ImageJ, NIH, Bethesda, Maryland). Determination of the second-order nonlinear optical susceptibility ( coefficient) required placing a ROI. Each ROI had to be manually marked in every thresholded image after the increment. Great care was taken when placing the ROI to be sure that it was placed in the same area as the previous image. Only circular ROIs were used. The size of the ROI was chosen to contain only well-ordered, collagen fibers. Fibers not aligned will give maximum intensity at different azimuth angles, resulting in low -values. Average SHG intensity within the ROIs was calculated at every increment. Maximum SHG intensity was obtained when the collagen fibers were oriented parallel to the polarization of the laser beam, and this condition determined . The maximum SHG intensity measured was used to determine from Eq. 4. SHG intensities obtained within the ROIs were transferred to MATLAB (The MATH Works, Natick, Massachusetts) for further analysis and for generating the polar plot by fitting Eq. 2 to experimental data, using the calculated as an input parameter and as a free parameter. A program for automatically placing the ROI in the images was developed. The program was based on the Stackreg plug-in for ImageJ.33 With some adjustment, this program rotated and aligned images automatically before placing the ROI. However, values obtained with the manually and automatically placed ROI showed some discrepancy; therefore, the more reliable manually placed ROIs were used. Determination of the empirical anisotropy parameter was based on ROIs automatically placed in the image. Manually and automatically placed ROIs gave the same anisotropy values. Automatic placing of square ROIs allowed measurements of the entire image by placing the ROIs next to each other. The alignments of the fibers and thus the anisotropy parameter will be sensitive to the size of the area investigated. ROIs of sizes , , , and were examined, and corresponding anisotropy values calculated. ROIs with no collagen content were rejected by thresholding. The SHG intensities parallel and perpendicular to the polarization of the incident laser beam were transferred to MATLAB for calculation of the anisotropy parameter [Eq. 5]. 4.Results4.1.General Description of the Collagen StructureImage visualization of the collagen type I network in tumor tissue by the SHG signal revealed few collagen fibers, being both sparsely and heterogeneously distributed. At the periphery of the tumor, a dense cap of collagen could be observed. The cap was formed by long fibers oriented along the outer periphery and shorter fragments facing inward. The collagen fibers in the ECM farther away from the cap appeared short and straight and formed single fibers or small bundles. The apparent length of fibers depended on the angle between the fiber and the -plane. A typical distribution of collagen fiber type I with corresponding percentage of the area covered by collagen (collagen density) is shown in Fig. 1 for a melanoma. The osteosarcomas and breast carcinomas showed similar distributions. The collagen cap in the periphery represented approximately 50 to 60% of the area in this region, whereas only 0 to 9% of the section contained collagen farther into the tumor. The sparsely detected collagen network may be due partly to the SHG signal intensity not being sufficiently strong to be detected. Fig. 1The distribution of collagen from the tumor periphery to the central part of a melanoma tissue section. (a) SHG image. (b) The collagen density measured as the % area containing SHG signal of the tissue section. 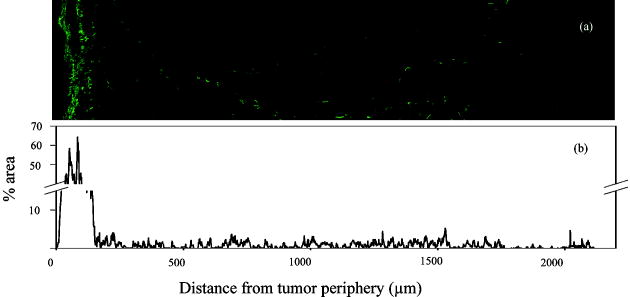 In order to visualize not only collagen type I but also other forms of collagen, the tissue sections were stained with Picrosirius red, which also binds to less crystalline collagen such as types III and V (Ref. 5) and weakly to nonfibrillar collagen type II (Ref. 34) and type IV (Ref. 35). Picrosirius red is an acidic dye, and collagen being rich in basic amino acids strongly reacts with Picrosirius red. It also has the property of enhancing the birefringence of collagen fibers. Figure 2 compares the collagen network visualized by SHG [panels (a),(d),(g)], collagen–Picrosirius red birefringence by polarization microscopy [panels (b),(e),(h)] and collagen–Picrosirius red by bright-field microscopy [panels (c),(f),(i)]. Osteosarcoma, breast carcinoma, and melanoma are shown in the upper, middle, and lower rows, respectively. In the bright-field image, collagen appeared red, whereas in polarization microscopy, the thickness of collagen fibers determined the color of Picrosirius red. Bright yellow to red corresponded to thick collagen fibers, whereas thin collagen fibers were displayed as green-yellowish.34 All three types of images displayed collagen type I fibers clearly, and demonstrated that most of the collagen is of type I. The birefringence images showed additionally some straight, thin green fibers that were not detected by SHG, and these were probably collagen type III. The red dots shown in the birefringence image may be noncrystalline collagen fibers, collagen fragments, or vertical fibers not being able to form an SHG signal [ , Eq. 2]. Fig. 2The distribution of collagen in tumor tissue. Left column [(a), (d), and (g)] shows SHG images; middle column [(b),(e), and (h)] shows birefringence images of Picrosirius red stain collagen; and right column [(c), (f), and (i)] shows bright-field images of Picrosirius red stain collagen. The three tumor types OHS osteosarcoma [(a), (b), and (c)], MCF7 breast carcinoma [(d), (e), and (f)], and FME melanoma [(g), (h), and (i)] are shown.  Normal tissue showed a different collagen content and distribution, and each of the three tissue types studied had their own characteristics (Fig. 3 ). In general, normal tissue had much more collagen type I fibers, covering approximately 80% of the area in bone and 40% in breast and skin, and no collagen cap was observed. The structure of collagen fibers reflects physical properties of the tissue. In bone, which has to withstand high tensile stress, the collagen fibers formed a rather compact network with long collagen fibers aligned parallel to the axis of the femur. In dermis of the skin, which is elastic and flexible, the collagen fibers appeared somewhat crimped and formed a loose network of large bundles of collagen, with areas without visible collagen fibers between. The dermal network did not have any specific orientation. Breast tissue also being elastic had a collagen network organization similar to skin, forming a loose network of bundles of collagen fibers. These bundles of collagen fibers were smaller and more crimped than in skin. Fig. 3The distribution of collagen in normal tissue. Left column [(a), (d), and (g)] shows SHG images; middle column [(b), (e), and (h)] shows birefringence images of Picrosirius red stain collagen; and right column [(c), (f), and (i)] shows bright-field images of Picrosirius red stain collagen. The three normal tissue types bone/femur [(a), (b), and (c)], breast tissue [(d), (e), and (f)], and skin/dermis [(g), (h), and (i)] are shown. 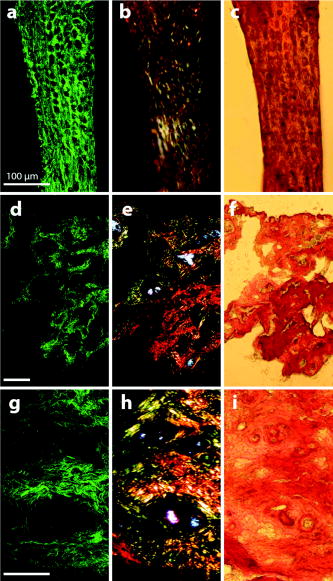 The birefringence images of normal tissues also revealed some fibers not detected by SHG. In addition, white spots surrounded by red circular fibers were seen. This may be blood vessels surrounded by collagen type III (Ref. 11). The diameters of collagen fibers in the various tissues were compared. No significant differences were found. The fibers had average diameters ranging from in the different tissues. However, it should be noted that in diffraction-limited optical microscopy, the resolution is given by the wavelength and numerical aperture (NA) of the objective, and for and , the resolution is approximately ; thus, smaller fibers and fibrils cannot be resolved. 4.2.Emission SpectraThe spectra associated with the SHG signal and autofluorescence induced by two-photon absorption were compared for the various tissues (Fig. 4 ). Each spectrum was obtained from a small ROI in an image. All spectra revealed the characteristic strong SHG signal as a narrow peak with maximum intensity at , which corresponds to half the excitation wavelength. At longer wavelengths, the emission associated with fluorescence showed a broad feature of much lower intensity. This demonstrated that SHG was the dominating feature of the recorded images. At longer wavelengths, the emission spectra were broad with low intensity. This autofluorescence is mainly due to collagen and elastin, which are the two major proteins extracellularly contributing to autofluorescence,36 and some cellular contributions may also be included. Spectra from normal and malignant breast tissues are shown in Figs. 4a and 4b, respectively, and the spectra are almost identical. Corresponding spectra from the other tissues were similar. SHG gives clearly a higher signal-to-noise ratio and thereby a better image than two-photon excited autofluorescence, although the combination of simultaneous SHG and two-photon autofluorescence is reported to provide detailed structural information important in diagnosis of diseases such as Alzheimer and cancer.11 4.3.Nonlinear Optical SusceptibilityCollagen is a hyperpolarizable material, and this property may be quantified by determining the coefficient, which represents the nonlinear optical susceptibility. The model described in Eq. 2 was fitted to the experimental SHG intensities obtained when rotating the tissue and collecting an image every . Representative polar plots of the various tissues are shown in Fig. 5 . Both experimental data and the fitted plots are shown. Fig. 5Polar plots of experimental SHG data (points) as a function of the azimuth angle , and the graph fitted to the experimental data using Eq. 2 (solid line). Normal tissue (a) bone/femur, (b) breast, and (c) skin/dermis; tumor tissue (d) osteosarcoma (OHS), (e) breast cancer (MCF7), and (f) melanoma (FME). The polar plots represent ROIs containing well-ordered straight collagen fibers. 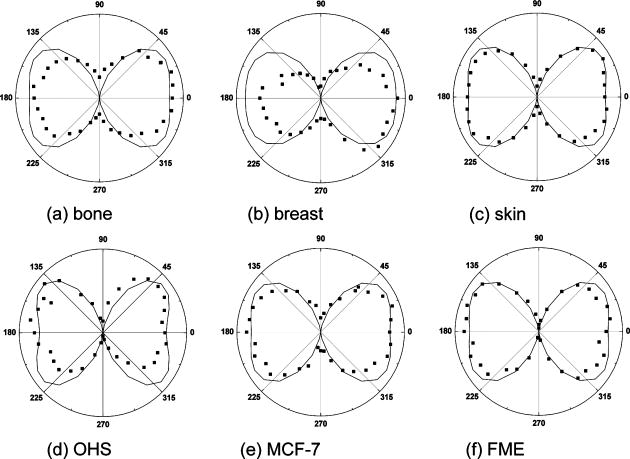 Well-ordered areas display essentially the same polarization dependence in all the tissues investigated: The weakest signal from the fibers was found when the fibers were oriented perpendicular to the polarization of the incident laser beam. The agreement between the measurements and the theoretical model justifies the assumption made in the theory that collagen fibers have -symmetry. Using an ROI containing bent and crimped fibers resulted in an almost equal SHG signal at all angles (Fig. 6 ) that could not be fitted by the theoretical model. Thus, such areas were avoided. Fig. 6Polar plot of experimental SHG data as a function of the azimuth angle . The polar plot represents an ROI containing bent collagen fibers. The SHG image (inset) shows the circular ROI used.  Well-ordered collagen fibers in normal tissue had values approximately twice as high as those found in tumor tissue (Table 1 ), and the values were in the range and , respectively. The differences in values between tumor tissue and corresponding normal tissue were statistically significant. Only bone/KPDX had a low ratio of 1.2. KPDX had the highest coefficient of the tumor tissues, whereas OHS had the lowest. Thus, there may be larger differences in the structural parameter for the same tumor type than between different types such as sarcoma, carcinoma, and melanoma. Comparing values between tumor tissues, only values for OHS and KPDX were significantly different. In the group of normal tissues, the value for bone was significantly lower than the values for breast and skin. Table 1Nonlinear optical susceptibility given by d22 coefficient in normal and cancer tissue.1
The calculated values depend on the thickness of the collagen fibers and the difference in refractive indices [Eq. 4]. The estimated values in Table 1 are based on the assumption that is equal to the section thickness, i.e., , although each individual fiber diameter was measured to approximately . The assumption is justified by the fact that the Rayleigh radius was , and from the fiber thickness in the direction, which was obtained from -projections of a -stack through collagen fibers and found to be in both normal and tumor tissue. However, the low axial resolution excluded the characterization of fibers thinner than . Furthermore, calculation of as a function of showed that when is in the range , the coefficient is quite independent of thickness [Fig. 7a ]. Fig. 7Calculated coefficient [Eq. 4] as a function of (a) sample thickness and (b) due to dispersion in collagen. is given in arbitrary units. 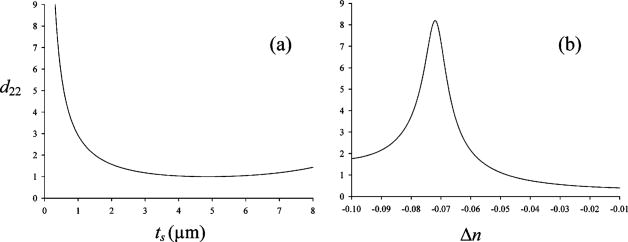 Due to dispersion in collagen, there is a difference in the refractive indices of the incident laser light and that of the produced SHG light . was used for the calculated values, in accordance with other reports.20 However, values of in the range to have been reported.37, 38 Changes in calculated values when varies are shown in Fig. 7b. Small changes in , especially when , have a large impact on the value. The packing and density of the collagen fibers are tissue specific, and if has a higher absolute value in normal tissue compared with tumor tissue, the value is underestimated and even higher in normal tissue than the values shown in Table 1. The model for calculating values is based on the assumption that the collagen fibers are located in the -plane, i.e., the plane of the frozen section. However, when cutting the tissue into frozen sections, collagen fibers at different angles relative to the sectioning plane are included. The impact of the angle on was therefore investigated (Fig. 8 ). Our estimation method for is based on using data corresponding to , thus ideally eliminating the influence of on . However, for , will contribute to even if . We have assumed as a representative value of (Ref. 22) to enable the simulation of Eq. 2 as a function of the tilt angle . As shown in Fig. 8, actually contributes in such a way that the value of is maintained at the value corresponding to in the idealized situation of and . Thus, for values the reduction in intensity value is less than 5% relative to the intensity value in the idealized situation ( and ). The method of calculating based on well-ordered parallel and straight fibers oriented at angle therefore seems acceptable, even in the presence of fibers tilted at angles up to . Fig. 8Simulation of Eq. 2 for , showing the contribution of and to as a function of tilt angle . A value of was assumed for the simulation. All three graphs show contributions to SHG signal intensity (based on squared -coefficients), i.e., the -term of Eq. 2 (dotted line), (solid line), and the difference ( -term); dashed line due to the contribution from . 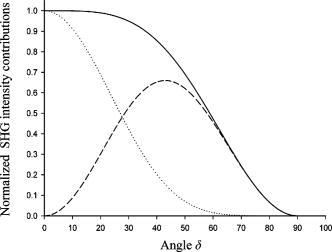 Using a polarizer perpendicular to the polarization of the laser beam, the coefficient may be obtained.22 may also be determined using a parallel polarizer and using the values as input for generating the best-fit values of from Eq. 2. However, in a previous study of rat tail tendon, the two approaches to estimate showed some discrepancy,22 and reporting of was omitted in the present study. 4.4.Polarization of the SHG SignalThe anisotropy parameter defined in Eq. 5 was used to compare the orientation and degree of order of the collagen fibers.27, 39 The number of collagen fibers in the ROI used to calculate the anisotropy parameter is of critical importance; thus, anisotropy was calculated for ROIs of various sizes from . From the histograms shown in Fig. 9 , a broad distribution of anisotropy values was demonstrated. In general, the tumor tissue had higher anisotropy values than normal tissue except for bone, which had values similar to tumor tissue. This difference was valid for all ROI sizes used. The higher anisotropy values found in tumor tissue is caused by the low collagen content, i.e., few collagen fibers were found in the ROI, resulting in higher alignment order of the analyzed contributions. In accordance with this, small ROIs showed higher polarization anisotropy values. The few collagen fibers in tumor tissue were straight and less crimped compared to normal tissue, as can also be concluded from visual inspection of Fig. 2. In normal tissue, the ROIs contained several fibers that may be oriented in different directions. However, in femur, a more well ordered collagen network was observed (Fig. 3), resulting in higher anisotropy values than in breast and skin. Fig. 9Anisotropy parameter [Eq. 5] calculated for various sizes of ROIs , , , and , indicated by the bar sequence from left to right. Histograms show the frequency of the various anisotropy values for normal tissue (a) bone/femur, (b) breast, and (c) skin/dermis and for tumor tissue (d) osteosarcoma (OHS), (e) breast cancer (MCF7), and (f) melanoma (FME).  5.Discussion5.1.Collagen DistributionThe collagen networks in tumor tissues and their corresponding normal tissues were strikingly different, suggesting that the collagen networks in tumor tissue have lost most of their normal functions. Consistent with our work measuring the collagen network by SHG, detection of collagen by other methods, such as light and electron microscopy as well as biochemical methods, revealed lower collagen density in tumor tissues compared to their corresponding normal tissues.16, 17, 40 The difference is probably caused by increased metalloproteinase expression and activity produced by the tumor cells and stromal cells of the host as well as larger extracellular space in tumors.41 Production of the ECM constituents depends on interactions between normal stromal cells and tumor cells, which stimulate and regulate stromal cells to produce an optimal environment for the growth of tumor cells. Fibroblasts are the main producer of ECM components, although sarcoma cells can also contribute, whereas carcinoma cells have less impact.42 Despite this difference in the regulation of the production of ECM, osteosarcoma, breast carcinoma, and melanoma were found to have a similar collagen network. The cap of collagen surrounding the tumors has also been seen in other studies and is suggested to be caused by the tumor cells pushing aside preexisting collagen bundles of the connective tissue in order to get space,17 as well as by interactions between the host mesenchymal cells and tumor cells.42 5.2.Nonlinear Optical SusceptibilityThe intensity and polarization dependency of the SHG signal reflect the structure of the fibrils,43 and normal tissue emitted more intense SHG light than tumor tissue. The maximum signal intensity occurs when fibers are aligned parallel to the polarization direction of the laser beam, and these SHG intensities resulted in higher values in normal tissue compared to tumor tissue, although collagen fibers in breast and skin appeared crimped, not displaying parallel orientation. Assuming the same sample thickness and same extent of dispersion in normal and tumor tissues, the coefficients were approximately twice as high in normal tissues compared to tumor tissues. However, the birefringence image of Picrosirius red–stained tissues section showed a red shift in normal tissues corresponding to thicker fibers. The thickness varied probably between , and in this range, the coefficient was shown to be essentially independent of the fiber thickness. The generation of the SHG signal is not clearly understood. Packing of the triple helix into fibrils and fibers is essential, and the packing depends among other things on the microenvironment. A hostile microenvironment characterized by low pH, high ionic strength, and high enzymatic activity as found in tumors is reported to reduce the SHG signal intensity.1 The orientation of neighboring fibrils is another important factor. The degree of parallel and antiparallel orientation of neighboring fibrils is suggested to determine the SHG intensity because parallel orientation may give coherent enhancement of the SHG signal, whereas antiparallel orientation introduces destructive interference.20 The conventional model of collagen fibers consisting of fibrils forming a more or less compact structure has been challenged both by high-resolution SHG imaging7 and by atomic force microscopy.44 These studies indicate a hollow tube-like structure, and the SHG signal is reported to emerge from the thin layer of collagen fibrils forming the outer wall of the tube and not from the interior of the fibrils.7 5.3.Polarization of the SHG SignalAn empirical anisotropy parameter may be a valuable diagnostic parameter, providing information about the orientation of collagen fibers. Collagen fiber orientation is closely related to the structure and function of the tissue.27 A comparison between four polarimetric optical methods, reflected and transmitted fundamental light, two-photon excitation autofluorescence, and SHG, showed that SHG was the most sensitive to collagen orientation.45 In the present work, tumor tissues having few and straight collagen fibers displayed higher anisotropy values than normal skin and breast tissues. Femur, which has a more well ordered collagen network, had anisotropy values close to osteosarcoma. Although caution should be taken using this parameter as a diagnostic indication on its own, it may provide important complementary information. 5.4.Clinical ImplicationThe ability to visualize the collagen network both in sections of tumors and nondestructively in vivo is of clinical importance. Miniaturization of two-photon microscopes combined with fiber endoscopy may be used to determine the collagen signature in vivo.46, 47, 48, 49 Imaging endoscopes rely on the backscattered SHG signal, and although the SHG signal in the forward direction is dominating,5, 7 the backscattered signal is shown to be sufficient for collagen detection.12, 13 The SHG signal from immature thin fibrils has even been shown to be prominent in the backscattered direction, whereas mature fibers produce more forward-directed SHG.7 This may be of importance for the detection of collagen in tumor tissues having more immature fibrils. Low collagen density was in the present work shown to correlate with cancer, and the collagen density may also predict progression and prognosis.50 However, there are a few reports describing higher collagen level in tumor tissue compared to corresponding normal tissue.51, 52 Collagen can be characterized by its distribution and content, as well as structural parameters. The present work suggests that collagen density is a sufficient parameter for detection of cancer, and more sophisticated structural parameters based on polarization-dependent SHG intensity may not provide additional diagnostic information. However, such measurements are of importance to understand more about collagen fibrillogenesis and the generation and molecular source of the second-harmonic signal. AcknowledgmentsThe authors are grateful to Kristin Sæterbø, Dept. of Physics, NTNU, for growing cells and implanting tumors, and to Ingunn Tufto, Dept. of Physics, NTNU, for excising tumors and normal tissues. Magdalene Ericson at the Dept. of Pathology, University Hospital of Trondheim, is acknowledged for preparing frozen-tissue sections. This work was supported by the Norwegian Cancer Society and The Norwegian Research Council ReferencesB. M. Kim,
J. Eichler,
K. M. Reiser,
A. M. Rubenchik, and
L. B. da Silva,
“Collagen structure and nonlinear susceptibility: effects of heat, glycation, and enzymatic cleavage on second harmonic signal intensity,”
Lasers Surg. Med., 27 329
–335
(2000). https://doi.org/10.1002/1096-9101(2000)27:4<329::AID-LSM5>3.0.CO;2-C 0196-8092 Google Scholar
M. B. Lilledahl,
O. A. Haugen,
C. de L. Davies, and
L. O. Svaasand,
“Characterization of vulnerable plaques by multiphoton microscopy,”
J. Biomed. Opt., 12 044005-1
–044005-12
(2007). https://doi.org/10.1117/1.2772652 1083-3668 Google Scholar
S. Tanaka,
G. Avigad,
B. Brodsky, and
E. F. Eikenberry,
“Glycation induces expansion of the molecular packing of collagen,”
J. Mol. Biol., 203 495
–505
(1988). https://doi.org/10.1016/0022-2836(88)90015-0 0022-2836 Google Scholar
P. Odetti,
M. A. Pronzato,
G. Noberasco,
L. Cosso,
N. Traverso,
D. Cottalasso, and
U. M. Marinari,
“Relationships between glycation and oxidation related fluorescences in rat collagen during aging—an in-vivo and in-vitro study,”
Lab. Invest., 70 61
–67
(1994). 0023-6837 Google Scholar
G. Cox,
E. Kable,
A. Jones,
I. K. Fraser,
F. Manconi, and
M. D. Gorrell,
“3-dimensional imaging of collagen using second harmonic generation,”
J. Struct. Biol., 141 53
–62
(2003). https://doi.org/10.1016/S1047-8477(02)00576-2 1047-8477 Google Scholar
R. Gauderon,
P. B. Lukins, and
C. J. R. Sheppard,
“Optimization of second-harmonic generation microscopy,”
Micron, 32 691
–700
(2001). https://doi.org/10.1016/S0968-4328(00)00066-4 0968-4328 Google Scholar
R. M. Williams,
W. R. Zipfel, and
W. W. Webb,
“Interpreting second-harmonic generation images of collagen I fibrils,”
Biophys. J., 88 1377
–1386
(2005). https://doi.org/10.1529/biophysj.104.047308 0006-3495 Google Scholar
A. Zoumi,
A. Yeh, and
B. J. Tromberg,
“Imaging cells and extracellular matrix in vivo by using second-harmonic generation and two-photon excited fluorescence,”
Proc. Natl. Acad. Sci. U.S.A., 99 11014
–11019
(2002). https://doi.org/10.1073/pnas.172368799 0027-8424 Google Scholar
P. J. Campagnola and
L. M. Loew,
“Second-harmonic imaging microscopy for visualizing biomolecular arrays in cells, tissues, and organisms,”
Nat. Biotechnol., 21 1356
–1360
(2003). https://doi.org/10.1038/nbt894 1087-0156 Google Scholar
C. J. R. Sheppard,
J. N. Gannaway,
R. Kompfner, and
D. Walsh,
“Scanning harmonic optical microscope,”
IEEE J. Quantum Electron., 13 100D
(1977). 0018-9197 Google Scholar
W. R. Zipfel,
R. M. Williams, and
W. W. Webb,
“Nonlinear magic: multiphoton microscopy in the biosciences,”
Nat. Biotechnol., 21 1368
–1376
(2003). https://doi.org/10.1038/nbt899 1087-0156 Google Scholar
A. Erikson,
H. N. Andersen,
S. N. Naess,
P. Sikorski, and
C. de L. Davies,
“Physical and chemical modifications of collagen gels: impact on diffusion,”
Biopolymers, 89 135
–143
(2008). https://doi.org/10.1002/bip.20874 0006-3525 Google Scholar
E. Brown,
T. McKee,
E. di Tomaso,
A. Pluen,
B. Seed,
Y. Boucher, and
R. K. Jain,
“Dynamic imaging of collagen and its modulation in tumors in vivo using second-harmonic generation,”
Nat. Med., 9 796
–800
(2003). 1078-8956 Google Scholar
D. G. Hicks and
S. Kulkarni,
“ breast cancer,”
Am. J. Clin. Pathol., 129 263
–273
(2008). 0002-9173 Google Scholar
N. D. Kirkpatrick,
M. A. Brewer, and
U. Utzinger,
“Endogenous optical biomarkers of ovarian cancer evaluated with multiphoton microscopy,”
Cancer Epidemiol. Biomarkers Prev., 16 2048
–2057
(2007). 1055-9965 Google Scholar
C. Morrison,
J. Thornhill, and
E. Gaffney,
“The connective tissue framework in the normal prostate, BPH and prostate cancer: analysis by scanning electron microscopy after cellular digestion,”
Urol. Res., 28 304
–307
(2000). 0300-5623 Google Scholar
J. Smolle,
M. Fiebiger,
R. Hofmann Wellenhof, and
H. Kerl,
“Quantitative morphology of collagen fibers in cutaneous malignant melanoma and melanocytic nevus,”
Am. J. Dermatopathol., 18 358
–363
(1996). 0193-1091 Google Scholar
C. E. Brinckerhoff and
L. M. Matrisian,
“Timeline—Matrix metalloproteinases: a tail of a frog that became a prince,”
Nat. Rev. Mol. Cell Biol., 3 207
–214
(2002). 1471-0072 Google Scholar
P. Stoller,
K. M. Reiser,
P. M. Celliers, and
A. M. Rubenchik,
“Polarization-modulated second harmonic generation in collagen,”
Biophys. J., 82 3330
–3342
(2002). 0006-3495 Google Scholar
P. Stoller,
P. M. Celliers,
K. M. Reiser, and
A. M. Rubenchik,
“Quantitative second-harmonic generation microscopy in collagen,”
Appl. Opt., 42 5209
–5219
(2003). https://doi.org/10.1364/AO.42.005209 0003-6935 Google Scholar
D. A. Kleinman,
“Nonlinear dielectric polarization in optical media,”
Phys. Rev., 126 1977
–1979
(1962). https://doi.org/10.1103/PhysRev.126.1977 0031-899X Google Scholar
A. Erikson,
J. Örtegren,
T. Hompland,
C. de L. Davies, and
M. Lindgren,
“Quantification of the second-order nonlinear susceptibility of collagen I using a laser scanning microscope,”
J. Biomed. Opt., 12 044002-1
–044002-10
(2007). https://doi.org/10.1117/1.2772311 1083-3668 Google Scholar
R. W. Boyd, Nonlinear Optics, Academic Press, San Diego, CA
(1992). Google Scholar
V. G. Dmitriev,
G. G. Gurzadyan, and
D. N. Nikogoyan, Handbook of Nonlinear Optical Crystals, Springer, Berlin
(1997). Google Scholar
V. Ottani,
M. Raspanti, and
A. Ruggeri,
“Collagen structure and functional implications,”
Micron, 32 251
–260
(2001). https://doi.org/10.1016/S0968-4328(00)00042-1 0968-4328 Google Scholar
D. J. S. Hulmes,
“Building collagen molecules, fibrils, and suprafibrillar structures,”
J. Struct. Biol., 137 2
–10
(2002). https://doi.org/10.1006/jsbi.2002.4450 1047-8477 Google Scholar
T. Yasui,
Y. Tohno, and
T. Araki,
“Characterization of collagen orientation in human dermis by two-dimensional second-harmonic-generation polarimetry,”
J. Biomed. Opt., 9 259
–264
(2004). https://doi.org/10.1117/1.1644116 1083-3668 Google Scholar
Ø. Fodstad,
A. Brøgger,
Ø. Bruland,
O. P. Solheim,
J. M. Nesland, and
A. Pihl,
“Characteristics of a cell-line established from a patient with multiple osteosarcoma, appearing after treatment for bilateral retinoblastoma,”
Int. J. Cancer, 38 33
–40
(1986). 0020-7136 Google Scholar
Ø. Bruland,
Ø. Fodstad, and
A. Pihl,
“The use of multicellular spheroids in establishing human sarcoma cell-lines invitro,”
Int. J. Cancer, 35 793
–798
(1985). 0020-7136 Google Scholar
K. M. Tveit,
O. Fodstad,
J. V. Johannessen, and
S. Olsnes,
“A human-melanoma cell-line established from xenograft in athymic mice,”
Br. J. Cancer, 41 724
–733
(1980). 0007-0920 Google Scholar
H. D. Soule,
J. Vazquez,
A. Long,
S. Albert, and
M. Brennan,
“Human cell line from a pleural effusion derived from a breast carcinoma,”
J. Natl. Cancer Inst., 51 1409
–1416
(1973). 0027-8874 Google Scholar
L. C. U. Junqueira,
G. Bignolas, and
R. R. Brentani,
“Picrosirius staining plus polarization microscopy, a specific method for collagen detection in tissue sections,”
Histochem. J., 11 447
–455
(1979). https://doi.org/10.1007/BF01002772 0018-2214 Google Scholar
P. Thevenaz,
U. E. Ruttimann, and
M. Unser,
“A pyramid approach to subpixel registration based on intensity,”
IEEE Trans. Image Process., 7 27
–41
(1998). https://doi.org/10.1109/83.650848 1057-7149 Google Scholar
L. C. U. Junqueira,
G. S. Montes, and
E. M. Sanchez,
“The influence of tissue section thickness on the study of collagen by the picrosirius-polarization method,”
Histochemistry, 74 153
–156
(1982). Google Scholar
M. Strupler,
A. M. Pena,
M. Hernest,
P. L. Tharaux,
J. L. Martin,
E. Beaurepaire, and
M. C. Schanne-Klein,
“Second harmonic imaging and scoring of collagen in fibrotic tissues,”
Opt. Express, 15 4054
–4065
(2007). https://doi.org/10.1364/OE.15.004054 1094-4087 Google Scholar
R. M. Korol,
H. M. Finlay,
M. J. Josseau,
A. R. Lucas, and
P. B. Canham,
“Fluorescence spectroscopy and birefringence of molecular changes in maturing rat tail tendon,”
J. Biomed. Opt., 12 024011
(2007). https://doi.org/10.1117/1.2714055 1083-3668 Google Scholar
F. P. Bolin,
L. E. Preuss,
R. C. Taylor, and
R. J. Ference,
“Refractive-index of some mammalian tissues using a fiber optic cladding method,”
Appl. Opt., 28 2297
–2303
(1989). 0003-6935 Google Scholar
D. T. Poh,
“Examination of refractive index of human epidermis in vitro,”
118
–125
(1997). Google Scholar
P. J. Campagnola,
A. C. Millard,
M. Terasaki,
P. E. Hoppe,
C. J. Malone, and
W. A. Mohler,
“Three-dimensional high-resolution second-harmonic generation imaging of endogenous structural proteins in biological tissues,”
Biophys. J., 82 493
–508
(2002). 0006-3495 Google Scholar
C. de L. Davies,
B. O. Engesaeter,
I. Haug,
I. W. Ormberg,
J. Halgunset, and
C. Brekken,
“Uptake of IgG in osteosarcoma correlates inversely with interstitial fluid pressure, but not with interstitial constituents,”
Br. J. Cancer, 85 1968
–1977
(2001). https://doi.org/10.1054/bjoc.2001.2180 0007-0920 Google Scholar
I. Stamenkovic,
“Extracellular matrix remodeling: the role of matrix metalloproteinases,”
J. Pathol., 200 448
–464
(2003). 0022-3417 Google Scholar
R. V. Iozzo,
“Proteoglycans—structure, function, and role in neoplasia,”
Lab. Invest., 53 373
–396
(1985). 0023-6837 Google Scholar
P. Stoller,
B. M. Kim,
A. M. Rubenchik,
K. M. Reiser, and
L. B. da Silva,
“Polarization-dependent optical second-harmonic imaging of a rat-tail tendon,”
J. Biomed. Opt., 7 205
–214
(2002). https://doi.org/10.1117/1.1431967 1083-3668 Google Scholar
T. Gutsmann,
G. E. Fantner,
M. Venturoni,
A. Ekani-Nkodo,
J. B. Thompson,
J. H. Kindt,
D. E. Morse,
D. K. Fygenson, and
P. K. Hansma,
“Evidence that collagen fibrils in tendons are inhomogeneously structured in a tubelike manner,”
Biophys. J., 84 2593
–2598
(2003). 0006-3495 Google Scholar
T. Yasui,
Y. Tohno, and
T. Araki,
“Determination of collagen fiber orientation in human tissue by use of polarization measurement of molecular second-harmonic-generation light,”
Appl. Opt., 43 2861
–2867
(2004). https://doi.org/10.1364/AO.43.002861 0003-6935 Google Scholar
D. Bird and
M. Gu,
“Compact two-photon fluorescence microscope based on a single-mode fiber coupler,”
Opt. Lett., 27 1031
–1033
(2002). https://doi.org/10.1364/OL.27.001031 0146-9592 Google Scholar
F. Helmchen,
M. S. Fee,
D. W. Tank, and
W. Denk,
“A miniature head-mounted two-photon microscope: high-resolution brain imaging in freely moving animals,”
Neuron, 31 903
–912
(2001). https://doi.org/10.1016/S0896-6273(01)00421-4 0896-6273 Google Scholar
F. Helmchen,
“Miniaturization of fluorescence microscopes using fiber optics,”
Exp. Physiol., 87 737
–745
(2002). https://doi.org/10.1113/eph8702478 0958-0670 Google Scholar
J. C. Jung and
M. J. Schnitzer,
“Multiphoton endoscopy,”
Opt. Lett., 28 902
–904
(2003). https://doi.org/10.1364/OL.28.000902 0146-9592 Google Scholar
P. P. Provenzano,
K. W. Eliceiri,
J. M. Campbell,
D. R. Inman,
J. G. White, and
P. J. Keely,
“Collagen reorganization at the tumor-stromal interface facilitates local invasion,”
BioMed Central Medicine, 4
(38),
(2006). Google Scholar
P. M. Gullino,
S. H. Clark, and
F. H. Grantham,
“Collagen content of transplanted tumors,”
Cancer Res., 22 1031
–1037
(1962). 0008-5472 Google Scholar
P. M. Gullino and
F. H. Grantham,
“Influence of host and neoplastic cell population on collagen content of tumor mass,”
Cancer Res., 23 648
–653
(1963). 0008-5472 Google Scholar
|
||||||||||||||||||||||