|
|
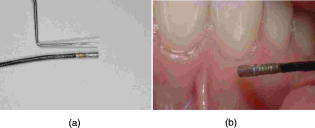
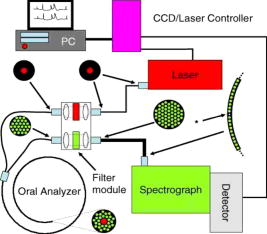
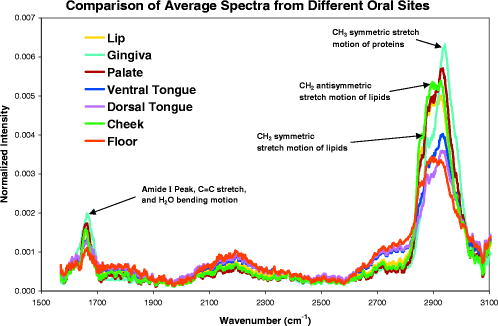
1.IntroductionHistology has been the gold standard for diagnosing the overwhelming majority of oral mucosal diseases, including malignancies and autoimmune conditions. Despite its desirability as a means to provide a definitive diagnosis, logistical, psychological, and economic hurdles often negatively impact the frequency with which biopsies are performed. Consequently, there has been increasing interest to develop alternative means for diagnosis, including cytological techniques,1 the use of cell markers,2 and the application of optical coherence imaging technology.3 Technical advances in Raman Spectra (RS) components, such as more compact and efficient lasers and light detectors, and the application of multivariate techniques for spectral analysis have permitted a practical instrument for potential use in cancer diagnostics.4, 5 Studies investigating the utility of RS in differentiating normal from premalignant and malignant tissue have been performed in a range of nonoral anatomic sites, including the brain,6, 7 breast,8, 9, 10 lower gastrointestinal tract,11, 12 nasopharynx,13 skin,14, 15, 16 lung,17, 18 and cervix.19, 20, 21 In-vivo Raman measurements are particularly challenging to do, since the spectra must be obtained with a short integration time, and often require the use of optical fiber catheters that introduce significant noise into the spectra. This noise is considerably reduced by choosing ultralow OH fiber; nevertheless, it remains a problem in the fingerprint region . This has prompted some investigators to look at the high frequency (hf) region of the spectra (e.g., Refs. 22, 23). Although there are fewer Raman peaks in the hf region, they had considerable success in using the C-H stretch bands near to discriminate between different tissue types. The first animal in-vivo study with rat oral mucosa was published by Bakker Schut 24 In their experiment, they induced dysplasia of palate epithelium and then assessed the tissue at various dysplastic stages with laser, RS (LRS). Signal variance due to signal contributions of the palatal bone was eliminated. The results of this study were impressive, with a selectivity of 0.93 and a sensitivity of 0.78 for detecting low-grade dysplasia, and a specificity of 1 and a sensitivity of 1 for detecting high-grade dysplasia/carcinoma in situ. A recent study by Malini 25 evaluated the ability of RS to differentiate normal, inflammatory, premalignant, and malignant oral lesions when applied to slides prepared from biopsied tissue. While using unsupervised principal component analysis (PCA), they were able to differentiate between normal and all pathological conditions, and they reported that their ability to distinguish among pathologic conditions was poor. We hypothesized that a reason for this lack of sensitivity might be the variability in RS signal produced by the different tissue types of the mouth and oropharynx. Furthermore, biopsied and prepared tissue may not produce an accurate diagnostic spectral response to that of in vivo. The goals of our study were thus to determine if RS signal varied by oral mucosal type and to evaluate the clinical utility of RS by assessing its applicability in vivo. We evaluated the clarity and quality of Raman signals in the mouth by defining the RS of specific oral sites in subjects of different gender and race. 2.Methods2.1.ProtocolThis study was conducted with approval of the Institutional Review Board (IRB) of the British Columbia Cancer Agency. Informed consent was obtained from all study participants. 51 subjects of both genders between the ages of 20 and (25 Caucasian and 26 Asian subjects) were recruited from a panel of patients having routine dental care in a community practice. Asian participants in this study consisted of Han Chinese predominantly of Hong Kong origin. Subjects were eligible to enter the study if they did not have significant systemic or oral disease and were not taking any medications known to modify the oral mucosa or its environment. Current or past smokers, individuals who consumed more than two alcoholic drinks per day, had a history of mucosal disease, or had received cancer therapy (radiation or chemotherapy) were excluded. Establishing and defining a “normal” baseline is a critical first step to the ultimate application of Raman as a diagnostic tool for oral disease. Furthermore, potential carcinogens such as tobacco use and ethanol use are known modifiers of oral mucosa. Consequently, to evaluate differences in Raman spectroscopic signals from different types of mucosa, we mandated exclusion of both of these known drivers of mucosal change. Patients were seated in a standard dental chair. Using a Raman probe [Figs. 1a and 1b ] spectra were recorded from seven designated sites within each subject’s mouth: movable buccal mucosa, attached gingiva, dorsal surface of the tongue, ventral surface of the tongue, the floor of the mouth, the movable mucosa of the lower lip, and the hard palate. The tissue was dried with a gauze sponge and each site was surveyed four times by the Raman probe. To obtain measurements, the probe was held from each designated site for one second. The distance was predetermined based on studies reported on the lung.18 A one-second acquisition time proved to be easily tolerated by subjects and provided consistent measurements. Disposable plastic sleeves were placed over the probe for each patient to insure infection control. 2.2.Raman SpectroscopyThe basic components of the Raman system consisted of an excitation light source, a spectrograph coupled to a detector, two specially designed fiber bundles, and two stages of optical filtering [Fig. 2 ]. A , external temperature stabilized diode laser (model BRM-785, B&W Tek, Newark, Delaware) was used. Tissue emission was analyzed with an f/2.2 transmissive imaging spectrograph (model Holospec, Kaiser Optical Systems, Ann Arbor, Michigan). The intensity of the dispersed light was measured with a NIR-optimized back-illuminated, deep depletion, and liquid-nitrogen-cooled charge-coupled device (CCD) array [ at (model Spec-10:400BR/LN, Princeton Instruments, Trenton, New Jersey)]. A specially designed probe was made consisting of one ultralow-OH -diam excitation fiber surrounded by 27 ultralow-OH -diam collection fibers bundled together in a round configuration approximately in diameter and long. The two stages of optical filtering were facilitated by incorporating laser line and long-pass filters both at the proximal and distal ends of the probe. Control of the system was implemented by a PC using a custom-designed program that triggered data acquisition and removed the autofluorescence background in real time.26, 27 All spectra were calibrated for the spectral sensitivity of the system using a standard halogen calibration lamp (RS-10, Gamma Scientific, San Diego, California) and an integrating sphere (Newport Corporation, Stratford, Connecticut). More details of the system can be found in a recent publication.18 2.3.Data AnalysisA one-second background count was removed from all spectra. This background was obtained with exactly the same experimental setup used for taking subject spectra, except the laser was not turned on. A three-adjacent-point smoothing was then applied to each spectrum, and an improved modified polynomial fitting routine using the seventh-order polynomial was applied to subtract the background fluorescence signal.28 Each spectrum was then calibrated to the response of the instrument and normalized to the area under the Raman curve from . The resulting spectra were grouped together by oral site and race as follows: 1. all spectra, 2. Asian spectra, 3. Caucasian spectra, and seven groups (4 through 10) for the different oral sites (e.g., lower lip). The averages of some of these groups are shown in Figs. 3, 4a, 4b . Fig. 4(a) Average of all in vivo Raman spectra from taken with a integration from different sites of Asian subjects. The error bars shown are the standard errors on the means. (b) Average of all in vivo Raman spectra from taken with a integration from different sites of Caucasian subjects. The error bars shown are the standard errors on the means.  2.4.Classification of SpectraThe normalized data were analyzed using Statistica 6.0 (StatSoft Incorporated, Tulsa, Oklahoma). Prior to any analysis, ten obvious spectral outliers (out of 351 spectra with not more than two spectra from each site) were rejected by inspection. The remaining spectra in each group were then centered about their mean and scaled by their standard deviation. Several sets of principal components (PCs) were calculated for each of the groups (1 through 10). Several sets were needed because the software was limited to 1000 data points per case, whereas our spectra contained 1340 data points. To look for statistical differences between Asian and Caucasian spectra, a two sided t-test was used on the PCs derived from the spectra in groups 1, and 4 through 10, to find which PCs were significantly different. Only PCs were used that accounted for 0.1% or more in the variance. Once the PCs were identified by the t-test, a linear discriminate analyzes (LDA) with cross validation was used on them to classify each spectrum as either Asian (A) or Caucasian (C). For a random classification, the probability that a spectrum would be either A or C is 0.5. To avoid uncertain prediction, we set the threshold for the predictive model at 0.7, that is, a spectrum had to have a probability of 0.7 or greater to be classified as either A or C. If the probability was less than 0.7 (e.g., 0.6 A and 0.4 C), the spectrum was unclassified. It was determined that the best results were obtained using the spectra range . A similar procedure was used on spectra from these same groups to look for gender differences. To determine if there were significant differences between spectra from different oral sites within the same ethnic group (groups 2 and 3), additional analyses were done. The procedure was the same as that described earlier, except there were seven possibilities to assign spectra. The random assignment probability was therefore or 0.143. To avoid uncertain prediction, a threshold for the predictive model was set at 0.50 (that is, a spectrum had to have a probability to be classified.). Although this threshold is lower than that used to separate Asian/Caucasian and male/female spectra, 0.50 is 0.357 above random, and as such, spectra meeting this criterion will be significantly different from the average spectra of other sites. Furthermore, a threshold stops any spectrum being classified as belonging to two or more oral sites, which will complicate the interpretation of the results. The best results were obtained using the spectral range from rather than the entire range. 3.ResultsThe average spectra from different oral sites in the range is shown in Fig. 3. All spectra contained a large peak near (Fig. 3), which was most likely the Raman peak due to amide I vibrations, with some contributions from the stretching motion of lipids and bending motions. The broad peak centered on was clearly the well known Raman peak due to a combination of lipids and proteins. Low intensity broad emissions that extended from in all spectra were probably made up of molecule librations and various carbon/nitrogen/oxygen modes.18 Above , there was some evidence in the raw data for a Raman peak around (not shown). This was most likely due to OH stretching motions of water molecules. However, the polynomial fitting in this region was not accurate and therefore the extracted Raman intensities were not reliable. Each of the scanned oral sites displayed distinct spectra [Figs. 4a and 4b]. The spectra from some sites were on average statistically different from other sites, one can see this from the error bars shown, which are the calculated errors on the means. 68% of new average spectra would lay within the error bars, 95% would lay within error bars twice as large, and 99.7% would lie within error bars three times as large. Spectra obtained from the lower lip and cheek were similar and tended to peak at 2850, 2900, and . In contrast, gingiva spectra peaks were noted at 2880 and . Similarly, maximal intensity spectra of 2875 and were noted for the hard palate. The ventral and dorsal tongue spectra appeared somewhat similar on visual inspection, with peaks at 2870 and . The floor of the mouth was different than the other tissues, and displayed a rather shallow climb and a broader range of peaks including 2850, 2890, and . The eigenvalues for the PCA of all the spectra (group 1) dropped rapidly to low levels after about 5 factors [Fig. 5a ], and these factors accounted for more than 95% of total variance. The loading plots for the first 5 factors are shown in Fig. 5b. T-tests on the first 10 factors identified two or more with significant p-values for discriminating between spectra from two oral sites. The most significant factors for nearly all sites were either factor 1 or factor 2 . The exception to this was the comparison between lower lip and cheek spectra, where factor 4 was the most significant. Figures 6a, 6b, 6c show scatter plots of factors 1, 2, and 4. The LDA analyses on all the significant factor scores by race and site are outlined in Tables 1, 2 . Note: LDA were not performed on male/female spectra groupings. Fig. 5(a) Plots of the first ten eigenvalues obtained from PCA of all spectra, and the cumulative percent variance that each additional factor accounts for. (b) Loading plots for the first 5 factors obtained from PCA of all spectra. 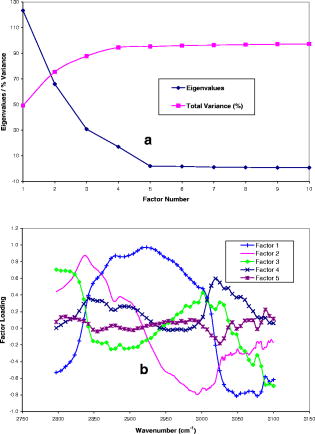 Fig. 6Scatter plots of the factor scores for the most significant factors for discrimination between spectra from different oral sites: (a) factors 1 and 2, (b) factors 1 and 4, and (c) factors 2 and 4. Data from seven sites are plotted in each figure; from left to right these are lower lip, gingiva, palate, ventral tongue, dorsal tongue, cheek, and floor of the mouth. Closed symbols are for Caucasian subjects and open symbols are for Asian subjects. 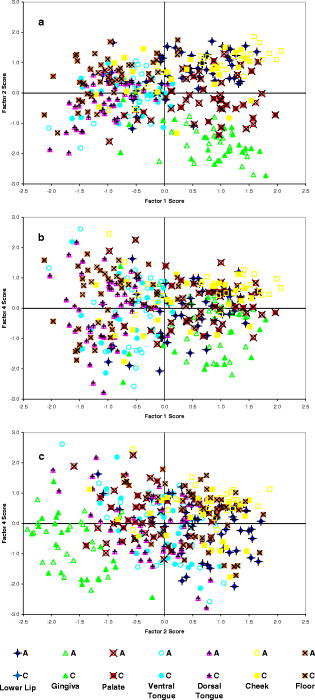 Table 2Classification by site of oral Raman spectra using LDA.
Table 1Classification by race of oral Raman spectra using LDA.
4.DiscussionOur spectra clearly showed the well known Raman peaks due to proteins, lipids, and water. Although there was still some undesirable noise in the spectra, this was small compared to the variation in Raman peak intensities. Some of the noise (the low intensity ripple shown in Fig. 3) appeared to be due to CCD etaloning, despite the use of a CCD that minimizes this effect. It is impossible to correct for CCD etaloning, and thus this effect will limit the reliable measurement of weak Raman signals. The polynomial fitting to remove the fluorescence was carried out before spectral intensity calibration, as this was found to produce the best fit to the data. However, this fitting was still not ideal in the range. Applying three-point smoothing before or after polynomial fitting made no significant difference to the fit. The fitting procedure used was chosen as a compromise between a fast computing time (important for real-time diagnosis in a clinical setting) and the accuracy of the fit. Improvements must be made to the fluorescence removal if the whole spectral range is to be used in future analyses. For the present data, the range analyzed seemed largely free of any significant artifacts, and showed clear differences in average Raman intensity for different groupings. Despite these differences, the correct classification of individual spectra using LDA had mixed results. Where LDA was used, the classification of spectra was nearly 100% correct in some cases, but in others, only 62% were correct. The classification of a spectrum as being either from an Asian or Caucasian subject was the least successful. This was to be expected, given the greater similarity in average spectra. The correct classification percentage goes up if one increases the probability threshold, but so does the number of spectra that cannot be classified. For example, if one increases the probability to 0.9, then all spectra meeting this threshold are correctly classified, but most spectra do not and thus go unclassified. Surprisingly, the LDA could correctly classify a significant fraction of the spectra from each site by race using a 0.7 threshold, even though the average spectra showed little difference. This occurred because the LDA were based on PCs that only accounted for small percentages of the total variance. In contrast, the correct assignment of an individual spectrum to a particular oral site was more successful than the assignment of the spectrum to the correct ethnic group. In this case, only a few spectra failed to achieve the 0.5 probability threshold, and of those that did, the percentages that were correctly classified were fairly high. Furthermore, the PCs that the LDA were based on accounted for high percentages of the total variance, except when comparing the lower lip with cheek spectra for Caucasian subjects. One could argue that larger sample sizes are usually desirable. To our knowledge, there is no simple way of accurately calculating appropriate sample sizes for PCA studies. Nonetheless, even with the conservative numbers used in this proof-of-principle study, we were able to demonstrate statistical significance. Our study is a first step in applying RS technology to the diagnosis of oral mucosal pathology by defining the spectral signal for specific mucosal sites within the mouth. We were able to demonstrate that the RS signal was consistent among subjects of different ethnicities and gender, and that the extent of the signal was dependent on the type of oral mucosa being evaluated. These data thus provide the baseline against which abnormal mucosal changes can be defined. Signals varied between some tissues (gingiva and cheek) and were similar with others (dorsal and ventral tongue) primarily due to the extent of the differences in the molecular structure. Tissues composed of similar relative amounts of lipids, carbohydrates, and proteins will resemble each other to a greater degree than those that are not. We believe that differences in spectra observed between Asian and Caucasian races may also be caused by variations in mucosal pigmentation. Other potential causes for this variation may include genetic differences resulting in both qualitative and quantitative differences in the molecular structure of the tissue. A recent study using the autofluorescence of oral tissue demonstrated differences between races as well.29 Future studies will involve identification of the molecular structures that will enhance our understanding of not only tissue types but differences among races. A potential impediment to the clinical application of RS is the time required to acquire a reproducible signal of meaningful sensitivity. As tissue produces a weak Raman signal. Most experimental studies to date have used signal acquisition times ranging from to several minutes,6, 11, 20, 30 too long for most patients to tolerate. Enhancements to the Raman system used in the current trial are fully described in Ref. 18. Briefly, the enhancements included a very sensitive CCD and a very efficient (low light loss) spectrometer. Filters and fibers were also used that allow light to pass through with low loss and the generation of minimal intrinsic fluorescence. Furthermore, a parabolic array was used that allows all the light at a particular wavenumber that is collected from the sample to be projected onto the CCD in a straight line, thus improving the signal-to-noise ratio. Together, these enhancements allowed us to obtain good signal within at a preferred range of . Various methods of noninvasive tissue diagnosis have been studied in the head and neck region. More recently, autofluorescence techniques have been studied.31, 32, 33, 34, 35, 36 In the oral cavity, sensitivity and specificity values of 88 and 100%, respectively, have been reported in distinguishing neoplasia from normal tissue.32 For the larynx, similar diagnostic sensitivity has been reported, but the specificity for distinguishing malignant from benign lesions may be as low as 50%.36 RS has a potential advantage over these techniques in that it can provide a molecular fingerprint of tissue. However, the signal may be obscured by autofluorescence, which is also induced by molecular excitation. For this reason, near-infrared (NIR) wavelengths are used in preference to visible light for measuring Raman scattering in biomedical applications. Using techniques ranging from empirical analysis of individual peaks to multivariate analysis of multiple spectral peaks, a number of in-vitro and in-vivo studies have reported sensitivity and specificity values of more than 90% for distinguishing cancer from normal tissue16, 17, 27 using RS. In the oral cavity, the use of RS to achieve a noninvasive real-time optical diagnosis has the potential to provide an adjunct to visual oral examination. Examples where noninvasive identification of pathology may be of particular value include surveillance of conditions such as inflammatory, autoimmune diseases, and dysplasia. 5.ConclusionWe successfully acquire, for the first time to our knowledge, in-vivo Raman spectra from the oral cavity. In-vivo Raman spectra taken from the oral cavity of 51 human subjects do not show strong differences between Asian and Caucasian subgroups. However, the spectra for different oral sites within the same ethnic group are significantly different and clearly separable. A study will be performed to determine Raman signals in the lower wavenumber range to determine if any additional, helpful data is available. Novel studies presently underway will provide more indications on the accuracy of diagnosis of inflammatory to malignant oral lesions. Additionally, lesions including oral leukoplakia and inflamed periodontal tissues will be studied. ReferencesL. Clayman and Masri,
“Fine needle aspiration biopsy of intraoral and oropharyngeal mass lesions,”
Cytojournal, 28
(5), 4
(2008). Google Scholar
K. Toyoshima, Y. Seta, T. Toyono, and S. Kataoka,
“Immunohistochemical identification of cells expressing steroidogenic enzymes cytochrome P450scc and P450 aromatase in taste buds of rat circumvallate papillae,”
Arch. Histol. Cytol., 70
(4), 21524
(2007). 0914-9465 Google Scholar
J. M. Ridgway, G. Ahuja, S. Guo, J. Su, U. Mahmood, Z. Chen, and B. Wong,
“Imaging of the pediatric airway using optical coherence tomography,”
Laryngoscope, 117
(12), 2206
–2212
(2007). 0023-852X Google Scholar
A. Mahadevan-Jansen and R. Richards-Kortum,
“Raman spectro—scopy for the detection of cancers and precancers,”
J. Biomed. Opt., 1
(1), 31
–70
(1996). https://doi.org/10.1117/1.2169477 1083-3668 Google Scholar
E. B. Hanlon, R. Monoharan, T. W. Koo, K. E. Shafer, J. T. Motz, M. Fitzmaurice, J. R. Kramer, I. Itzkan, R. R. Dasari, and M. S. Feld,
“Prospects for in vivo Raman spectroscopy,”
Phys. Med. Biol., 45 R1
–R55
(2007). https://doi.org/10.1088/0031-9155/45/2/201 0031-9155 Google Scholar
N. Amharref, A. Beljebbar, S. Dukic, L. Venteo, L. Schneider, M. Pluot, and M. Manfait,
“Discriminating healthy from tumor and necrosis tissue in rat brain tissue samples by Raman spectral imaging,”
Biochim. Biophys. Acta, 1768
(10), 2605
–2615
(2007). 0006-3002 Google Scholar
H. N. Banerjee and L. Zhang,
“Deciphering the finger prints of brain cancer astrocytoma in comparison to astrocytes by using near infrared Raman spectroscopy,”
Mol. Cell. Biochem., 295
(1–2), 237
–240
(2006). https://doi.org/10.1007/s11010-006-9278-4 0300-8177 Google Scholar
P. Matousek and N. Stone,
“Prospects for the diagnosis of breast cancer by noninvasive probing of calcifications using transmission Raman spectroscopy,”
J. Biomed. Opt., 12
(2), 024008
(2007). https://doi.org/10.1117/1.2718934 1083-3668 Google Scholar
N. Stone and P. Matousek,
“Advanced transmission Raman spectroscopy: a promising tool for breast disease diagnosis,”
Cancer Res., 68
(11), 4424
–4430
(2008). 0008-5472 Google Scholar
M. V. Chowdary, K. K. Kumar, J. Kurien, S. Mathew, and C. M. Krishna,
“Discrimination of normal, benign, and malignant breast tissues by Raman spectroscopy,”
Biopolymers, 83
(5), 556
–569
(2006). https://doi.org/10.1002/bip.20586 0006-3525 Google Scholar
X. L. Yan, R. X. Dong, L. Zhang, X. J. Zhang, and Z. W. Zhang,
“Raman spectra of single cell from gastrointestinal cancer patients,”
World J. Gastroenterol., 11
(21), 3290
–3292
(2005). 1007-9327 Google Scholar
M. G. Shim, L. K. S. Wong, N. E. Marcon, and B. C. Wilson,
“In vivo near-infrared Raman spectroscopy: demonstration of feasibility during clinical gastrointestinal endoscopy,”
Photochem. Photobiol., 72 146
–150
(2000). https://doi.org/10.1562/0031-8655(2000)072<0146:IVNIRS>2.0.CO;2 0031-8655 Google Scholar
D. P. Lau, Z. Huang, H. Lui, C. S. Man, K. Berean, M. D. Morrison, and H. Zeng,
“Raman spectroscopy for optical diagnosis in normal and cancerous tissue of the nasopharynx-preliminary findings,”
Lasers Surg. Med., 32
(3), 210
–214
(2003). https://doi.org/10.1002/lsm.10084 0196-8092 Google Scholar
C. A. Lieber, S. K. Majumder, D. Billheimer, D. L. Ellis, and A. Mahadevan-Jansen,
“Raman microspectroscopy for skin cancer detection in vitro,”
J. Biomed. Opt., 13
(2), 024013
(2008). https://doi.org/10.1117/1.2899155 1083-3668 Google Scholar
Z. Huang, H. Lui, M. X. K. Chen, D. I. McLean, and H. Zeng,
“Raman spectroscopy of in vivo cutaneous melanin,”
J. Biomed. Opt., 9
(6), 1198
–1205
(2004). https://doi.org/10.1117/1.1805553 1083-3668 Google Scholar
M. A. Short, H. Lui, D. I. McLean, H. Zeng, A. Alajlan, and M. X. Chen,
“Demonstrating changes in nuclei and peritumoral collagen within nodular basal cell carcinomas via confocal micro-Raman spectroscopy,”
J. Biomed. Opt., 11
(3), 034004
(2006). https://doi.org/10.1117/1.2209549 1083-3668 Google Scholar
Z. Huang, A. McWilliams, H. Lui, D. I. McLean, S. Lam, and H. Zeng,
“Near-infrared Raman spectroscopy for optical diagnosis of lung cancer,”
Int. J. Cancer, 107
(6), 1047
–1052
(2003). https://doi.org/10.1002/ijc.11500 0020-7136 Google Scholar
M. Short, S. Lam, A. McWilliams, J. Zhao, H. Lui, and H. Zeng,
“Development and preliminary results of an endoscopic Raman probe for potential in-vivo diagnosis of lung cancers,”
Opt. Lett., 33
(7), 711
–713
(2008). https://doi.org/10.1364/OL.33.000711 0146-9592 Google Scholar
A. Robichaux-Viehoever, E. Kanter, H. Shappell, D. Billheimer, H. Jones 3rd, and A. Mahadevan-Jansen,
“Characterization of Raman spectra measured in vivo for the detection of cervical dysplasia,”
Appl. Spectrosc., 61
(9), 986
–993
(2007). 0003-7028 Google Scholar
A. Mahadevan-Jansen, M. F. Mitchell, N. Ramanujam, A. Malpica, S. Thomsen, U. Utzinger, and R. Richards-Kortum,
“Near-infrared Raman spectroscopy for in vitro detection of cervical precancers,”
Photochem. Photobiol., 68
(1), 123
–132
(1998). https://doi.org/10.1562/0031-8655(1998)068<0123:NIRSFV>2.3.CO;2 0031-8655 Google Scholar
A. Mahadevan-Jansen, M. F. Mitchell, N. Ramanujam, A. Malpica, S. Thomsen, U. Utzinger, and R. Richards-Kortum,
“Near-infrared Raman spectroscopy for in vitro detection of cervical precancers,”
Photochem. Photobiol., 68 123
–132
(1998). https://doi.org/10.1562/0031-8655(1998)068<0123:NIRSFV>2.3.CO;2 0031-8655 Google Scholar
S. Koljenovic, T. C. Bakker Schut, R. Wolthuis, J. Kneipp, B. De Jong, L. Santos, P. J. Caspers, M. Kliffen, J. M. Kros, and G. J. Puppels,
“Tissue characterization using high wavenumber Raman spectroscopy,”
J. Biomed. Opt., 10 031116:1
–11
(2005). 1083-3668 Google Scholar
A. Nijssen, K. Maquelin, L. F. Santos, P. J. Caspers, T. C. Bakker Schut, J. C. den Hollander, M. H. Neumann, and G. J. Puppels,
“Discriminating basal cell carcinoma from perilesional skin using high wave-number Raman spectroscopy,”
J. Biomed. Opt., 12
(3), 034004
(2007). https://doi.org/10.1117/1.2750287 1083-3668 Google Scholar
T. C. Bakker Schut, M. J. H. Witjes, H. J. C. M. Sterenborg, O. C. Speelman, J. L. N. Roodenburg, E. T. Marple, H. A. Bruining, and G. J. Puppels,
“In vivo detection of dysplastic tissue by Raman spectroscopy,”
Anal. Chem., 72 6010
–6018
(2000). https://doi.org/10.1021/ac000780u 0003-2700 Google Scholar
R. Malini, K. Venkatakrishna, J. Kurien, Keerthilatha, M. Pai, L. Rao, V. B. Kartha, and C. Murali Krishna,
“Discrimination of normal, inflammatory, premalignant, and malignant oral tissue: a Raman spectroscopy study,”
Biopolymers, 81 179
–193
(2006). https://doi.org/10.1002/bip.20398 0006-3525 Google Scholar
J. Zhao, H. Lui, D. I. McLean, and H. Zeng,
“Automated autofluorescence background subtraction algorithm for biomedical Raman spectroscopy,”
Appl. Spectrosc., 61 1225
–1232
(2007). 0003-7028 Google Scholar
J. Zhao, H. Lui, D. I. McLean, and H. Zeng,
“Integrated real-time Raman system for clinical in vivo skin analysis,”
Skin Res. Technol., 14
(4), 484
–492
(2008). 0909-752X Google Scholar
J. Zhao, H. Lui, D. I. McLean, and H. Zeng,
“Automated autofluorescence background subtraction algorithm for biomedical Raman spectroscopy,”
Appl. Spectrosc., 61 1225
–1232
(2007). 0003-7028 Google Scholar
D. C. de Veld, H. J. Sterenborg, J. L. Roodenburg, and M. J. Witjes,
“Effects of individual characteristics on healthy oral mucosa autofluorescence spectra,”
Oral Oncol., 40
(8), 815
–823
(2004). 0964-1955 Google Scholar
N. Stone, P. Stavroulaki, C. Kendall, M. Birchall, and H. Barr,
“Raman spectroscopy for early detection of laryngeal malignancy: preliminary results,”
Laryngoscope, 110 1756
–1763
(2000). https://doi.org/10.1097/00005537-200010000-00037 0023-852X Google Scholar
A. Profio,
“Review of fluorescence diagnosis using porphyrins,”
Proc. SPIE, 90 150
–156
(1988). 0277-786X Google Scholar
H. Savage, V. Kolli, J. Ansley, R. Chandawarkar, R. Alfano, and S. Schantz,
“Innate tissue fluorescence of the oral mucosa of controls and head and neck cancer patients,”
Proc. SPIE, 2387 2
–14
(1995). https://doi.org/10.1117/12.206804 0277-786X Google Scholar
J. K. Dhingra, D. F. Perrault, K. McMillan, E. E. Rebeiz, S. Kabani, R. Manoharan, I. Itzkan, M. S. Feld, and S. M. Shapshay,
“Early diagnosis of upper digestive tract cancer by autofluorescence,”
Arch. Otolaryngol. Head Neck Surg., 122 1181
–1186
(1996). 0886-4470 Google Scholar
A. Gillenwater, R. Jacob, R. Ganeshappa, B. Kemp, A. El-Naggar, J. Palmer, G. Clayman, M. Mitchell, and R. Richards-Kortum,
“Noninvasive diagnosis of oral neoplasia based on fluorescence spectroscopy and native tissue autofluorescence,”
Arch. Otolaryngol. Head Neck Surg., 124 1251
–1258
(1998). 0886-4470 Google Scholar
S. Schantz, V. Kolli, H. Savage, G. Yu, J. Shah, D. Harris, A. Katz, R. Alfano, and A. Huvos,
“In vivo native cellular fluorescence and histological characteristics of head and neck cancer,”
Clin. Cancer Res., 4 1177
–1182
(1998). 1078-0432 Google Scholar
C. Betz, M. Mehlmann, K. Rick, H. Stepp, G. Grevers, R. Baumgartner, and A. Leunig,
“Autofluorescence imaging and spectroscopy of normal and malignant mucosa in patients with head and neck cancer,”
Lasers Surg. Med., 25 323
–334
(1999). https://doi.org/10.1002/(SICI)1096-9101(1999)25:4<323::AID-LSM7>3.3.CO;2-G 0196-8092 Google Scholar
|
|||||||||||||||||||||||||||||||||||||||||||||||||||||||||||||||||||||||||||||||||||||||||||||||||||||||||||||||||||||||||||||||||||||||||||||||||||||||||||||||||||||||||||||||||||||||||||||||||||||||||||||||||||||||||||||||||||||||||||||||||||||||||||||||||||||||||||||||||||||||||||||||||||||||||||||||||||||||||||||||||||||||||||||||||||||||||||||||||||||||||||||||||||||||||||||||||||||||||||||||||