
|
|
1.IntroductionThe identification of unique molecular markers of cancer and its precursors has stimulated the development of new cancer-screening tools. A technology facilitating the noninvasive identification of precancerous lesions at high risk for progression would have important clinical benefits. Molecular-specific optical contrast agents have garnered attention for their ability to selectively label cells expressing markers of interest. Optical probes targeting extracellular biomarkers have advanced to preclinical animal models and pilot clinical trials.1, 2, 3, 4, 5, 6, 7, 8 The development of contrast agents targeted to intracellular biomarkers has proved to be more challenging. Multifunctional contrast agents designed to utilize cell uptake mechanisms have been reported;9, 10, 11, 12 however, the engineering of highly specific, optical probes with the appropriate physiochemical properties for cell internalization is difficult and not always feasible. There is need for a strategy to facilitate the intracellular delivery of existing contrast agents into live cells. Chemical detergents have traditionally been used as solubilizing agents for the study of biological membranes.13 At subsolubilizing concentrations, detergents can be used to perturb membrane structure and increase cell permeability.14, 15, 16, 17, 18, 19 Chemical detergents have achieved widespread use as permeabilization agents for immunohistochemistry. In live cells, detergents have shown limited success as permeabilization agents due to the challenge of retaining cell viability following permeabilization. Of the detergents tested to date, Triton-X100 has shown the most promise as a cell permeabilization agent. Triton-X100 has been used to nondestructively release secondary metabolites in plant cells20, 21, 22 and to study in situ enzymatic assays in yeast.23, 24 No systematic study has been performed in mammalian cells to determine how universally efficient, reproducible, and reversible this process is. We sought to determine whether Triton-X100 can be used to effectively and reversibly permeabilize live mammalian cells for contrast agent delivery. In this paper, we describe the use of macromolecule uptake assays to evaluate the efficiency of cell permeabilization. We find that there is a minimum effective Triton-X100 concentration, in which cell permeabilization efficiency is balanced with cell loss after treatment. Cell recovery after treatment is evaluated using cell viability, population doubling, and membrane integrity assays. Our findings indicate that Triton-X100, when used at or near the minimum effective concentration, can permeabilize a variety of live cells in a reproducible and reversible manner. 2.Materials and Methods2.1.Cell CultureThe ability of Triton-X100 to permeabilize human cell lines was evaluated using carcinoma cells (1483, HeLa), SV-40 transformed cells (GM847), and primary cells (HDF, MCF-10A). The 1483 cell line25 was obtained from Dr. Reuben Lotan at the M.D. Anderson Cancer Center (Houston, Texas). HeLa and MCF-10A cells were purchased from American Type Culture Collection [(ATCC), Manassas, Virginia]. GM847 cells were obtained from Coriell Cell Repositories (Camden, New Jersey). HDF cells were purchased from Lonza (Walkersville, Maryland). 1483 cells were cultured in Dulbecco’s Modified Eagle Medium:Nutrient Mix F-12® medium supplemented with L-glutamine (Invitrogen, Carlsbad, California) and 10% fetal bovine serum [(FBS) Hyclone, Logan, Utah]. HeLa and GM847 cells were cultured in Minimum Essential Medium® supplemented with L-glutamine, nonessential amino acids, sodium pyruvate, vitamins (Invitrogen) and 10% FBS. HDF cells were cultured in Fibroblast Growth Medium-2® (Lonza). MCF-10A cells were cultured in Mammary Epithelium Growth Medium® (Lonza). 2.2.Triton-X100 Dose Dependency of Cell PermeabilizationTo determine the minimum effective Triton-X100 concentration required to permeabilize live cells, 1483, Hela, GM847, HDF, and MCF-10A cells were assayed for membrane integrity and cell viability following treatment with different concentrations of Triton-X100. Briefly, subconfluent monolayers of cells (plated in advance at ) were washed once with cold phosphate buffered saline [(PBS) Sigma-Aldrich, St. Louis, Missouri] and treated with Triton-X100 (Sigma-Aldrich) for at . Triton-X100 concentrations ranged from /cell, normalized relative to the cell count at the time of plating. After permea bilization, the cells were washed once in media and returned to the incubator. Cell viability was assessed following Triton-X100 treatment. Prewarmed 3-(4,5-dimethylthiazol-2-yl)-2,5-diphenyl tetrazolium bromide (MTT, Sigma-Aldrich) was added to the supernatant for at a concentration of . In viable cells, reduction of the MTT reagent led to the intracellular deposition of a blue formazan product visible via light microscopy. Thereafter, the cells were washed, labeled with rhodamine-dextran (Invitrogen), and imaged using confocal microscopy (described below). Viable cells were identified by the presence of blue formazan deposits. Permeabilized cells were identified by presence of fluorescent dextrans inside the cytoplasmic and nuclear compartments. The minimum effective Triton-X100 concentration was defined as the concentration at which of cells were permeabilized. Then, 300–500 cells were evaluated from representative fields of view for each treatment condition in five independent experiments. Differences between cell lines were assessed using a two-tailed, unpaired Student’s t-test, with values of considered statistically significant. 2.3.Permeabilization Detection Using MacromoleculesTo determine whether Triton-X100 treated cells are permeable to macromolecules of different sizes, monolayers of treated cells were probed with 3, 40, and fluorescent macromolecules. Briefly, subconfluent monolayers of 1483 cells were permeabilized with /cell Triton-X100 for at . Cells were washed once in media and covered with a 1:1:1 mixture of rhodamine-dextran ( , Invitrogen), fluorescein-dextran ( , Invitrogen), and AlexaFluor647 IgG ( , Invitrogen), each diluted to a concentration of in PBS. Cells were incubated with this solution for at and then imaged using fluorescence confocal microscopy at three different excitation wavelengths. The optical imaging plane was focused to yield a cross section of the cytoplasm and nucleus for each cell in the field of view. Using NIH ImageJ v1.34 software (http://rsbweb.nih.gov/ij/), the mean fluorescence intensity was determined for selected regions of interest. The mean fluorescence intensity of the cytoplasm and nucleus was compared to that of the extracellular solution on a cell-to-cell basis. Cells were defined as permeable if the mean cytoplasmic and/or nuclear fluorescence intensity was equal or greater than half of the mean extracellular fluorescence intensity. This threshold parameter was selected based on the observation that not all cells reach 100% of the extracellular mean fluorescence intensity. About 100–300 cells were evaluated from representative fields of view in three separate experiments. 2.4.Tracking the Time Course of Macromolecule EntryMacromolecule entry was tracked in real time to evaluate macromolecule penetration as a function of time. Rhodamine-dextran , fluorescein-dextran (40, ), and AlexaFluor647 IgG were individually diluted to a concentration of in 0.05% Triton-X100. These solutions were topically applied to subconfluent 1483 cell monolayers grown on glass coverslips. Based on the cell count at the time of plating, an appropriate volume was selected to yield a final concentration of /cell Triton-X100. This concentration was selected to facilitate both cytoplasmic and nuclear penetration of the larger macromolecules. The movement of macromolecules into the cells was monitored using time-lapse fluorescence confocal microscopy. Again, the optical imaging plane was focused to yield a cross section of the cytoplasm and nucleus for each cell in the field of view. Images were acquired every . The mean fluorescence intensities of the cytoplasm and nucleus were compared to that of the extracellular solution by selecting regions of interest within a time stack and normalizing relative to the mean fluorescence intensity of the extracellular solution in each image. No other background corrections were made. Ten cells were evaluated from a representative field of view in five separate experiments. All fluorescence quantitation was performed using ImageJ software. The mean fluorescence intensity of each cell compartment after macromolecule addition and the time required to achieve fluorescence accumulation was determined from time versus intensity plots for each macromolecule. 2.5.Cell Metabolic AssayCells were assayed for metabolic activity following Triton-X100 treatment by monitoring the reduction of MTT as described in Ref. 26. Subconfluent monolayers of 1483 cells were permeabilized with /cell Triton-X100 for at 4 or , washed once, and then returned to a prewarmed complete medium for . Cellular metabolic activity was evaluated in triplicate in five separate experiments using the ATCC MTT assay. The absorbance measurement from each well was divided by the number of cells per well remaining after treatment to determine the mean absorbance per cell. 2.6.Population-Doubling AssayPopulation-doubling experiments were performed with subconfluent monolayers of 1483 and MCF-10A cells to determine the effect of Triton-X100 treatment on cell proliferation. Cells were plated at an appropriate concentration to allow log-linear growth for five days. Twenty-four hours after plating, cells were washed with PBS, treated with /cell Triton-X100 or PBS for at 4 or , and then returned to prewarmed complete media. The number of cells remaining after treatment and the rate of population doubling was assessed in duplicate at four different time points in three separate experiments. Differences in rate of population doubling between each treatment group were assessed using a two-tailed, unpaired Student’s t-test, with values of being considered statistically significant. 2.7.Membrane Integrity AssayTo determine whether cells recover their membrane integrity after Triton-X100 treatment, cells were tested for their ability exclude macromolecules after permeabilization. Subconfluent monolayers of 1483 cells cultured on glass coverslips were permeabilized for at with /cell Triton-X100, washed, and returned to prewarmed complete media. At regular intervals after permeabilization, cells were treated with MTT for at , washed, and covered with a 1:1:1 mixture of rhodamine-dextran, fluorescein-dextran, and AlexaFluor647 IgG (each diluted to in PBS). Viable cells were identified by color deposition under bright-field imaging. Macromolecule exclusion was monitored using fluorescence confocal microscopy. Cells were considered to have an intact membrane if the mean fluorescence intensity of the cytoplasm and/or nucleus was of the extracellular intensity. About 100–300 cells were evaluated from representative fields of view in three separate experiments. 2.8.Immunocytochemistry of Live CellsCells were labeled with nuclear-specific antibodies to validate the use of Triton-X100 for delivery of targeted contrast agents. Polyclonal rabbit antihuman PC563-hTERT antibody was purchased from EMD Biosciences (San Diego, California). Monoclonal mouse antihuman NCL-hTERT antibody was purchased from Novocastra (Newcastle upon Tyne, United Kingdom). Goat antirabbit AlexaFluor 647 IgG, goat antimouse AlexaFluor 488 IgG, purified polyclonal rabbit IgG, and monoclonal mouse were purchased from Invitrogen. Subconfluent monolayers of live 1483 cells cultured on coverslips were labeled with antibodies as follows: after plating, the cells were washed with PBS, treated with /cell Triton-X100 for , blocked for with a saline buffer containing 1% BSA/2% goat serum, and then labeled for with PC563-hTERT (1:80 dilution) and NCL-hTERT (1:800 dilution) antibodies. Following three washes, cells were probed with a 1:500 dilution of AlexaFluor 647 and 488 IgG antibodies for , washed, and imaged live using confocal microscopy. As a control, live cells were labeled in parallel with primary IgG antibodies and secondary AlexaFluor antibodies. For comparison to established immunocytochemistry protocols, cells were fixed for with 10% formalin immediately before or after Triton-X100 treatment. Fixed cells were immunolabeled as described above. Cell labeling was evaluated in triplicate in three separate experiments. All cells were imaged in the same optical plane. All stock solutions were diluted in PBS; all labeling was performed at . 2.9.Confocal Image AcquisitionAll images were obtained using a Carl Zeiss LSM 510 confocal microscope (Thornwood, New York) equipped with , , and lasers. Images were collected using photomultiplier tube detectors and Zeiss LSM 5 image examiner software. Samples were sequentially excited with each laser line, with power settings of 50, 100, and 100% respectively. Fluorescence emission was collected using 505–550, 565–615, and bandpass filters, respectively. Images were acquired at using a 63X oil objective with a pinhole of 2.56 Airy units. For macromolecule uptake and exclusion studies, the gain was held constant below the saturation level of the extracellular solution. For the immunocytochemistry studies, the gain was held constant at 535 ( excitation) and 440 ( excitation). Fluorescence recovery after photobleaching tests were performed using these imaging parameters to ensure that no photobleaching of the macromolecules occurred. 3.Results3.1.Dose-Dependent Permeabilization of Live CellsTo determine the relationship between cell permeabilization and short-term viability, monolayers of 1483 squamous carcinoma cells were treated for with different concentrations of Triton-X100 and then assayed for MTT reduction and rhodamine-dextran uptake. The Triton-X100 concentration was normalized relative to the number of cells being treated. Figure 1 shows the dose-dependent response to Triton-X100 treatment, in terms of picomols of Triton-X100 added per cell. The solid triangles indicate the percentage of cells permeabilized; the hollow diamonds indicate the percentage of viable cells remaining after treatment. Cells treated with /cell or less showed little to no uptake of dextran following treatment. Cells treated with /cell or above showed dextran uptake in of the cells. Cell loss was dependent on Triton-X100 dose, with the percentage of viable cells decreasing as the concentration of Triton-X100 was increased. After treatment with /cell Triton-X100, of the cells were viable, compared to of PBS-treated controls. Fig. 1Permeabilization of 1483 cell monolayers treated with different concentrations of Triton-X100, as measured by MTT reduction and rhodamine-dextran uptake. Cells were treated with Triton-X100 for , incubated in media for , and then assayed for cell viability and membrane integrity. The percentage of cells permeabilized (▲) appears to have a threshold concentration above which nearly all cells admit rhodamine-dextran. Little to no dextran uptake occurs at lower Triton-X100 concentrations. The viability of cells after treatment (◇) is dependent on the amount of Triton-X100 used. The error bars represent one standard deviation. 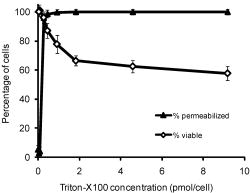 Different cell lines were evaluated for their sensitivity to Triton-X100 treatment. Table 1 shows the minimum Triton-X100 concentration required to permeabilize of each cell population for the delivery of . No significant differences were observed between squamous carcinoma cells, SV-40 transformed cells, and primary cells. The minimum effective Triton-X100 concentration was /cell for all cell lines evaluated. Cell viability after treatment was for all cell lines at the minimum effective Triton-X100 concentration. Table 1Sensitivity of different cell lines to Triton-X100 permeabilization.
3.2.Macromolecule Penetration Following PermeabilizationTo determine whether cells are selectively permeable to macromolecules of different sizes, monolayers of Triton-X100-treated cells were topically labeled with a 1:1:1 mixture of rhodamine-dextran, fluorescein-dextran, and AlexaFluor647 IgG. Dextrans were selected for their neutral charge, and IgG was selected for its size and structural similarity to targeted antibodies. The fraction of cells permeable to each macromolecule is shown in Fig. 2 . Figure 2a shows the dose-dependent permeabilization of the cytoplasm; Fig. 2b shows that of the nucleus. The dextran successfully penetrated both cell compartments in over 95% of cells treated with /cell Triton-X100 and above. The penetration of larger molecules varied by cell compartment. At /cell Triton-X100, 83% of the cells that were permeable to dextran also contained dextran and IgG in the nucleus. Concentrations upwards of /cell were required to permeabilize the nucleus of of cells. Thus, for Triton-X100 concentrations ranging from /cell, we observed that some nuclei were permeable to but not 40 and . Interestingly, there was no exclusion of from nuclei that were permeable to . The mean fraction of cells permeabilized was independently validated by treating cells with one macromolecule at a time (data not shown) to exclude any interacting effects. Fig. 2Macromolecule penetration into the cytoplasm and nucleus as a function of Triton-X100 concentration. Subconfluent monolayers of 1483 cells were pretreated with different concentrations of Triton-X100 for , and then probed with a 1:1:1 mixture of rhodamine-dextran, fluorescein-dextran, and AlexaFluor647 IgG. Macromolecule penetration of the cytoplasm appears to be independent of size, with no significant difference observed within each treatment group. Macromolecule penetration of the nucleus shows a stronger dependence on Triton-X100 concentration. Cells required a higher concentration of Triton-X100 permit nuclear entry of 40 and molecules. At /cell, all macromolecules successfully penetrated both the cytoplasm and nucleus of treated cells. The error bars represent one standard deviation. 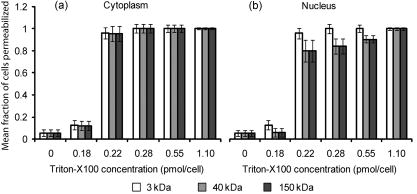 Macromolecule penetration was tracked as a function of time using time-lapse confocal microscopy. Molecules of all sizes could be observed in the cytoplasm and nucleus of cells as early as after the administration of Triton-X100. Figure 3a shows the cumulative uptake of fluorescent IgG (normalized relative to the fluorescence intensity of the extracellular solution) following the administration of /cell Triton-X100. The solid triangles represent the mean fluorescence intensity of the cytoplasm, and the hollow squares represent that of the nucleus. The circles represent IgG influx in the absence of Triton-X100. After the addition Triton-X100, fluorescent IgG rapidly enters both the cytoplasm and nucleus of cells. At approximately , both cell compartments reached a mean fluorescence intensity equal to that of the extracellular IgG. Continued influx of IgG slowly raised the mean fluorescence intensity of both cell compartments for an additional . Once the maximal intensity was reached at , no further changes were observed over the course of . The accumulation of IgG occurred in both the presence and absence of serum (data not shown). IgG uptake in the absence of Triton-X100 was negligible. Representative confocal time-lapse images of intracellular IgG accumulation can be found Fig. 4 . Fig. 3Cumulative macromolecule penetration as a function of time following the administration of /cell Triton-X100. (a) The time course of AlexaFluor647 IgG accumulation in the cytoplasm and nucleus of live 1483 cells, averaged over five trials. Cells are permeabilized rapidly, with both the cytoplasm (◇) and nucleus (◻) achieving a mean fluorescence intensity equal to that of the extracellular space at . Cells treated with IgG in the absence of Triton-X100 showed no significant uptake of fluorescence. All samples were normalized relative to the extracellular fluorescence. Error bars were removed for clarity; the error ranged from for one standard deviation. (b) The mean fluorescence intensity of each cell compartment relative to that of the extracellular space after Triton-X100 addition. (c) The time required for macromolecule accumulation in the cytoplasm (◼) and nucleus (○) of Triton-X100 treated cells. The time required for macromolecule uptake appears to be dependent on macromolecule size. No significant differences are observed between the cell compartments. The error bars represent one standard deviation. 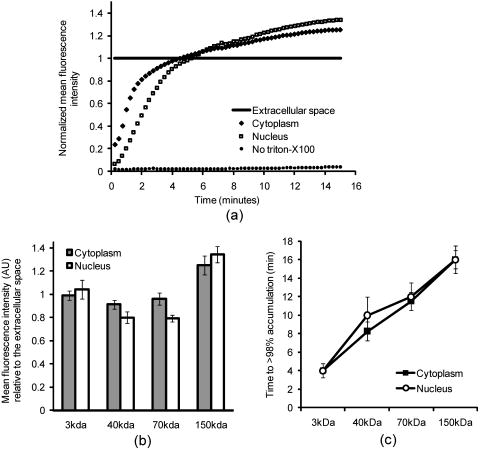 Fig. 4Confocal images of AlexaFluor IgG influx and accumulation in a monolayer of 1483 cells. The differential interference contrast (DIC) image at time zero is shown at the top left. With the topical application of IgG in /cell Triton-X100, selective permeabilization of the cell membrane, followed by that of the nuclear membrane, is observed. At , all cell compartments exhibit some fluorescence. Continued IgG influx causes mean fluorescence of cells to rise above that of the extracellular solution. The scale bar represents . (Color online only.)  The cumulative macromolecule uptake following treatment with Triton-X100 was measured for macromolecules of four sizes. For Fig. 3b, the mean fluorescence intensity of cell cytoplasm and nucleus was measured relative to that of the extracellular space after Triton-X100 addition. The total penetration varied by molecule size as well as the target cell compartment. The dextran uniformly penetrated both the cytoplasm and nucleus of treated cells. The 40 and dextrans penetrated to a lesser degree and preferentially localized to the cytoplasm. The IgG preferentially accumulated in both cell compartments and raised the mean fluorescence intensity of both cell compartments above that of the extracellular space. The time required for macromolecule accumulation was measured using time-lapse confocal microscopy. Figure 3c shows the time required to achieve macromolecule accumulation after Triton-X100 addition, as determined from the mean intracellular fluorescence accumulation over time. The time required for macromolecule uptake appeared dependent on macromolecule size, with the larger molecules requiring more time to accumulate inside treated cells. The macromolecule accumulation time ranged from for 3 and , and from for the 70 and molecules. No significant differences were observed between cell compartments for any given macromolecule. These trends were independent of macromolecule concentration (data not shown). 3.3.Cell Recovery after TreatmentMonolayers of 1483 cells were assayed for metabolic activity after treatment with different concentrations of Triton-X100. Figure 5a shows the mean absorbance measured at following MTT reduction by viable cells. Absorbance measurements of the total cell population at each Triton-X100 concentration yielded a dose-dependent decrease in absorbance. When the population data was adjusted for the number of cells remaining after after treatment, it was found that cells treated with /cell Triton-X100 or less retained full metabolic activity. Treatment with higher concentrations of Triton-X100 resulted in cell death and/or loss of metabolic activity, leading to a reduction in the mean absorbance per cell. No significant differences were observed in the metabolic activity of cells treated with /cell Triton-X100 at when compared to those treated at (data not shown). Fig. 5Cell recovery after treatment with Triton-X100. (a) Metabolic activity of 1483 cells after treatment with different concentrations of Triton-X100, as measured by the MTT assay. A dose-dependent decrease in the metabolic activity (◇) was observed for each treatment group. When corrected for the number of cells remaining after treatment, changes in the mean metabolic activity per cell (▲) were only observed at Triton-X100 concentrations above /cell. (b) Cell proliferation after treatment with /cell Triton-X100. Approximately 80% of the cells remained after Triton-X100 treatment (○) compared to the PBS control (◼). Both cell populations continued to proliferate after treatment. (c) Recovery of membrane integrity in metabolically active cells. The percentage of cells with intact membranes (◆) increases progressively with time. Membrane recovery was mostly restored at . (d) Confocal images of cells probed with MTT and fluorescent macromolecules after treatment with /cell Triton-X100. Of the cells that show metabolic activity, of cells exhibit permeability to rhodamine-dextran (orange), fluorescein-dextran (green), or AlexaFluor 647 IgG (red). The arrows indicate cells that are permeable to macromolecules. The error bars represent one standard deviation.  The proliferative capacity of 1483 cells following Triton-X100 treatment was determined using a population doubling assay. Figure 5b shows the cumulative cell number for three days following treatment with /cell Triton-X100 or PBS. Approximately of the adherent cells remained immediately after Triton-X100 treatment. Both treatment groups continued to proliferate with time. We observed a slight difference in the rate of population doubling for each treatment group; however, the differences observed were not statistically significant ( for Triton-X100 treatment versus for PBS treatment). Similarly, no significant differences in population doubling were observed between Triton-X100 and PBS-treated primary MCF-10A cells or 1483 cells treated with Triton-X100 prewarmed to (data not shown). To determine whether cells recover their membrane integrity after Triton-X100 treatment, cell monolayers were tested for their ability to exclude macromolecules after treatment. Figure 5c shows the cumulative recovery of membrane integrity in metabolically active cells, as measured by MTT reduction and macromolecule uptake. The percentage of metabolically active cells exhibiting intact cell membranes increased progressively with time. At the time point, were still permeable to macromolecules. Fig. 5d shows representative confocal microscopy images of cells assayed for membrane integrity after Triton-X100 treatment. Metabolically active cells were identified by color deposition using light microscopy. Cells that remained permeable after (indicated by arrows) admitted entry of (orange), (green), and (red) macromolecules. 3.4.Delivery of Targeted Optical Contrast AgentsLive and fixed cells were labeled with antibodies before or after treatment with /cell Triton-X100. Figure 6 shows representative confocal fluorescence images of 1483 cells probed for two different nuclear targets. The PC563-hTERT labeling is shown in red, and the NCL-hTERT labeling is shown in green. In cells fixed with 10% formalin, both targets were available for immunolabeling. Pretreatment with Triton-X100 before fixation enhanced the availability of the PC563 target. Treatment of live cells with Triton-X100 allowed both targets to be successfully labeled and imaged without fixation. Positive dual labeling was observed in all live permeabilized cells and varied in intensity less than from cell to cell (data not shown). A slight decrease in NCL-hTERT labeling intensity was observed when comparing live to fixed cells, likely due to repeated washing of the non-cross-linked proteins. No antibody cross-reactivity or nonspecific labeling was observed. Fig. 6Detection of intranuclear markers by immunofluorescence following Triton-X100 treatment. DIC and confocal fluorescence images of 1483 cells labeled with the PC563-hTERT antibody (red) and NCL-hTERT antibody (green) or IgG control antibodies (left panels). We observe enhanced availability of the PC563 target for labeling following treatment with /cell Triton-X100 in both fixed and live cells. In contrast, there is a slight decrease in the availability of the NCL target after treatment in live cells, possibly due to washing effects. No labeling is observed in live cells that are not treated with Triton-X100 or cells labeled with IgG antibodies. 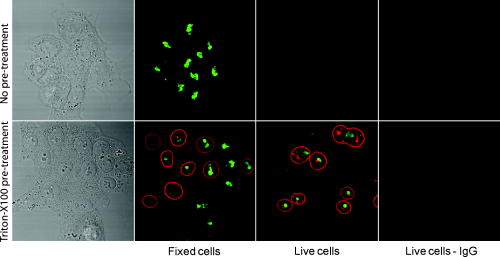 4.DiscussionOur results demonstrate that Triton-X100 can be used at subsolubilizing concentrations to permeabilize the membrane and nucleus of live cells. Both targeted and untargeted optical contrast agents can be reproducibly delivered into live cells by using the appropriate concentration of Triton-X100. In membrane-bound protein solubilization studies, it is generally recognized that the Triton-X100 concentration should be adjusted relative to the amount of protein to be extracted;27 similarly, we found it useful to normalize the Triton-X100 concentration for live cell permeabilization relative to the number of cells to be treated. Using this approach, we found that the Triton-X100 concentration could be readily optimized and scaled for treating different numbers of cells. The cell permeabilization efficiency was evaluated as a function of Triton-X100 concentration. Studies of fluorescent dextran uptake suggest that cell permeabilization has a threshold, since as little as a 1.5-fold change in Triton-X100 concentration increases the percentage of permeabilized cells by . The percentage of viable cells remaining after treatment is directly related to Triton-X100 concentration, with increasing doses of Triton-X100 leading to decreased cell viability. These results demonstrate the importance of determining the minimum effective Triton-X100 concentration for a given application. By using the lowest Triton-X100 concentration that provides sufficient permeabilization efficiency, one can minimize cell loss following treatment. To determine what variables are important for the optimization of Triton-X100 concentration, confocal microscopy was used to track the entry of untargeted contrast agents into live permeabilized cells. Interestingly, permeabilization of the cytoplasm permits the entry of all macromolecules up to in size. Nuclear permeabilization, however, is more dose dependent, requiring increasing doses of Triton-X100 to permit the entry of larger macromolecules into all cells. Macromolecule size also appears to play a role in the rate of contrast agent accumulation, with larger molecules requiring more time to accumulate after Triton-X100 addition. The total accumulation following cell permeabilization varies by molecule, with different molecules preferentially accumulating in different cell compartments to different degrees. Thus, the minimum effective Triton-X100 concentration required for nuclear permeabilization is dependent on the specific molecule to be delivered and is generally higher than that required for efficient permeabilization of the cytoplasm. The amount of macromolecule delivered and the time required is dependent on the specific macromolecule used. The cell recovery studies suggest that permeabilization can be a reversible process when the appropriate concentration of Triton-X100 is used. The results of the MTT assay further highlight the importance of optimizing Triton-X100 addition, because concentrations of /cell lead to a decrease in the mean metabolic activity per cell. Our findings show that minimizing the use of Triton-X100 will reduce both immediate and long-term cell loss. A treatment with /cell Triton-X100, a concentration that facilitates intranuclear labeling with antibodies, allows cells to retain both metabolic and proliferative capacities. Surprisingly, the immediate restoration of membrane integrity does not appear to be a prerequisite for cell function. No lag in the rate of proliferation is observed in the first after treatment, despite that fact that only of metabolically active cells recover full membrane integrity in this time. All cell lines evaluated here exhibited similar sensitivities to Triton-X100 treatment. The minimum effective concentration required for dextran uptake did not significantly vary between cell lines. All cells showed a dose-dependent response, with the percentage of viable cells remaining after treatment decreasing as the concentration of Triton-X100 was increased. No significant differences were observed in cell viability between cell lines. When the rate of population doubling was evaluated in both squamous cell carcinoma and primary epithelial cell lines, Triton-X100 treatment was found to have no significant effect on either population. On the basis of these results, we believe that Triton-X100 treatment may useful in a range of mammalian cells. In thinking about potential applications of Triton-X100 mediated permeabilization, it is important to recognize the limitations of this approach. Triton-X100 treatment, even at the low concentrations used here, may have deleterious effects on cells. We observe that antibody labeling of permeabilized cells is specific and reproducible, suggesting that unbound antibodies are removed during cell washing steps. Triton-X100 has been reported to release intracellular proteins,24, 28 modulate the activity of intracellular enzymes,19 and reorganize membrane domains.29 These effects, however, do not appear to affect the ability of cells to recover membrane integrity, MTT reduction capacity, or proliferative activity. Triton-X100 cannot be used to target specific cell populations, because all topically treated cells are permeabilized. Thus, Triton-X100 mediated permeabilization will be most useful for applications requiring delivery of contrast agents to large populations of live cells. Triton-X100 permeabilization holds several advantages over existing intracellular contrast agent delivery techniques. Unlike microinjection, which is only useful for studying small numbers of cells, Triton-X100 can simultaneously deliver both targeted and untargeted contrast agents to any number of cells. Cell loading is more uniform than can be achieved with electroporation; thus, no secondary purification step is required to isolate populations of uniformly loaded cells. Triton-X100 can be used as a pretreatment or coadministered with the macromolecules to be delivered. Contrast agent delivery is not dependent on natural cell uptake mechanisms, allowing cells to be labeled quickly and reproducibly. We believe that Triton-X100, when combined with molecular specific contrast agents, will provide a useful tool for in situ optical studies. 5.ConclusionsIn summary, Triton-X100 can be used at subsolubilizing concentrations to permeabilize the cytoplasm and nucleus in a variety of mammalian cells. Targeted and untargeted molecules ranging from in weight can be reproducibly delivered into adherent cells by controlling the concentration of Triton-X100 relative to the number of cells to be treated. Permeabilization of the cell cytoplasm appears to be a threshold event, whereas nuclear permeabilization is dependent on both macromolecule size and Triton-X100 concentration. When Triton-X100 as used at or near the minimum effective concentration, cell permeabilization is generally reversed in . Treated cells continue to proliferate and show metabolic activity during the restoration of membrane integrity. Increasing Triton-X100 beyond the minimum effective concentration reduces both short- and long-term cell survival. Different cell lines exhibit similar sensitivities to Triton-X100 treatment, suggesting that Triton-X100 mediated permeabilization will be widely useful. We conclude that Triton-X100 is a promising permeabilization agent for efficient, reproducible, and scalable delivery of optical contrast agents into live mammalian cells. AcknowledgmentsWe thank Vivian Mack for assistance with cell culture. This work was supported in part by an NIH BRP Grant (No. CA103830) and a training fellowship from the Keck Center Nanobiology Training Program of the Gulf Coast Consortia (NIH Grant No. 5 T90 DK071054-03). ReferencesA. L. Carlson, A. M. Gillenwater, M. D. Williams, A. K. El-Naggar, and R. R. Richards-Kortum,
“Confocal microscopy and molecular-specific optical contrast agents for the detection of oral neoplasia,”
Technol. Cancer Res. Treat., 6
(5), 361
–374
(2007). 1533-0346 Google Scholar
W. Li, F. Li, Q. Huang, B. Frederick, S. Bao, and C.-Y. Li,
“Noninvasive imaging and quantification of epidermal growth factor receptor kinase activation in vivo,”
Cancer Res., 68
(13), 4990
–4997
(2008). 0008-5472 Google Scholar
K. E. Adams, S. Ke, S. Kwon, F. Liang, Z. Fan, Y. Lu, K. Hirschi, M. E. Mawad, M. A. Barry, and E. M. Sevick-Muraca,
“Comparison of visible and near-infrared wavelength-excitable fluorescent dyes for molecular imaging of cancer,”
J. Biomed. Opt., 12
(2), 024017
(2007). https://doi.org/10.1117/1.2717137 1083-3668 Google Scholar
J. L. Kovar, W. M. Volcheck, J. Chen, and M. A. Simpson,
“Purification method directly influences effectiveness of an epidermal growth factor-coupled targeting agent for noninvasive tumor detection in mice,”
Anal. Biochem., 361
(1), 47
–54
(2007). 0003-2697 Google Scholar
Y. Koyama, T. Barrett, Y. Hama, G. Ravizzini, P. L. Choyke, and H. Kobayashi,
“In vivo molecular imaging to diagnose and subtype tumors through receptor-targeted optically labeled monoclonal antibodies,”
Neoplasia, 9
(12), 1021
–1029
(2007). 1522-8002 Google Scholar
S. B. Lee, M. Hassan, R. Fisher, O. Chertov, V. Chernomordik, G. Kramer-Marek, A. Gandjbakhche, and J. Capala,
“Affibody molecules for in vivo characterization of HER2-positive tumors by near-infrared imaging,”
Clin. Cancer Res., 14
(12), 3840
–3849
(2008). 1078-0432 Google Scholar
S. K. Chang, I. Rizvi, N. Solban, and T. Hasan,
“In vivo Optical molecular imaging of vascular endothelial growth factor for monitoring cancer treatment,”
Clin. Cancer Res., 14
(13), 4146
–4153
(2008). 1078-0432 Google Scholar
M. V. Backer, Z. Levashova, V. Patel, B. T. Jehning, K. Claffey, F. G. Blankenberg, and J. M. Backer,
“Molecular imaging of VEGF receptors in angiogenic vasculature with single-chain VEGF-based probes,”
Nat. Med., 13
(4), 504
–509
(2007). 1078-8956 Google Scholar
V. Kersemans, K. Kersemans, and B. Cornelissen,
“Cell penetrating peptides for in vivo molecular imaging applications,”
Curr. Pharm. Des., 14
(24), 2415
–2447
(2008). 1381-6128 Google Scholar
G. Ruan, A. Agrawal, A. I. Marcus, and S. Nie,
“Imaging and tracking of tat peptide-conjugated quantum dots in living cells: new mnsights into nanoparticle uptake, intracellular transport, and vesicle shedding,”
J. Am. Chem. Soc., 129
(47), 14759
–14766
(2007). 0002-7863 Google Scholar
S. Kumar, N. Harrison, R. Richards-Kortum, and K. Sokolov,
“Plasmonic nanosensors for imaging intracellular biomarkers in live cells,”
Nano Lett., 7
(5), 1338
–1343
(2007). https://doi.org/10.1021/nl070365i 1530-6984 Google Scholar
K. E. Bullok, S. T. Gammon, S. Violini, A. M. Prantner, V. M. Villalobos, V. Sharma, and D. Piwnica-Worms,
“Permeation peptide conjugates for in vivo molecular imaging applications,”
Mol. Imaging, 5
(1), 1
–15
(2006). 1535-3508 Google Scholar
H. Shogomori and D. A. Brown,
“Use of detergents to study membrane rafts: the good, the bad, and the ugly,”
Biol. Chem., 384
(9), 1259
–1263
(2003). 1431-6730 Google Scholar
J. P. Andersen, M. Le Maire, U. Kragh-Hansen, P. Champeil, and J. V. Moller,
“Perturbation of the structure and function of a membranous -ATPase by non-solubilizing concentrations of a non-ionic detergent,”
Eur. J. Biochem., 134
(2), 205
–214
(1983). https://doi.org/10.1111/j.1432-1033.1983.tb07552.x 0014-2956 Google Scholar
A. Helenius and K. Simons,
“Solubilization of membranes by detergents,”
Biochim. Biophys. Acta, 415
(1), 29
–79
(1975). 0006-3002 Google Scholar
U. Kragh-Hansen, M. le Maire, J. P. Noel, T. Gulik-Krzywicki, and J. V. Moller,
“Transitional steps in the solubilization of protein-containing membranes and liposomes by nonionic detergent,”
Biochemistry, 32
(6), 1648
–1656
(1993). 0006-2960 Google Scholar
B. De Foresta, F. Henao, and P. Champeil,
“Cancellation of the cooperativity of binding to sarcoplasmic reticulum -ATPase by the non-ionic detergent dodecylmaltoside,”
Eur. J. Biochem., 223
(2), 359
–369
(1994). 0014-2956 Google Scholar
B. de Foresta, F. Henao, and P. Champeil,
“Kinetic characterization of the perturbation by dodecylmaltoside of sarcoplasmic reticulum -ATPase,”
Eur. J. Biochem., 209
(3), 1023
–1034
(1992). 0014-2956 Google Scholar
D. B. McIntosh and G. A. Davidson,
“Effects of nonsolubilizing and solubilizing concentrations of Triton X-100 on binding and -ATPase activity of sarcoplasmic reticulum,”
Biochemistry, 23
(9), 1959
–1965
(1984). 0006-2960 Google Scholar
G. Trejo-Tapia, J. Cuevas-Celis, G. Salcedo-Morales, J. L. Trejo-Espino, M. L. Arenas-Ocampo, and A. Jimenez-Aparicio,
“Beta vulgaris L. suspension cultures permeabilized with triton X-100 retain cell viability and betacyanines production ability: a digital image analysis study,”
Biotechnol. Prog., 23
(2), 359
–363
(2007). 8756-7938 Google Scholar
P. Brodelius,
“Permeabilization of plant cells for release of intracellularly stored products: viability studies,”
Appl. Microbiol. Biotechnol., 27
(5), 561
–566
(1988). 0175-7598 Google Scholar
R. Thimmaraju, N. Bhagyalakshmi, M. S. Narayan, and G. A. Ravishankar,
“Kinetics of pigment release from hairy root cultures of Beta vulgaris under the influence of pH, sonication, temperature and oxygen stress,”
Process Biochem. (Oxford, U.K.), 38
(7), 1069
–1076
(2003). 1359-5113 Google Scholar
R. Serrano, J. M. Gancedo, and C. Gancedo,
“Assay of yeast enzymes in situ: a potential tool in regulation studies,”
Eur. J. Biochem., 34
(3), 479
–482
(1973). 0014-2956 Google Scholar
H. W. David Hettwer,
“Protein release from Escherichia coli cells permeabilized with guanidine-HCl and Triton X100,”
Biosens. Bioelectron., 33
(7), 886
–895
(1989). 0956-5663 Google Scholar
P. G. Sacks, S. M. Parnes, G. E. Gallick, Z. Mansouri, R. Lichtner, K. L. Satya-Prakash, S. Pathak, and D. F. Parsons,
“Establishment and characterization of two new squamous cell carcinoma cell lines derived from tumors of the head and neck,”
Cancer Res., 48
(10), 2858
–2866
(1988). 0008-5472 Google Scholar
F. M. Yakes and B. Van Houten,
“Mitochondrial DNA damage is more extensive and persists longer than nuclear DNA damage in human cells following oxidative stress,”
Proc. Natl. Acad. Sci. U.S.A., 94
(2), 514
–519
(1997). https://doi.org/10.1073/pnas.94.2.514 0027-8424 Google Scholar
A. G. Ostermeyer, B. T. Beckrich, K. A. Ivarson, K. E. Grove, and D. A. Brown,
“Glycosphingolipids are not essential for formation of detergent-resistant membrane rafts in melanoma cells. methyl-beta-cyclodextrin does not affect cell surface transport of a GPI-anchored protein,”
J. Biol. Chem., 274
(48), 34459
–34466
(1999). 0021-9258 Google Scholar
T. J. Naglak and H. Y. Wang,
“Recovery of a foreign protein from the periplasm of Escherichia coli by chemical permeabilization,”
Enzyme Microb. Technol., 12
(8), 603
–611
(1990). 0141-0229 Google Scholar
H. Heerklotz,
“Triton promotes domain formation in lipid raft mixtures,”
Biophys. J., 83
(5), 2693
–2701
(2002). 0006-3495 Google Scholar
|


