
|
|
1.IntroductionNumerous diseases are characterized by metabolic abnormalities that can be detected at plasmatic or serum levels through the quantification of biochemical components such as glucose, cholesterol, triglyceride, globulins, albumin, transferrin, enzymes, and ions. This explains the development of numerous biochemical methods aimed at quantifying, and more rarely at characterizing, specific serum components. However, most of the methods developed to date yield specific information on a particular component, whereas the determination of one component is frequently not sufficient, physicians needing a combination of biochemical parameters, in addition to clinical and imaging findings, to base their diagnosis.1, 2 For example, the diagnosis of a metabolic syndrome is based on the evaluation of a combination of positive criteria, including glucose, cholesterol, triglyceride, uricemia measurements, and a large number of other criteria to exclude other diseases or associated complications.3 Therefore, methodologies that provide an extensive view of the serum biochemical species levels from a unique and limited serum sample would certainly help in establishing an early diagnosis in addition to classical clinical, biological and imaging findings.4, 5 Ideally, the goal is to identify serum fingerprints useful for both diagnosis and prognosis.6 The mid-infrared infrared (MIR) domain contains most biological molecule spectral signatures through their functional groups.7, 8 This explains the development of Fourier transform infrared spectroscopy that enables the investigator to have true fingerprints of the fundamental functional chemical groups represented in biological samples.7, 8, 9, 10, 11, 12, 13, 14, 15 The recent development of chalcogenide glass optical fiber by our group is an essential step to remotely collecting MIR signals. Their unique and original tapered shape is also decisive to recording informative spectra from biological complex samples.16 The principle of the method is based on the general concept of fiber evanescent wave spectroscopy (FEWS), and remote spectroscopy using IR glass fibers gives the opportunity to have access to real-time spectra. Our hypothesis was that FEWS using IR glass fibers, combined with adequate statistical analysis, could give spectral fingerprints useful to perform a rapid classification of patients with diseases having metabolic consequences, and thus to obtain relevant information for the diagnosis. To demonstrate the concept, we chose to study sera obtained from patients exhibiting chronic liver diseases known to induce various alterations of a number of parameters related to both the etiology and the severity of the disease. We show that the implement of our highly sensitive optical fibers, such as an MIR remote sensor associated with modern statistical methods of spectral data could be a way to investigate metabolic alterations in patients. 2.Patients, Materials and Methods2.1.PatientsThe control group was constituted by old healthy volunteers . They were all included in the study during a systematic medical examination in a health care center (Centre d’Examens de Santé, Caisse Primaire d’Assurance Maladie de Rennes). They were all of Caucasian origin, devoid of known acute and/or chronic diseases as well as of excessive alcoholic consumption, and with a normal body mass index less than . The first disease group comprised 29 patients exhibiting systemic iron overload related to untreated genetic hemochromatosis (GH). The diagnosis was assessed by the presence of a homozygous C282Y mutation of the HFE gene. In addition, all the patients presented a phenotypic expression characterized by a serum transferrin saturation level above 50%, and a liver iron concentration estimated by magnetic resonance imaging17 (MRI) or biochemical determination over of dry weight liver. The blood samples were collected before the beginning of the iron depletive treatment. The second group of patients included 37 iron-depleted HFE hemochromatotic patients after the completion of intensive phlebotomies of the induction phase (DGH). They presented serum transferrin saturation levels below 45% and ferritinemia levels below . The third patient group was composed of 58 alcoholic cirrhotic patients (AC). The diagnosis was assessed on the clinical history of excessive alcohol consumption and the absence of other recognized liver disease etiology. All the patients were grade B or C with the Child-Pugh classification. 18 The fourth group included 67 patients with dysmetabolic hepatosiderosis (DYSH). They presented a dysmetabolic liver siderosis not linked to C282Y HFE homozygozity and characterized by increased of serum ferritin, unexplained increase of hepatic iron concentration ( dry weight liver) as determined by MRI examination, and an insulin resistance defined by one or more of the following findings: body mass index , abnormal glucose metabolism, dyslipidemia, or increased blood pressure. The study was approved by the local ethic committee (CCPPRB Comité Consultatif de Protection des Personnes se prêtant à la Recherche Biomédicale). 2.2.Laboratory ProceduresAll biological tests mentioned in Table 1 were performed in the biochemistry and haematology laboratories of the Pontchaillou Hospital in Rennes according to currently in force clinical guidelines. Peripheral venous blood was collected using plain tubes (Vacutainer Tube, Becton Dickinson, Grenoble, France) after an overnight fast, and all parameters were analysed on fresh samples. For infrared spectroscopic analysis, serum samples were stored at in vials from VWR (West Chester, Pennsylvania) (low temperature freezer polypropylene, silicone O-ring seal, sterile) until the analysis, which was performed twice. Table 1Bioclinical features of control and patient groups. Results are expressed as mean±SD . N=normal values; GH=untreated hereditary hemochromatosis; DGH=treated hereditary hemochromatosis; DYSH=dysmetabolic hepatosiderosis; AC=alcoholic cirrhosis. sTfR=soluble transferrin receptor; ALT=alanine amino transferase; AST=aspartate amino transferase; US CRP=ultrasensitive C reactive protein; p=comparison with the control group; and NS= non significant.
2.3.Infrared SpectroscopyPrinciples and materials used for this study were previously described.16, 19 Briefly, an analysis of serum was performed using a tapered optical fiber made with glass (TAS) with large optical transparency in the MIR range from . The diameter of the fiber, equal to , was reduced in the sensing area. The experimental setup consisted of a Fourier transformed infrared spectrometer (Bruker V22, Bruker Corporation, Billerica, Massachusetts) coupled with the fiber, and a cooled mercury-cadmium-telluride detector. A special kit provided by Bruker was connected to the spectrometer to focus the infrared beam from the black body to the input of the fiber. When chemical species are brought into contact with the fiber, the IR optical rays are partially absorbed at the interface following the attenuated total reflection rules. The optical signal is recorded at the output extremity of the fiber, providing the infrared single beam spectra. A reference single beam spectrum was obtained “in air” before each sample analysis. A serum sample drop was then placed in physical contact with the fiber. Fiber was then removed from the serum sample and 100 scans were acquired and summarized. Before a new sample analysis, the fiber was carefully washed using distilled water and a new air spectrum was collected. To investigate the impact of the TAS glass on the analysis, we performed two independent analyses on the same sample but using two different glass fibers at two different dates. 2.4.Discrimination MethodsA partial least squares logistic (PLS logistic) method was used to discriminate samples. 20 The PLS logistic is an extension of the multiple linear regression model, allowing the derivation of multiclass decision rules and thus classification of data.21 This model was described for instance in Ref. 21, and it is such that the probability that a patient belongs to a group given its recorded spectrum is related to the linear predictor by the logistic link where denotes the number of groups and the are parameters that are estimated by a penalized maximum likelihood method. denotes the value of the spectra for a set of wave numbers . In practice, no statistical feature selection is done in this analysis. The interpretation of this model is: the larger , the higher the probability for the patient to belong to the group . Here, is a linear combination of the values of the absorbance at the different wavenumbers. of the patients of each group were randomly selected to create the training group, which is used to estimate the parameter . The PLS was run on the whole transparency domain of the fiber, that is to say: 3800 to 2800 and . The diagnosis given by the physician and resulting from the clinical, biological, and imaging procedures used in a context of good medical practice was used as gold standard.The remaining patients were then considered as a test set to validate the classification algorithm. Each test spectrum was introduced in the fitted PLS-logistic model to return the probability of the corresponding patient to belong to each group. The patient was then classified within the group with the highest probability, and the predicted group is compared to the true group of the patient. To validate regression models, it is usual to perform cross-validation. Two approaches can be considered: the leaf-by-leaf validation and validation on the basis of a test sample that is randomly chosen on the basis of all observations. The advantage of the second approach is that it allows inferring on the robustness of the classification method by repeating the validation with several random test samples. Therefore, the discrimination analysis was repeated ten times with distinct training and test groups that were randomly selected from the different groups and expressed results that correspond to the means. Training and analysis were performed either with the five groups of patients, or using only two groups: the control group of healthy subjects and one group of diseased patients. The PLS-logistic method was also used to compare males and females. All computations, analyses, and graphics are executed with programs developed in Matlab v6.5 and Excel. To investigate if some wavelengths have an important weight in the discriminant analysis, we evaluate the discriminant power by multiplying each standardized absorbance by the parameter of the logistic model. In practice, the weights are close to zero when the absorbance at the corresponding wavelength is not discriminant, and are large (in absolute value) if it is discriminant. 2.5.Statistical AnalysisResults of classical biochemical tests are expressed as deviation (SD). SPSS statistical analysis was performed by using the nonparametric Mann-Whitney test. The performance of the two groups of PLS-logistic classification was analyzed using the construction of receiving operating characteristic (ROC) curves and by the calculation of the area under the ROC (AUROC) using programs developed in Matlab. The ROC curve is a graphical plot of the sensitivity versus for a binary classifier system as its discrimination threshold is varied. The cutoff of the regression score was identified through the calculation of the highest Youden index ( -1), which gives a global index on the global performance of the test.22 The performance of the five groups’ PLS-logistic classification cannot be represented using ROC curves and is thus illustrated by a confusion matrix of classification as indicated in Table 2 . Table 2Confusion matrix for the five studied groups. The whole population, i.e., the five control and patients groups, were included in a global study that aimed at addressing each patient to the correct group using FEWS analysis compared to the bioclinical standard. Results are expressed in percentage corresponding to the mean of ten runs. The two independent analyses gave similar results which are both presented: the first number corresponds to the first analysis and the second one to the second analysis.
3.Results3.1.Bioclinical FindingsClinical and biological findings are indicated in Table 1. All the findings were in accordance with those previously reported in the literature and are characteristic of the different groups of patients. Untreated genetic hemochromatotic patients were characterized, as expected, by an increase of all the serum iron parameters (serum iron, transferrin saturation, and ferritin) compared to healthy volunteers.23 In addition, they presented: 1. a slight but significant decrease of albumin, transferrin, alpha2 and beta-globulins, cholesterol including both HDL and LDL, and calcemia; and 2. a slight increase of glycemia, triglycerides, AST, and ALT. Iron depleted genetic hemochromatosis normalized their iron parameters as expected23 and in addition exhibited persistent decrease of albumin, transferrin, and beta-globulins, as well as of HDL cholesterol and calcemia. The glycemia remained high, and AST was found decreased as compared to the control group. The hypoferritinemia was related to the fact that the completion of iron depletion was judged on a drop of ferritinemia, which reflects the iron stores 24 and therefore the efficiency of the iron depletive treatment. In the DYSH patient group, the level of a large number of markers of protein, glucose and lipid metabolisms were significantly different from those found in the control group, 25 but the modulation remained moderate compared to those found in the cirrhotic group of patients. In addition, patients presented an increase of ferritin protein, reflecting an increase of iron stores. The alcoholic cirrhotic patient group exhibited the most important metabolic disturbances in terms of both number and severity of affected parameters. The only parameters that were not distinct from the control group were: beta-globulins, triglycerides, creatinine, ferritin, ALT, and transferrin saturation. 3.2.Fiber Evanescent Wave Spectroscopy Mid-Infrared SpectraThe mid-infrared spectral domain encompasses the range. Attribution of absorbance bands has been previously reported.8 Absorbance related to the serum samples (Fig. 1 ) are essentially found between 3600 and as well as between 1700 and . The presence of functional groups present in proteins was revealed between 3100 and for NH amide A and 1200 and for the amide I, II, and III, respectively. The lipid absorption bands show up at and due to the presence of methylene and methyl C–H bonds and the triglycerides and phospholipids ester bonds, The glucids C–O–C vibrations show up between 900 and . Despite the possibilities of differences from one spectrum to another, visual analysis of spectra did not permit us to discriminate patients regarding the disease. However, the PLS-logistic model allows discriminating of the spectra thanks to the weights applied to the spectrum’s values at the critical wave numbers. Figure 2 shows that the discrimination method between the different groups is based on a global signature encompassing lipids, proteins, and sugar spectral domains. Despite the fact that some wavelengths strongly contribute to the analysis, the best results are obtained using the whole spectra. Fig. 1Typical FEWS spectrum. This spectrum was obtained from human normal serum. The figure displays the various frequency domains of absorbance of biomolecules. The overall spectra was used for discriminant analysis. Region A: protein amides A and B bands. Region B: , of lipids. Region C: proteins amide I and II bands. Region D: fatty acids and amino acids. Region E: phospholipids. Region F: polysaccharides. 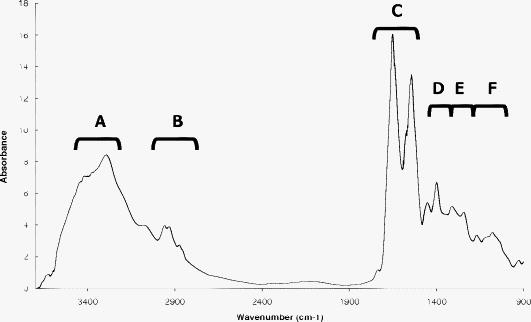 Fig. 2Discriminating spectral domains. The figure displays a typical MIR spectrum acquired from blood samples. Superimposed to this spectrum, the statistical weights are featured both by the symbol sizes of the spectral curve and, for better visibility, by an histogram exhibiting the relative values of . This histogram clearly emphasizes that the discrimination between groups is based on a global signature, which encompasses spectral domains reflecting as a whole lipids, proteins, and sugars.  3.3.ROC CurvesTo express results obtained from the PLS-logistic model, ROC curves were plotted (Fig. 3 ). The faster the ROC curve climbs toward the upper left-hand corner of the graph, the more the discrimination method is efficient. We observe that the proposed method was particularly efficient for the cirrhotic and DYSH patients, while its performance for the other patients was inferior. The area under ROC curves (AUROC) was computed to assess overall performance of our experiments. AUROC values, averaged from 10 PLS-logistic runs on the same sample, were for cirrhotic patients, for DYSH patients, for iron-depleted hemochromatotic patients, and for untreated hemochromatotic patients. Sensitivity, specificity, and positive and negative predictive values, determined using the optimum Youden index, are reported in Table 3 . The second set of analysis gave similar results. Fig. 3ROC curves for patient classification using PLS regression. The line represents the average of ten runs for which the training group ( of patients) and test group ( of patients) were randomly selected. (a) Iron desaturated genetic hemochromatotic patients (DGH) and control patients. (b) Iron overloaded genetic hemochromatotic patients (GH) and control patients. (c) Alcoholic cirrhotic patients (AC). (d) Patients with dysmetabolic hepatosiderosis (DYSH). The corresponding AUROC are indicated on graphs. Standard deviations obtained from the ten runs are indicated on the graphs.  Table 3Performance of FEWS, as clinical predictor, evaluated in the test groups. Values are given for the cutoff of the regression score, which corresponds to the highest Youden index. (AC: alcoholic Cirrhosis; DYSH: dysmetabolic hepatosiderosis; DGH: iron depleted genetic hemochromatosis; GH untreated genetic hemochromatosis; Se: sensitivity; Sp: specificity; PV: predictive value; AUROC: area under ROC curve; and CI: confiance interval).
It is noteworthy that we were unable to discriminate between male and female in the validation group. 3.4.Patient Discrimination between GroupsTo investigate the possibility to correctly address the patient in a more complex situation, we used the PLS method on the whole population. Results are reported in Table 2. We found that both controls and cirrhotic patients of the test group were correctly classified with success scores of 70 and 75%, respectively. Accurate classification was found in 55 to 75% of the cases for dysmetabolic hepatosiderosis patients, whereas most of them were not correctly classified in both hemochromatotic patient groups. 4.DiscussionMost systemic diseases lead to the development of metabolic consequences, which in turn expose patients to the development of complications that engage functional or vital prognosis. Such metabolic consequences, which are the direct consequence of cellular metabolism alterations, can be detected in plasma and/or serum. However, to date, each metabolic abnormality is searched through the quantitative assessment of individual biochemical parameters, including the evaluation of the different glucid, lipid, and protein species.1, 2 This clearly implies that the physician must a priori hypothesize that one or more specific biochemical parameters are altered in the patient. In addition, current biochemical procedures explore only the serum components that have been previously characterized, and most of the biochemical tests do not provide qualitative assessment of biomolecules. Thus, during chronic alcoholism in absence of cirrhosis, the transferrin protein level is not altered, whereas an alteration of the glycosylation process, not evaluated by routine test, can be found.26 The quantification of combined known biological species quantification has been proposed to classify diseases such as Alzheimer disease27 and liver fibrosis stage.28, 29 In addition, the development of new methodologies giving wide overview of metabolic profiling could be useful for diagnosis and has been proposed through the use of technologies devoted to metabolome characterization. Thus, surface-enhanced laser desorption ionization time of flight (SELDI-TOF) technology provides new hope. Indeed, this technology gives the opportunity to obtain more global information by providing peptide profiles that are supposed to reflect the pathological state by the modification of ratios between the different peaks (reviews in Refs. 30, 31). However, even though this technology is promising, the obtained information is only partial because the profiling is restricted to low molecular weight peptides (hence excluding most proteins) and, in addition, does not reflect the glucid and lipid metabolisms that can provide valuable information. In addition, some pitfalls requiring improvement of the methodology have been identified.32 Taken altogether, it appears that the acquisition of global metabolic profiling through the SELDI-TOF method is time and cost consuming and not exhaustive. Alternatively, the single shot acquisition of a global metabolic profiling could therefore be useful to improve patient care. The use of spectroscopy has been proposed to evaluate fingerprints in biomedia.8 Thus, on one hand, near-infrared spectroscopy that explores wavelengths comprised between , and allows the investigation of harmonic and combinatory vibrations of C–O, C–H, and N–O is proposed to characterize biological samples. NIR spectroscopy is used to measure oxygenation of tissue (review in Ref. 33) and has been reported useful for other applications such as evaluation of water content, tumoral process in diseased skin,34, 35 and of coronary artery plaque vulnerability.36 On other hand, the MIR domain (review in Ref. 8) explores the wavenumber domain, and gives more global information due to the fact that the IR absorption in this domain reflects the fundamentals of the vibrations of the biomolecule functional groups present in complex biological fluids. Moreover, the location of specific peaks related to one specific chemical group may be altered by the presence of other molecules and/or functional groups.7 Therefore, the spectra acquired in the MIR domain give access to multiple peaks representing a large number of functional groups present in proteins, lipids, and glucides. However, the OH vibration peak of water, always found in samples, overlaps with some bands, including amides bands. Despite this potential limitation, and taking advantage of the physical properties of the light diffusion within the TAS optic fiber, we decide to test the usefulness of the MIR FEWS approach to search for discriminating metabolic profiles by analyzing human serum samples with various metabolic diseases. IR TAS glass fiber light transmission permits us to take advantage of the evanescent wave that propagates all along the fiber,16, 37, 38, 39, 40, 41, 42, 43 and thus to perform FEWS. The general principle of this remote spectroscopy has already been described,44 but for the first time here it is applied to a large scale medical study. Thus, the present work converts MIR FEWS into a technology with potential interest for the physician. The following points are essential to explain the sensitivity of our FEWS spectra compared to the classical way of collecting MIR spectra, by transmission or using an ATR plate. First, the recent development of tapered glass fiber exhibiting a diameter smaller than on the sensing zone drastically increases the intensity of the evanescent wave propagating along the fiber, amplifying then the optical coupling interaction with the serum. 16, 19, 45 Second, the hydrophobic behavior of the covalent chalcogenide glasses enables us to emphasize the infrared signal absorbed by the biological molecules to the detriment of the invasive signal of water, which is the main medium in the serum.41 To validate the interest of this method, we have explored, by comparison with a normal group, patients with chronic liver diseases. Such diseases are known to have a potential impact on serum biochemical parameters, as illustrated in Table 1. This is related to the central role that the liver plays in the control of major metabolisms. Thus, as expected, GH impacts mainly the serum iron parameters but may also have other slight biochemical impacts on other parameters. The serum iron parameters were normalized after iron depletive treatment in the treated GH group. In the cirrhotic group, the major hepatic dysfunction affects most of the biochemical parameters studied. Finally, DYSH is mainly associated with disturbances in lipid (triglycerids and HDL cholesterol) and glucid metabolism, but also with increased iron stores reflected by ferritin increase. Therefore, we were expecting that FEWS-IR spectroscopy could discriminate these situations that differ by the metabolisms involved and the severity of the disease. The sole inspection of individual spectra did not allow identifying abnormalities that characterize a particular pathological state. Therefore, we used supervised classification based on PLS-logistic regression to discriminate spectra and then patients. The obtained results may be improved in the future if the signal-to-noise ratio (SNR) could be increased. ROC curves demonstrate that applying the algorithm obtained in the training group by comparing each pathological group with the control group allowed us to correctly classify most of the cirrhotic patients as well as those presenting dysmetabolic hepatosiderosis. This is likely related to the presence of significant metabolic alterations found in these two groups of patients, especially in cirrhotic patients for which the number of altered parameters and the intensity of the modulation, compared to normal values, are major. Indeed, alcoholic cirrhotic patients in our study presented severe hepatic dysfunction with multiple biochemical alterations including proteins, glucids, and lipids. Patients with dysmetabolic hepatosiderosis also exhibited metabolism alterations especially involving lipids and glucids parameters, but the relative difference compared to normal values is lower, and a more reduced number of parameters related to proteins is affected (Table 1). At variance, we were not able to correctly classify iron saturated or depleted hemochromatotic patients despite alterations and which are known to induce oxidative stress toward biomolecules in iron saturated groups.46 Whether the small but significant difference of age in cirrhotic and dysmetabolic patients, which are older than those in the three other groups, may have an impact on the FEWS-IR analysis needs to be discussed. Considering that: 1. within the biochemical parameters usually evaluated in serum most of them are not influenced by age, and the normal range is not affected by age in the adult population, except for lipid metabolism, for which normal values are only very slightly different with age in adults,47 and 2. such modulations are extremely moderate regarding the intensity of alterations found in biochemical parameters in cirrhotic and dysmetabolic groups, they could only have a slight impact on the analysis. In addition, it is noteworthy that the best performance of the analysis is obtained when the entire spectrum is considered, and not only one or some specific wavelength that could only reflect parameters related to a single metabolism. This last point clearly underlines the global investigation that FEWS-IR analysis permits. The previously described procedure, based on the comparison between one pathological group and one control group, implies that the physician hypothesizes one diagnosis for the patient. However, in most cases, the diagnostic hypothesis is less precise and more than one diagnosis can be evoked. To test the possibility to classify a given patient among a panel of possible diseases, we tested our capacity to correctly identify the cirrhotic and dysmetabolic patients among the five possible groups. Despite that common metabolic abnormalities can be found in the different groups, such as glucid and lipid alterations in both cirrhotic and dysmetabolic patients, we were clearly able to discriminate these patients. This is likely related to the fact that the spectral analysis gives a large number of data, thus performing true metabolic profiling (Fig. 2), characteristic of each situation. In conclusion, our results suggest that the concept of the metabolic profiling using IR-FEWS could be a way to investigate diseases having metabolic consequences in patients. AcknowledgmentsThis work was supported by the COREC from the Rennes University Hospital, and by a PRIR of Region Bretagne (CAPBIO). The authors thank Professor Yves Deugnier for his participation in the clinical study by including patients. ReferencesH. C. Sox,
“The evaluation of diagnostic tests: principles, problems, and new developments,”
Annu. Rev. Med., 47 463
–471
(1996). https://doi.org/10.1146/annurev.med.47.1.463 0066-4219 Google Scholar
A. Tatsioni, D. A. Zarin, N. Aronson, D. J. Samson, C. R. Flamm, C. Schmid, and J. Lau,
“Challenges in systematic reviews of diagnostic technologies,”
Ann. Intern Med., 142
(12), 1048
–1055
(2005). 0003-4819 Google Scholar
R. H. Eckel, S. M. Grundy, and P. Z. Zimmet,
“The metabolic syndrome,”
Lancet, 365
(9468), 1415
–1428
(2005). https://doi.org/10.1016/S0140-6736(05)66378-7 0140-6736 Google Scholar
L. K. Schnackenberg,
“Global metabolic profiling and its role in systems biology to advance personalized medicine in the 21st century,”
Expert. Rev. Mol. Diagn., 7
(3), 247
–259
(2007). https://doi.org/10.1586/14737159.7.3.247 Google Scholar
L. K. Schnackenberg and R. D. Beger,
“Monitoring the health to disease continuum with global metabolic profiling and systems biology,”
Pharmacogenomics, 7
(7), 1077
–1086
(2006). https://doi.org/10.2217/14622416.7.7.1077 1462-2416 Google Scholar
G. Schlotterbeck, A. Ross, F. Dieterle, and H. Senn,
“Metabolic profiling technologies for biomarker discovery in biomedicine and drug development,”
Pharmacogenomics, 7
(7), 1055
–1075
(2006). https://doi.org/10.2217/14622416.7.7.1055 1462-2416 Google Scholar
M. Jackson and H. Mantsch,
“Biomedical infrared spectroscopy,”
Infrared Spectroscopy of Biomolecules, 311
–340
(1996) Google Scholar
M. N. Pons, S. Le Bonte, and O. Potier,
“Spectral analysis and fingerprinting for biomedia characterisation,”
J. Biotechnol., 113
(1–3), 211
–230
(2004). https://doi.org/10.1016/j.jbiotec.2004.03.028 0168-1656 Google Scholar
M. Jackson, J. R. Mansfield, B. Dolenko, R. L. Somorjai, H. H. Mantsch, and P. H. Watson,
“Classification of breast tumors by grade and steroid receptor status using pattern recognition analysis of infrared spectra,”
Cancer Detect. Prev., 23
(3), 245
–253
(1999). https://doi.org/10.1046/j.1525-1500.1999.99025.x 0361-090X Google Scholar
D. Naumann,
“Infrared spectroscopy in microbiology,”
Encyplopedia of Analytical Chemistry, 102
–131 Wiley and Sons Ltd., Chichester, UK
(2000). Google Scholar
D. Rohleder, G. Kocherscheidt, K. Gerber, W. Kiefer, W. Kohler, J. Mocks, and W. Petrich,
“Comparison of mid-infrared and Raman spectroscopy in the quantitative analysis of serum,”
J. Biomed. Opt., 10
(3), 031108
(2005). https://doi.org/10.1117/1.1911847 1083-3668 Google Scholar
S. Spassov, M. Beekes, and D. Naumann,
“Structural differences between TSEs strains investigated by FT-IR spectroscopy,”
Biochim. Biophys. Acta, 1760
(7), 1138
–1149
(2006). 0006-3002 Google Scholar
N. Toyran, P. Lasch, D. Naumann, B. Turan, and F. Severcan,
“Early alterations in myocardia and vessels of the diabetic rat heart: an FTIR microspectroscopic study,”
Biochem. J., 397
(3), 427
–436
(2006). https://doi.org/10.1042/BJ20060171 0264-6021 Google Scholar
P. Lasch and D. Naumann,
“Spatial resolution in infrared microspectroscopic imaging of tissues,”
Biochim. Biophys. Acta, 1758
(7), 814
–829
(2006). https://doi.org/10.1016/j.bbamem.2006.06.008 0006-3002 Google Scholar
M. Beekes, P. Lasch, and D. Naumann,
“Analytical applications of Fourier transform-infrared (FT-IR) spectroscopy in microbiology and prion research,”
Vet. Microbiol., 123
(4), 305
–319
(2007). https://doi.org/10.1016/j.vetmic.2007.04.010 0378-1135 Google Scholar
S. Hocde, O. Loréal, O. Sire, C. Boussard-Pledel, B. Bureau, B. Turlin, J. Keirsse, P. Leroyer, and J. Lucas,
“Metabolic imaging of tissues by infrared fiber-optic spectroscopy: an efficient tool for medical diagnosis,”
J. Biomed. Opt., 9
(2), 404
–407
(2004). https://doi.org/10.1117/1.1646415 1083-3668 Google Scholar
Y. Gandon, D. Olivie, D. Guyader, C. Aube, F. Oberti, V. Sebille, and Y. Deugnier,
“Non-invasive assessment of hepatic iron stores by MRI,”
Lancet, 363
(9406), 357
–362
(2004). https://doi.org/10.1016/S0140-6736(04)15436-6 0140-6736 Google Scholar
J. Boursier, E. Cesbron, A. L. Tropet, and C. Pilette,
“Comparison and improvement of MELD and Child-Pugh score accuracies for the prediction of mortality in cirrhotic patients,”
J. Clin. Gastroenterol., 43
(6), 580
–585
(2009). https://doi.org/10.1097/MCG.0b013e3181889468 0192-0790 Google Scholar
J. Keirsse, E. Lahaye, A. Bouter, V. Dupont, C. Boussard-Pledel, B. Bureau, J. L. Adam, V. Monbet, and O. Sire,
“Mapping bacterial surface population physiology in real-time: infrared spectroscopy of Proteus mirabilis swarm colonies,”
Appl. Spectrosc., 60
(6), 584
–591
(2006). https://doi.org/10.1366/000370206777670558 0003-7028 Google Scholar
J. Zhu and T. Hastie,
“Classification of gene microarrays by penalized logistic regression,”
Biostat., 5
(3), 427
–443
(2004). https://doi.org/10.1093/biostatistics/kxg046 Google Scholar
G. Fort and S. Lambert-Lacroix,
“Classification using partial least squares with penalized logistic regression,”
Bioinformatics, 21
(7), 1104
–1111
(2004). https://doi.org/10.1093/bioinformatics/bti114 1367-4803 Google Scholar
H. Huang, M. L. Shiffman, S. Friedman, R. Venkatesh, N. Bzowej, O. T. Abar, C. M. Rowland, J. J. Catanese, D. U. Leong, J. J. Sninsky, T. J. Layden, T. L. Wright, T. White, and R. C. Cheung,
“A 7 gene signature identifies the risk of developing cirrhosis in patients with chronic hepatitis C,”
J. Hepatol, 46
(2), 297
–306
(2007). https://doi.org/10.1002/hep.21695 0168-8278 Google Scholar
C. Le Lan, O. Loreal, T. Cohen, M. Ropert, H. Glickstein, F. Laine, M. Pouchard, Y. Deugnier, A. Le Treut, W. Breuer, Z. I. Cabantchik, and P. Brissot,
“Redox active plasma iron in C282Y/C282Y hemochromatosis,”
Blood, 105
(11), 4527
–4531
(2005). https://doi.org/10.1182/blood-2004-09-3468 0006-4971 Google Scholar
P. Brissot, M. B. Troadec, E. Bardou-Jacquet, C. Le Lan, A. M. Jouanolle, Y. Deugnier, and O. Loreal,
“Current approach to hemochromatosis,”
Blood Rev., 22
(4), 195
–210
(2008). https://doi.org/10.1016/j.blre.2008.03.001 0268-960X Google Scholar
R. Moirand, A. M. Mortaji, O. Loreal, F. Paillard, P. Brissot, and Y. Deugnier,
“A new syndrome of liver iron overload with normal transferrin saturation,”
Lancet, 349
(9045), 95
–97
(1997). https://doi.org/10.1016/S0140-6736(96)06034-5 0140-6736 Google Scholar
R. G. Batey and G. Madsen,
“The carbohydrate-deficient transferrin test in hospital practice,”
Drug Alcohol. Rev., 17
(1), 105
–109
(1998). https://doi.org/10.1080/09595239800187641 Google Scholar
S. Ray, M. Britschgi, C. Herbert, Y. Takeda-Uchimura, A. Boxer, K. Blennow, L. F. Friedman, D. R. Galasko, M. Jutel, A. Karydas, J. A. Kaye, J. Leszek, B. L. Miller, L. Minthon, J. F. Quinn, G. D. Rabinovici, W. H. Robinson, M. N. Sabbagh, Y. T. So, D. L. Sparks, M. Tabaton, J. Tinklenberg, J. A. Yesavage, R. Tibshirani, and T. Wyss-Coray,
“Classification and prediction of clinical Alzheimer’s diagnosis based on plasma signaling proteins,”
Nat. Med., 13
(11), 1359
–1362
(2007). https://doi.org/10.1038/nm1653 1078-8956 Google Scholar
T. Poynard, F. Imbert-Bismut, M. Munteanu, and V. Ratziu,
“FibroTest-FibroSURE: towards a universal biomarker of liver fibrosis?,”
Expert Rev. Mol. Diagn., 5
(1), 15
–21
(2005). https://doi.org/10.1586/14737159.5.1.15 Google Scholar
P. Cales, F. Oberti, S. Michalak, I. Hubert-Fouchard, M. C. Rousselet, A. Konate, Y. Gallois, C. Ternisien, A. Chevailler, and F. Lunel,
“A novel panel of blood markers to assess the degree of liver fibrosis,”
J. Hepatol, 42
(6), 1373
–1381
(2005). https://doi.org/10.1002/hep.20935 0168-8278 Google Scholar
M. Kiehntopf, R. Siegmund, and T. Deufel,
“Use of SELDI-TOF mass spectrometry for identification of new biomarkers: potential and limitations,”
Clin. Chem. Lab. Med., 45
(11), 1435
–1449
(2007). https://doi.org/10.1515/CCLM.2007.351 1434-6621 Google Scholar
T. C. Poon,
“Opportunities and limitations of SELDI-TOF-MS in biomedical research: practical advices,”
Expert Rev. Proteomics, 4
(1), 51
–65
(2007). https://doi.org/10.1586/14789450.4.1.51 Google Scholar
M. Dijkstra, R. J. Vonk, and R. C. Jansen,
“SELDI-TOF mass spectra: a view on sources of variation,”
J. Chromatogr. B Analyt. Technol. Biomed. Life Sci., 847
(1), 12
–23
(2007). https://doi.org/10.1016/j.jchromb.2006.11.004 Google Scholar
T. Hamaoka, K. K. McCully, V. Quaresima, K. Yamamoto, and B. Chance,
“Near-infrared spectroscopy/imaging for monitoring muscle oxygenation and oxidative metabolism in healthy and diseased humans,”
J. Biomed. Opt., 12
(6), 062105
(2007). https://doi.org/10.1117/1.2805437 1083-3668 Google Scholar
N. S. Eikje, K. Aizawa, and Y. Ozaki,
“Vibrational spectroscopy for molecular characterisation and diagnosis of benign, premalignant and malignant skin tumours,”
Biotechnol. Annu. Rev., 11 191
–225
(2005). https://doi.org/10.1016/S1387-2656(05)11006-0 Google Scholar
N. S. Eikje, Y. Ozaki, K. Aizawa, and S. Arase,
“Fiber optic near-infrared Raman spectroscopy for clinical noninvasive determination of water content in diseased skin and assessment of cutaneous edema,”
J. Biomed. Opt., 10
(1), 14013
(2005). https://doi.org/10.1117/1.1854682 1083-3668 Google Scholar
J. D. Caplan, S. Waxman, R. W. Nesto, and J. E. Muller,
“Near-infrared spectroscopy for the detection of vulnerable coronary artery plaques,”
J. Am. Coll. Cardiol., 47
(8), C92-6
(2006). https://doi.org/10.1016/j.jacc.2005.12.045 0735-1097 Google Scholar
D. Le Coq, K. Michel, J. Keirsse, C. Boussard-Pledel, G. Fonteneau, B. Bureau, J. Le Quéré, O. Sire, and J. Lucas,
“Infrared glass fibers for in-situ sensing chemical and biochemical reactions,”
C. R. Chim., 5 1
–7
(2003). 1631-0748 Google Scholar
H. Steiner, M. Jakusch, M. Kraft, M. Karlowatz, T. Baumann, R. Niessner, W. Konz, A. Brandenburg, K. Michel, C. Boussard-Pledel, B. Bureau, J. Lucas, Y. Reichlin, A. Katzir, N. Fleischmann, K. Staubmann, R. Allabashi, J. M. Bayona, and B. Mizaikoff,
“In situ sensing of volatile organic compounds in groundwater: first field tests of a mid-infrared fiber-optic sensing system,”
Appl. Spectrosc., 57
(6), 607
–613
(2003). https://doi.org/10.1366/000370203322005274 0003-7028 Google Scholar
P. Lucas, D. Le Coq, C. Juncker, J. Collier, D. E. Boesewetter, C. Boussard-Pledel, B. Bureau, and M. R. Riley,
“Evaluation of toxic agent effects on lung cells by fiber evanescent wave spectroscopy,”
Appl. Spectrosc., 59
(1), 1
–9
(2005). https://doi.org/10.1366/0003702052940387 0003-7028 Google Scholar
P. Lucas, M. R. Riley, C. Boussard-Pledel, and B. Bureau,
“Advances in chalcogenide fiber evanescent wave biochemical sensing,”
Anal. Biochem., 351
(1), 1
–10
(2006). https://doi.org/10.1016/j.ab.2005.10.045 0003-2697 Google Scholar
P. Lucas, M. Solis, D. Le Coq, C. Junker, M. R. Riley, J. Collier, D. E. Boesewetter, C. Boussard, and B. Bureau,
“Infrared biosensors using hydrophobic chalcogenide fibers sensitized with live cells,”
Sens. Actuators B, 119 355
–362
(2006). https://doi.org/10.1016/j.snb.2005.12.033 0925-4005 Google Scholar
K. Michel, B. Bureau, C. Boussard-Pledel, T. Jouan, J. Adam, K. Staubmann, and T. Baumann,
“Monitoring of pollutant in waste water by infrared spectroscopy using chalcogenide glass optical fibers,”
Sens. Actuators B, 101 252
–259
(2004). https://doi.org/10.1016/j.snb.2004.03.014 0925-4005 Google Scholar
X. Zhang, B. Bureau, P. Lucas, C. Boussard-Pledel, and J. Lucas,
“Glasses for seeing beyond visible,”
Chem., 14
(2), 432
–442
(2008). https://doi.org/10.1002/chem.200700993 Google Scholar
Y. Raichlin and A. Katzir,
“Fiber-optic evanescent wave spectroscopy in the middle infrared,”
Appl. Spectrosc., 62
(2), 32A
–72A
(2008). https://doi.org/10.1366/000370208783575456 0003-7028 Google Scholar
S. Hocde, C. Boussard-Pledel, G. Fonteneau, and J. Lucas,
“Chalcogens based glasses for IR fiber chemical sensors,”
Solid State Sci., 3
(3), 279
–284
(2001). https://doi.org/10.1016/S1293-2558(00)01135-3 1293-2558 Google Scholar
D. Galaris and K. Pantopoulos,
“Oxidative stress and iron homeostasis: mechanistic and health aspects,”
Crit. Rev. Clin. Lab Sci., 45
(1), 1
–23
(2008). https://doi.org/10.1080/10408360701713104 1040-8363 Google Scholar
“Plasma lipid distributions in selected North American populations: the Lipid Research Clinics Program Prevalence Study. The Lipid Research Clinics Program Epidemiology Committee,”
Circulation, 60
(2), 427
–439
(1979). 0009-7322 Google Scholar
|
|||||||||||||||||||||||||||||||||||||||||||||||||||||||||||||||||||||||||||||||||||||||||||||||||||||||||||||||||||||||||||||||||||||||||||||||||||||||||||||||||||||||||||||||||||||||||||||||||||||||||||||||||||||||||||||||||||||||||||||||||||||||||||||||||||||||||||||||||||||||||||||||||||||||||||||||||||||||||||||||||||||||||||||||||||||||||||||||||


