
|
|
1.IntroductionPositron emission tomography (PET) with 2-deoxy-2 fluoro-D-glucose (FDG) has experienced in the past decade a tremendous expansion in its applications to clinical medicine. Across a wide range of medical disciplines, this method is playing an ever-increasing role in disease staging, treatment monitoring, and surgical guidance.1 Moreover, the ability to noninvasively map glucose metabolism has had important ramifications not only in current clinical decision making but also in the preclinical evaluation of new therapies. The concept of metabolic imaging has been extended to other imaging modalities as well, including optical imaging. Optical imaging has several unique advantages compared to other imaging approaches: low relative cost, high temporal and spatial resolution, lack of ionizing radiation, and ready translation to minimally invasive and intraoperative imaging. One promising optical glucose analog is 2-( -(7-nitrobenz-2-oxa-1,3-diazol-4-yl)amino)-2-deoxyglucose (2-NBDG). This molecule, which consists of a small fluorochrome (molecular weight 164.2) attached to D-glucose at the C-2 position, fluoresces at when excited at . This fluorescent probe has been shown to be transported intracellularly by the same GLUT transporters as glucose, and also to undergo phosphorylation at the C-6 position, a reaction that causes the molecule to be retained within the cell, identical to the mechanism that causes FDG to be retained as well.2, 3, 4, 5, 6 Moreover, cellular uptake of 2-NBDG reflects the rate of cellular glycolysis, with malignant cells accumulating more of the probe than benign cells.7 The extension of this imaging probe beyond the realm of microscopy and into the domain of clinically relevant imaging techniques would allow for the highly desirable integration of optical and nuclear imaging. Such an extension would enable optical glucose imaging to augment and broaden current clinical FDG-PET imaging in ways that capitalize on the advantages of working in the optical spectrum. For example, an optical glucose probe opens the possibility of performing glucose metabolic imaging during minimally invasive procedures, including laparoscopy or colonoscopy. Moreover, optical glucose imaging would help bring presurgical FDG-PET imaging more easily into the operating rooms to assist with tumor resection. Current approaches such as intraoperative gamma counters8 suffer from limited fields of view, requiring the user to pass the device over all surfaces under investigation; an optical FDG analog would, on the other hand, greatly improve the conspicuity of pathologic tissue within a broad field of view. Finally, an optical glucose analog could supplement the use of FDG-PET as an endpoint in preclinical trials. We present a systematic evaluation of 2-NBDG as an optical analog to FDG-PET imaging, first by validating that 2-NBDG uptake accurately reports on glucose utilization on a cellular and whole animal scale, and then by demonstrating several applications for optical glucose imaging in minimally invasive and intraoperative settings. 2.Materials and Methods2.1.Optical Glucose Probe Preparation2-( -(7-nitrobenz-2-oxa-1, 3-diazol- 4-yl)amino)-2-deoxyglucose (2-NBDG) was commercially purchased (Invitrogen, California) and diluted to a stock solution of in phosphate-buffered saline (PBS). The stock solution was stored in a refrigerator. 2.2.Cell CultureTo demonstrate the relationship between 2-NBDG concentration and cellular uptake, the human metastatic colorectal cancer cell line HT-29 (ATCC, Manassas, Virginia) was grown in McCoy’s media supplemented with 10% fetal bovine serum (FBS). The cells were grown in 24 well plates at with 5% . When the cells reached 90% confluence, they were washed twice with Hank’s buffered salt solution (HBSS) and incubated for one hour in of growth media. 2-NBDG was then added to the media to achieve concentrations of 0, 0.1, 0.25, 0.5, or in the wells. The experiment was performed in triplicate, with three wells used for each concentration. The cells were incubated for with the probe, then washed in HBSS for and imaged using a commercial fluorescence imaging system (Olympus Small Animal Imaging System OV100, Olympus Corporation, Tokyo, Japan). The images acquired by this imaging platform were analyzed using CellProfiler9 to automatically segment and define cells within the image, and the mean fluorescence per cell was calculated in this manner. We then sought to demonstrate that cellular uptake of 2-NBDG could be inhibited by excess glucose in the growth media. For this experiment, the highly glycolytic human breast cancer cell line MCF-7 (ATCC, Manassas, Virginia) was grown in McCoy’s media supplemented with 10% FBS and 1% penicillin/streptomycin. The cells were grown in 24 well plates at with 5% . When the cells reached 90% confluence, they were washed twice with HBSS and incubated for one hour in of media. A solution containing D-glucose dissolved in PBS was then added to the wells to reach final concentrations of excess media glucose of 0, 5, 10, or in the wells. Along with the glucose solution was added 2-NBDG. The experiment was performed in triplicate, with three wells for each glucose concentration. The cells were incubated with the 2-NBDG and excess glucose for ; following this, they were washed in HBSS for and then imaged and analyzed using the OV100 imaging system and CellProfiler software, as described previously. The glucose inhibition experiment was repeated using FDG to assess for a similar inhibitory pattern. The procedure for this experiment was as before, except that following the HBSS wash, the cells were harvested with trypsin and centrifuged at 1000 revolutions per minute for . The supernatant was discarded, and the cells were resuspended in HBSS. They were then analyzed using a gamma counterplate reader (Wallac Wizard 1480 Automatic Gamma Counter; GMI, Ramsey, Minnesota). To correlate the FDG results with the 2-NBDG data, the fluorescence and gamma counter results were normalized to their respective values for the cells that were incubated with no excess media glucose, and the fold decrease with the addition of the three concentrations of glucose was calculated. 2.3.Subcutaneous Tumor ImagingThe human colorectal cancer cell line HT-29 was grown as described. Before the cells reached confluence, they were harvested by trypsinization, resuspended in HBSS, and injected into the subcutaneous space in the left flank of athymic nude mice (nu/nu; Taconic, Germantown, New York). Once the tumors were greater than , the change in 2-NBDG uptake by fasting was assessed in a crossover trial designed in the following manner. Half of the mice were kept nil per os (NPO) for , while the other half were allowed to feed ad libidum; all mice then received of 2-NBDG via tail vein injection and then underwent multispectral fluorescence imaging (Maestro In-Vivo Imaging System, Cambridge Research and Instrumentation, Woburn, Massachusetts) thirty minutes later. Prior to 2-NBDG imaging, a dark fluorescence background was acquired as well. The mice were then allowed to feed freely for two days. Following this, the two groups were reversed: the original group of mice that had been kept NPO were allowed to feed ad libidum, while the other half were kept NPO for . After , of 2-NBDG were then injected via tail vein in all animals, and multispectral fluorescence imaging was again performed on the mice. The fluorescence spectrum corresponding to the 2-NBDG signal within the tumor was isolated by removing the spectral contributions of the mouse skin and imaging plate autofluorescence and reflection. Regions of interest (ROIs) were drawn within the tumor in the 2-NBDG spectral image to quantify the change in 2-NBDG signal between the animals’ fed and fasting states. 2.4.Seizure Model ImagingGeneralized seizures were induced in a mouse using a previously described method.10, 11 Seizures were generated by the intraperitoneal (i.p.) injection of pilocarpine in a nude mouse; a control arm was established with the i.p. injection of saline in another mouse. Ten minutes prior to pilocarpine injection, of scopolamine was injected subcutaneously to prevent peripheral cholinergic activity. Within minutes of the pilocarpine injection, the animal was noted to demonstrate irregular muscle contractions and rapid eye blinking behavior. Both the seizure model animal and the control animal were administered of 2-NBDG i.p. 30 min after the pilocarpine/saline. One hour following this, the animals were sacrificed. Their brains were harvested and homogenized, and epifluorescence imaging of 2-NBDG was performed using the OV100 system. ROIs were drawn within the images of the cuvettes containing the homogenized brains to quantify the difference in fluorescence signal intensity between the seizure model brain and the control animal brain. 2.5.Window Chamber Tumor ImagingThe rodent gliosarcoma cell line 9L (ATCC, Manassas, Virginia) was stably transfected with an expression vector encoding red fluorescent protein (RFP) using the SuperFect transfection reagent according to the manufacturer’s protocol (Qiagen, Valencia, California). This cell line was maintained in RPMI media supplemented with 10% FBS and 1% penicillin/streptomycin. When the cells reached 90% confluence, they were harvested by trypsinization and injected into a dorsal window chamber in a nude mouse surgically implanted by a previously published method.12 After , intravital laser scanning fluorescent microscopy was performed using a miniaturized four-laser scanning microscope as previously described.13 Excitation and emission filter settings were optimized for 2-NBDG and RFP. Prior to 2-NBDG administration, image stacks were acquired in the RFP and 2-NBDG channels to define the tumor location and measure tumor autofluorescence in the 2-NBDG channel, respectively. Following this, of 2-NBDG were injected i.p. and serial image stacks were acquired over one hour. The same photomultiplier tube gain settings, window, and level were used to collect and display the images. ROIs were drawn in the 2-NBDG channel images to quantify the change in signal intensity over the time course of the experiment. 2.6.Quantitative ColonoscopyColorectal adenomas were generated in a mouse (balb/c; Charles River Laboratories, Wilmington, Massachusetts) by the i.p. injection of the chemical carcinogen azoxymethane (AOM) twice weekly for three weeks at a dose of . The animal was then imaged using a quantitative fluorescence colonoscopy system.14, 15 A discrete adenomatous lesion was identified, and a baseline autofluorescence measurement was acquired. The animal then was administered 2-NBDG by tail vein injection, and the 2-NBDG signal intensity from the tumor was collected for . 2.7.Metastatic Lymph Node ImagingThe rodent metastatic prostate carcinoma cell line JHU-31 (ATCC, Manassas, Virginia) was maintained in RPMI 1640 growth media supplemented with dexamethasone and 10% FBS. Before the cells reached confluence, they were harvested by trypsinization and injected into the dorsum of the right hind paw of an athymic nude mouse (nu/nu; Taconic, Germantown, New York). Two weeks after implantation, of 2-NBDG was administered via tail vein. Thirty minutes following this, the animal was placed under anesthesia with 2% isoflurane; the skin covering the hind paws was retracted, and the popliteal lymph nodes were identified. The 2-NBDG signal from both lymph nodes was imaged using a commercial epifluorescence system (bonSAI; Siemens Medical Solutions, Malvern, Pennsylvania). 2.8.Intraperitoneal Tumor ImagingPeritoneal wall tumors were generated in athymic nude (nu/nu; Taconic, Germantown, New York) mice in the following manner. The animals were placed under anesthesia with 2% isoflurane, and a transverse incision was made in the abdomen at the level of the umbilicus. The fascial and muscle layers were retracted, and HT29 human colorectal cancer cells, grown as before and harvested by trypsinization, were injected directly into the peritoneal wall. Two weeks following this procedure, FDG-PET imaging was performed on the mice (Inveon PET-CT, Siemens); the animals were kept NPO for prior to imaging. Two days later, the animals received of 2-NBDG by tail vein injection, and after thirty minutes, the animals underwent intravital epifluorescence imaging with the OV100 system following surgical exposure of the tumors; the animals were kept NPO for prior to this imaging as well. The tumors were then excised and stored in 70% ethanol for subsequent histologic validation. 2.9.Statistical Analysis and InterpretationThe data in this study are presented as errors. Statistical analysis was performed using the Student’s test, and significance was assigned for . The evolution of the 2-NBDG concentration within the tumor imaged with quantitative colonoscopy imaging was determined by drawing ROIs within the tumor and measuring the mean tumor signal intensity over the course of the experiment; the same ROI was used for all images. Target-to-background ratios (TBRs) for the FDG-PET and 2-NBDG imaging were calculated by dividing the mean signal intensity within the tumors by the mean signal intensity within the erector spinae muscles. All ROIs were drawn using the ImageJ software platform. 3.Results3.1.In Vitro Evaluation of Malignant Cell Uptake of 2-NBDGOur evaluation of 2-NBDG as a practical optical reporter of glucose metabolism begins with an investigation of its characteristics on the cellular level. As we show in Figs. 1a and 1b, and as has been shown previously,6 2-NBDG uptake is concentration-dependent, with increased intracellular transport occurring with increased extracellular concentrations of the molecule. Moreover, we were able to replicate prior results demonstrating that 2-NBDG uptake can be inhibited by excess D-glucose in the growth media.7 However, we present for the first time a comparison of 2-NBDG versus FDG uptake inhibition by glucose, performed under identical experimental conditions. As Fig. 1c illustrates, the decrements in the two molecules’ uptakes are very similar for the three concentrations of excess glucose we evaluated. These results suggest that not only are 2-NBDG and FDG transported into the cell by identical mechanisms, but their retention within the cell, presumably by 6-phosphorylation, is also conserved. Fig. 1In vitro evaluation of 2-NBDG cellular uptake. (a) Fluorescence microscopy of 2-NBDG uptake in HT-29 cells after incubation in 2-NBDG for . (b) Cellular uptake of 2-NBDG by HT-29 cells is concentration dependent, with uptake increasing monotonically as the concentration of 2-NBDG in the culture media increases. (c) Correlation of FDG and 2-NBDG uptake inhibition by excess glucose. Transport of both 2-NBDG and FDG is reduced into MCF-7 cells by excess glucose in the growth media, with both molecules showing similar decrements in intracellular uptake as the extracellular glucose concentration is increased.  3.2.Macroscopic Imaging of 2-NBDG Uptake into Highly Metabolically Active TissueWe then sought to determine whether the glucose-sensitive uptake of 2-NBDG was extendible and could be visualized using a whole animal imaging modality. For this experiment, we investigated the uptake of 2-NBDG in highly glycolytic tumors implanted subcutaneously in mice using multispectral fluorescence imaging, and we measured the change in uptake between a normal fed state and a fasting, “glucose-starved” state. Figures 2a and 2b show the marked, statistically significant increase in 2-NBDG signal in the animals’ fasting states versus their fed states, implying that, similar to clinical observations in FDG-PET imaging, 2-NBDG uptake accurately reflects tissue utilization of glucose. Fig. 2Assessment of 2-NBDG as a marker of glucose metabolism in animals. (a) Multispectral fluorescence imaging of HT-29 subcutaneous tumors in nude mice following administration of of 2-NBDG in fed versus fasting states. Red arrows indicate the location of the tumor. There is a noticeable increase in 2-NBDG signal after the animal was kept NPO for . (b) Analysis of animals with subcutaneous tumors imaged, while fed and fasting shows a statistically significant increase in 2-NBDG uptake in fasting animals. (c) Statistically significant increase in 2-NBDG signal in the brain of an animal experiencing generalized seizures induced by injection of pilocarpine i.p. versus control. These data suggest that 2-NBDG localization reflects true glucose utilization rather than nonspecific extravasation.  Moreover, we illustrate in the prior experiment the ability of 2-NBDG imaging to accurately map highly metabolic areas, as seen by the sharp definition of the subcutaneous tumor against a benign background. We expanded on this observation by asking whether the molecule exhibits greater accumulation within nonmalignant tissue during episodes of increased activity through the imaging of 2-NBDG signal within the brain of an animal experiencing generalized seizures. We present these data in Fig. 2c, where we demonstrate a significant increase in 2-NBDG accumulation in the brain of the convulsing animal compared to control. The ability of 2-NBDG imaging to precisely demarcate highly metabolically active tissue was further explored by high-resolution intravital laser scanning fluorescent microscopy, performed on a 9-L gliosarcoma tumor grown within a window chamber and stably transfected to constitutively express RFP (Fig. 3 ). The 2-NBDG molecule accumulates in the tumor over time, with the probe still visible within the vasculature after . However, by one hour postinjection, the 2-NBDG signal is confined to only the tumor itself, as defined by the RFP signal in the left-most panel of Fig. 3a. These data corroborate the previously presented cellular and whole animal imaging data that support 2-NBDG as a specific marker of glucose uptake. Fig. 3Intravital laser scanning fluorescent microscopy of an RFP-labeled 9-L gliosarcoma tumor implanted in a dorsal window chamber of a nude mouse. (a) The left-most image illustrates the location of the tumor based on its constitutive expression of RFP. The second left-most image shows the tumor autofluorescence in the 2-NBDG channel, and the subsequent images in the panel show accumulation of 2-NBDG in the tumor over time. By postinjection, the 2-NBDG signal correlates very well with the RFP signal. (b) A plot of the 2-NBDG signal intensity in the tumor over time shows that the molecule accumulates and reaches a steady plateau after approximately .  3.3.Clinically Relevant Imaging Applications of 2-NBDGHaving validated 2-NBDG imaging’s utility for the visualization of highly metabolic processes from the micro- to the macroscale, we then evaluated several different clinically relevant applications for this imaging probe. We first applied this molecule to the minimally invasive metabolic imaging of colorectal cancer (Fig. 4 ). Using an inhouse-designed quantitative fluorescence colonoscopy system,14, 15 we imaged 2-NBDG uptake over time in a chemical carcinogen-induced murine model of colorectal cancer. As Fig. 4b illustrates, the 2-NBDG concentration in the tumor initially increased to a sharp peak, a characteristic we interpret as representing the fluorescent probe in the blood pool phase, and then settled to a level that was constant after one hour, a finding that we believe represents true accumulation and retention of the probe within the tumor itself. Fig. 4Minimally invasive and intraoperative applications of 2-NBDG imaging. (a) and (b) depict data from a quantitative fluorescence colonoscopy performed on a mouse with chemical carcinogen-induced orthotopic colorectal adenomas. (a) White light (WL) image of an adenoma that was imaged using the quantitative catheter-based imaging system for one hour continuously, following the administration of of 2-NBDG. (b) Plot of 2-NBDG signal over time in a single adenoma shows an initial peak followed by a steady plateau. The peak likely represents 2-NBDG initially within the tumor vasculature, and the subsequent plateau reflects true accumulation and trapping of 2-NBDG within the tumor cells. (c) Epifluorescence imaging of popliteal lymph nodes in a mouse injected with JHU-31 metastatic prostate cancer cells in its right hind paw, after the administration of of 2-NBDG. Red arrows indicate the location of the lymph nodes. The lymph node ipsilateral to the tumor is noticeably larger in the WL image than the contralateral node; fluorescence imaging shows increased 2-NBDG uptake within the lymph node, a finding suggestive of metastatic spread.  Next, we investigated the intraoperative applicability of 2-NBDG imaging through two animal models. In the first, we implanted the rodent metastatic prostate cancer cell line JHU-31 in the right hind paw of a nude mouse and assessed for metastatic spread to nearby lymph nodes [Fig. 4c]. We were able to readily discriminate between 2-NBDG uptake in a popliteal lymph node ipsilateral to the implanted tumor versus uptake in the contralateral node. In the second (Fig. 5 ), we surgically generated a model of a peritoneal wall tumor and demonstrated first with FDG-PET/CT imaging the location and highly metabolic nature of these lesions. We then surgically exposed the tumors and performed intravital epifluorescence imaging. This imaging revealed the effectiveness of 2-NBDG to serve as a molecular beacon of pathologically elevated metabolic activity, highlighting the tumors against the benign abdominal viscera background. The TBRs for the FDG-PET and 2-NBDG imaging [Fig. 5b] were statistically similar (FDG-PET TBR 4.1 [CI: 1.1–7.0]; 2-NBDG TBR 3.4 [CI: 2.8–4.0]), and the malignant nature of the lesions was confirmed by histology [Fig. 5d]. Fig. 5Correlation of FDG-PET imaging with intraoperative 2-NBDG imaging. HT29 cells were surgically implanted into the peritoneal wall of nude mice. The mice subsequently underwent imaging with FDG-PET/CT, and then two days later, underwent surface reflectance imaging following the administration of of 2-NBDG and surgical exposure of their abdomen. (a) FDG-PET/CT reveals two large intraperitoneal masses, shown with red arrows, that are highly FDG-avid in this representative mouse. (b) The same two lesions were well visualized with 2-NBDG imaging. Red arrows demonstrate the location of the tumors, and the blue box in the left-most image shows the approximate area of focus for the center and right-most images. (c) TBRs for FDG-PET and 2-NBDG imaging were statistically similar. (d) The malignant nature of the lesions was confirmed by histology. 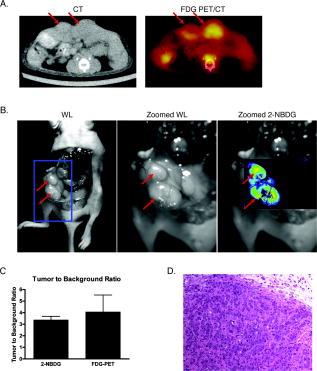 4.DiscussionOptical molecular imaging is a newer technology that has many unique advantages over other imaging approaches, such as real-time image acquisition, low relative cost, high spatial resolution, and lack of ionizing radiation. Through the development of highly sensitive optical molecular probes, this modality has been applied to the evaluation of a wide number of pathologies, ranging from colorectal and ovarian cancer15, 16 to atherosclerosis. 17 Moreover, with the advent of new methods to quantify fluorescence in intraoperative and minimally invasive settings,14, 15 the promise of optical imaging to accurately characterize the underlying molecular mechanisms of disease in clinically relevant contexts is fast approaching reality. Recently, the prospect of an optical glucose molecular probe has been explored. An optical analog to FDG would provide for the exciting coupling of the benefits of working in the optical regime with the already well-established clinical impact of FDG-PET imaging. A fusion of the two modalities would further expand the significance of metabolic imaging in the detection, staging, and treatment of many disease states. The desire for fluorescent monosaccharides led initially to the synthesis of cyanine-5.5-labeled (Cy5.5; Amersham, United Kingdom) versions of glucose2 and fructose.18 However, poor biological activity was obtained with both Cy5.5-labeled compounds. These molecular probes were found to localize to malignant tissues, but through mechanisms independent of traditional GLUT-mediated cellular uptake. This mixed result is likely due to the fact that the near-infrared fluorochromes used in these studies are large molecular compounds with electric charges; conjugation of glucose to these fluorochromes creates a molecular probe with physiologic characteristics that are very different from free glucose. Although NBD is less ideal optically, given that it fluoresces in the highly tissue-attenuating green spectrum, its small size and relatively low molecular weight are a significant advantage over the larger, bulkier near-infrared fluorochromes. As such, NBD-labeled glucose appears to interact with cells in a manner identical to unlabeled glucose. 2-NBDG has been used to image glucose transport in pancreatic beta cells,4, 5 rat skeletal muscle,6 MCF-7 and HepG2 tumor cells,7 monocytes,19 cardiomyocytes,20 and E. coli.21 We therefore hypothesized that it might be possible to find clinical applications of 2-NBDG where the distances for light transmission through tissue were short, and if imaging processing was employed to enhance the resolution of NBD and tissue fluorescence. In this study, we advance the utility of 2-NBDG by applying it to whole animal, minimally invasive, and intraoperative imaging. We investigate the properties of 2-NBDG using a number of different cell lines and animal models of disease to systematically validate it as a molecular beacon for metabolic activity and as a practical imaging tool for clinical use. First, we reproduced prior work demonstrating the inhibition of 2-NBDG cellular uptake by excess culture media, a finding that suggests that 2-NBDG’s fluorochrome does not alter the intracellular transport mechanisms for the attached deoxyglucose molecule. This result is significant in that it illustrates a unique advantage to using 2-NBDG over other fluorescently labeled deoxyglucose probes: the small size of the NBD fluorochrome does not interfere with the normal molecular interactions of glucose, a limitation that affects other proposed fluorescent glucose analogs that rely on more bulky fluorochromes.2 Moreover, we show that the uptake inhibition of 2-NBDG by excess glucose in the growth media occurs in a glucose concentration-dependent manner that is virtually identical to the inhibition shown by FDG uptake. These data indicate that not only does 2-NBDG well replicate the behavior of glucose, but it does so in a fashion comparable to FDG, a result that has important implications for the possibility of combining FDG-PET and 2-NBDG imaging in the clinical setting. Our whole animal imaging experiment illustrated an increased uptake of 2-NBDG within subcutaneous tumors when the animals were glucose-starved, signifying that the localization of 2-NBDG to the tumor does not represent nonspecific accumulation, but rather an actual increased glucose avidity ratio in the malignant tissue relative to normal tissue. 2-NBDG fluorescence does not reflect leakage into the interstitium through poorly endothelialized, ectatic vessels within the tumor, but actually through elevated transport of glucose into the tumor cells, due to their highly glycolysis-dependent energy generation compared to the surrounding benign parenchyma. The evidence supporting the ability of 2-NBDG to highlight increased metabolic activity was furthered by the demonstration of elevated 2-NBDG signal within the brain of an animal experiencing seizures versus control. The accuracy of 2-NBDG imaging to delineate areas of high glucose consumption was confirmed by observing a high correlation between 2-NBDG and RFP signal in the intravital laser scanning fluorescent microscopy imaging of an RFP-labeled tumor. After evaluating 2-NBDG’s validity as an optical glucose analog from the cellular to the whole animal scale, we then applied this probe to the minimally invasive imaging of colorectal cancer. We utilized a new quantitative fiber optic catheter-based imaging system14, 15 that resolves the distance dependence of fluorescence signal intensity to intravitally measure 2-NBDG signal within an adenomatous polyp in a mouse. These fluorescent colonoscopy data show that minimally invasive applications of 2-NBDG imaging can be readily translated into clinical practice, as adjuncts to current clinical methods. Moreover, given the quantitative nature of this imaging, one can envision using this technology not only to improve upon tumor detection, but also to monitor changes in tumor metabolic activity following medical therapy. We also illustrate a second potential application of 2-NBDG imaging, that is, the intraoperative visualization of pathologic tissue for surgical guidance. We demonstrate how this methodology can be used to supplement preoperative FDG-PET imaging by focally indicating the location of hypermetabolic lesions intraoperatively that correlate with prior FDG-PET imaging. This technology would resolve an unmet clinical need, namely, the translation of FDG imaging into the operative setting. One answer to this need currently under investigation is intraoperative handheld gamma counters to detect FDG accumulation. However, these devices suffer from limited fields of view as well as a strong distance dependence, with the sensitivity for FDG detection dropping off as the distance between the device and the target lesion increases.8 Imaging with 2-NBDG, however, does not share these limitations, as it can be performed with broad fields of view as well as in a quantitative manner, as evidenced by the colonoscopy data described before. Additionally, the patient does not need to be reinjected with FDG, limiting requirements for radioactivity in the operating room. We present in this study a systematic evaluation of an optical glucose imaging probe, 2-NBDG, for use as a supplement to FDG-PET imaging. We validate the probe as a viable marker for glucose consumption using fluorescence microscopy, and as an accurate delineator of pathologic tissue using multispectral fluorescence imaging, intravital laser scanning fluorescent microscopy, and surface reflectance fluorescent imaging. We then offer two clinically relevant applications for 2-NBDG imaging, namely minimally invasive and intraoperative imaging. We demonstrate the latter by performing a quantitative fluorescence colonoscopy on an orthotopic colorectal cancer mouse model. Finally, we illustrate the former by correlating intraoperative 2-NBDG imaging with preoperative FDG-PET imaging, thus depicting how an optical glucose analog could serve as a bridge for bringing metabolic imaging data into the operating room. AcknowledgmentsThe authors wish to express their appreciation to Brett Marinelli for his assistance with the PET/CT imaging, and to Shena Hembrador for her assistance with the FDG cell uptake experiments. This research was supported in part by the Susan G. Komen for the Cure Foundation, as well as NIH grants P50CA127003 and R01-EB001872. ReferencesS. S. Gambhir, J. Czernin, J. Schwimmer, D. H. Silverman, R. E. Coleman, and M. E. Phelps,
“A tabulated summary of the FDG PET literature,”
J. Nucl. Med., 42 1S
–93S
(2001). 0161-5505 Google Scholar
Z. Cheng, J. Levi, Z. Xiong, O. Gheysens, S. Keren, X. Chen, and S. S. Gambhir,
“Near-infrared fluorescent deoxyglucose analogue for tumor optical imaging in cell culture and living mice,”
Bioconjugate Chem., 17
(3), 662
–669
(2006). https://doi.org/10.1021/bc050345c 1043-1802 Google Scholar
Y. Itoh, T. Abe, R. Takaoka, and N. Tanahashi,
“Fluorometric determination of glucose utilization in neurons in vitro and in vivo,”
J. Cereb. Blood Flow Metab., 24
(9), 993
–1003
(2004). https://doi.org/10.1097/01.WCB.0000127661.07591.DE 0271-678X Google Scholar
K. Yamada, M. Nakata, N. Horimoto, M. Saito, H. Matsuoka, and N. Inagaki,
“Measurement of glucose uptake and intracellular calcium concentration in single, living pancreatic beta-cells,”
J. Biol. Chem., 275
(29), 22278
–22283
(2000). https://doi.org/10.1074/jbc.M908048199 0021-9258 Google Scholar
K. Yamada, M. Saito, H. Matsuoka, and N. Inagaki,
“A real-time method of imaging glucose uptake in single, living mammalian cells,”
Nat. Protoc., 2
(3), 753
–762
(2007). https://doi.org/10.1038/nprot.2007.76 1750-2799 Google Scholar
C. Zou, Y. Wang, and Z. Shen,
“2-NBDG as a fluorescent indicator for direct glucose uptake measurement,”
J. Biochem. Biophys. Methods, 64
(3), 207
–215
(2005). https://doi.org/10.1016/j.jbbm.2005.08.001 0165-022X Google Scholar
R. G. O’Neil, L. Wu, and N. Mullani,
“Uptake of a fluorescent deoxyglucose analog (2-NBDG) in tumor cells,”
Mol. Imaging Biol., 7
(6), 388
–392
(2005). https://doi.org/10.1007/s11307-005-0011-6 1536-1632 Google Scholar
R. Essner, E. C. Hsueh, P. I. Haigh, E. C. Glass, Y. Huynh, and F. Daghighian,
“Application of an [(18)F]fluorodeoxyglucose-sensitive probe for the intraoperative detection of malignancy,”
J. Surg. Res., 96
(1), 120
–126
(2001). https://doi.org/10.1006/jsre.2000.6069 0022-4804 Google Scholar
A. E. Carpenter,
“CellProfiler: image analysis software for identifying and quantifying cell phenotypes,”
Genome Biol., 7 R100
(2006). https://doi.org/10.1186/gb-2006-7-10-r100 1465-6906 Google Scholar
M. M. Mirrione, W. K. Schiffer, M. Siddiq, S. L. Dewey, and S. E. Tsirka,
“PET imaging of glucose metabolism in a mouse model of temporal lobe epilepsy,”
Synapse, 59
(2), 119
–121
(2006). https://doi.org/10.1002/syn.20216 0887-4476 Google Scholar
W. A. Turski, E. A. Cavalheiro, M. Schwarz, S. J. Czuczwar, Z. Kleinrok, and L. Turski,
“Limbic seizures produced by pilocarpine in rats: behavioural, electroencephalographic and neuropathological study,”
Behav. Brain Res., 9
(3), 315
–335
(1983). https://doi.org/10.1016/0166-4328(83)90136-5 0166-4328 Google Scholar
Q. Huang, S. Shan, R. D. Braun, J. Lanzen, G. Anyrhambatla, G. Kong, M. Borelli, P. Corry, M. W. Dewhirst, and C. Y. Li,
“Noninvasive visualization of tumors in rodent dorsal skin window chambers,”
Nat. Biotechnol., 17
(10), 1033
–1035
(1999). https://doi.org/10.1038/13736 1087-0156 Google Scholar
H. Alencar, U. Mahmood, Y. Kawano, T. Hirata, and R. Weissleder,
“Novel multiwavelength microscopic scanner for mouse imaging,”
Neoplasia, 7
(11), 977
–983
(2005). https://doi.org/10.1593/neo.05376 1522-8002 Google Scholar
R. A. Sheth, R. Upadhyay, R. Weissleder, and U. Mahmood,
“Real-time multichannel imaging framework for endoscopy, catheters, and fixed geometry intraoperative systems,”
Mol. Imaging, 6
(3), 147
–155
(2007). 1535-3508 Google Scholar
R. Upadhyay, R. A. Sheth, R. Weissleder, and U. Mahmood,
“Quantitative real-time catheter-based fluorescence molecular imaging in mice,”
Radiology, 245
(2), 523
–531
(2007). https://doi.org/10.1148/radiol.2452061613 0033-8419 Google Scholar
M. A. Funovics, R. Weissleder, and U. Mahmood,
“Catheter-based in vivo imaging of enzyme activity and gene expression: feasibility study in mice,”
Radiology, 231
(3), 659
–666
(2004). https://doi.org/10.1148/radiol.2313030831 0033-8419 Google Scholar
J. Chen, C. H. Tung, U. Mahmood, V. Ntziachristos, R. Gyurko, M. C. Fishman, P. L. Huang, and R. Weissleder,
“In vivo imaging of proteolytic activity in atherosclerosis,”
Circulation, 105
(23), 2766
–2771
(2002). https://doi.org/10.1161/01.CIR.0000017860.20619.23 0009-7322 Google Scholar
J. Levi, Z. Cheng, O. Gheysens, M. Patel, C. T. Chan, Y. Wang, M. Namavari, and S. S. Gambhir,
“Fluorescent fructose derivatives for imaging breast cancer cells,”
Bioconjugate Chem., 18
(3), 628
–634
(2007). https://doi.org/10.1021/bc060184s 1043-1802 Google Scholar
G. Dimitriadis, E. Maratou, E. Boutati, K. Psarra, C. Papasteriades, and S. A. Raptis,
“Evaluation of glucose transport and its regulation by insulin in human monocytes using flow cytometry,”
Cytometry, Part A, 64
(1), 27
–33
(2005). https://doi.org/10.1002/cyto.a.20108 1552-4922 Google Scholar
S. W. Ball, J. R. Bailey, J. M. Stewart, C. M. Vogels, and S. A. Westcott,
“A fluorescent compound for glucose uptake measurements in isolated rat cardiomyocytes,”
Can. J. Physiol. Pharmacol., 80
(3), 205
–209
(2002). https://doi.org/10.1139/y02-043 0008-4212 Google Scholar
K. Yoshioka, M. Saito, K. B. Oh, Y. Nemoto, H. Matsuoka, M. Natsume, and H. Abe,
“Intracellular fate of 2-NBDG, a fluorescent probe for glucose uptake activity, in Escherichia coli cells,”
Biosci., Biotechnol., Biochem., 60
(11), 1899
–1901
(1996). https://doi.org/10.1271/bbb.60.1899 0916-8451 Google Scholar
|


