
|
|
1.IntroductionResting-state functional connectivity (RSFC) has been widely carried out in human brain studies using functional magnetic resonance imaging (fMRI). The fMRI-based RSFC can be defined as the spatiotemporal synchrony or correlation of hemodynamic activities between the distinct brain regions of cerebral cortex.1 Several research groups have reported that there exists spontaneous low-frequency fluctuation (sLFF <0.08 Hz) in the human brain at the resting state, and this sLFF can be used to measure or identify the functional connectivity among different brain regions.2, 3, 4, 5, 6 Specifically, the sLFF is believed to be a reflection of spontaneous neuronal activity in these brain regions.2, 4, 7 Some researchers even consider that the brain activity at the resting state may be at least as important as the activity evoked by tasks.8 Because no task is needed during the measurement, the study protocol becomes much simpler and easier as compared to the conventional fMRI. Thus, the ability to determine RSFC in the human brain is very appealing because it may lead to a useful research and clinical tool for investigating neurological or psychiatric diseases, such as schizophrenia and the Alzheimer.9, 10, 11, 12, 13, 14 Recently, researchers using functional near-infrared (NIR) spectroscopy (fNIRS) have also exhibited their interests in fNIRS-based, RSFC measurements. It is well known that fNIRS can detect hemodynamic changes on the cerebral cortex induced by neural activations. NIR light (600–900 nm) emitted from light sources can penetrate through the scalp and skull and then reach cerebral cortex tissue.15 The reflected photons from the cortex can be detected and quantified by the detectors placed on the surface of scalp, a few centimeters away from the sources. In tissue, NIR light is mainly absorbed by oxygenated hemoglobin (HbO2) and deoxygenated (HbR) hemoglobin. These two chromophores have distinct absorption spectra in the NIR range; thus, the change of HbO2 and HbR concentration in the cerebral cortex derived from neuronal activation can be quantified using two or more wavelengths.15, 16, 17, 18 Compared to fMRI, fNIRS can provide different hemodynamic contrasts: HbO2, HbR, and HbT. HbT is defined as the sum of HbO2 and HbR. The comprehensive contrast information can provide more detailed information on physiological or neurologican rhythms, thus giving better understanding on the nature of hemodynamic responses to neuronal activations. Being compact, easy to implement, and able to have a high temporal resolution, fNIRS has a good potential to become a research and clinical tool for human brain investigations, especially for cases involving infants, children, and patients who are unsuitable to perform fMRI studies or with severe movement disorder.18, 19 Recently, two research groups have evaluated fNIRS-based, RSFC in the human brain: one used a high-density, diffuse optical tomographic (DOT) system,20 and the other utilized a diffuse optical topography system, respectively.21, 22, 23 These experimental results together reported that fNIRS can detect the interhemisphere temporal correlation on the bilateral motor cortex, visual cortex, and auditory cortex, demonstrating the validity of fNIRS on assessing RSFC. However, to develop a new technology or methodology, it is necessary to establish its liability and repeatability by further performing similar experiments to rigorously support the initial findings. Therefore, in this study, we repeated a previous protocol22 to investigate fNIRS-based RSFC on the bilateral motor cortexes using two separate DOT systems combined with distinct probe arrays. We expected to achieve a consistent conclusion drawn from our two DOT systems and from the published studies.22 Specifically, this paper includes the following sections: a well-established finger movement paradigm is introduced to determine the seed regions on the bilateral sensorimotor cortexes; then an fNIRS-based RSFC map is generated by computing the Pearson's correlation coefficients between the seed time series and time courses of other pixels in the imaging fields; finally, the group-level t-map is achieved by using a random-effect model. This work is expected to strongly demonstrate the validity and reproducibility of fNIRS-based RSFC assessment. 2.Methods2.1.ProtocolHealthy adult subjects (ages 18–35 years) were recruited in this study. Data from nine and eight subjects were respectively recorded using two different continuous-wave (cw), near-infrared DOT systems: one was DYNOT (NIRx Medical Technologies, LLC, NY, USA), and the other was CW5 (TechEn, Milford, MA, USA). Two subjects were measured with both DYNOT and CW5 in two different days, and the other subjects were recorded by either DYNOT or CW5. Written informed consents were obtained from all the subjects, and the study protocol was approved by the University of Texas at Arlington Institutional Review Board. The protocol utilized in this study consisted of two sessions. The first one was a 10-min resting state, followed by a 6-min, left and right finger-movement task, which was used to localize the bilateral motor regions on the cortex. After session 1, the subject was asked to have a short break and then to begin session 2, which consisted of seven task blocks and eight rest blocks. The length of each block was randomized between 20 and 28 s, but the lengths of each task block plus the following rest block were equal. During the whole experiment, the subjects were asked to sit comfortably and remain motionless as much as possible. Each subject was required to practice the finger-movement task for several minutes before the experiment so that the subject could understand the experimental instructions and correctly performed the given task. 2.2.NIRS Data CollectionThe actual images of DYNOT and CW5 imaging systems are shown in Figs. 1a and 1b, respectively. These two systems can perform multiwavelength, continuous wave, DOT measurements. The wavelengths used to calculate hemoglobin concentration changes were 760 and 830 nm for DYNOT, 690 and 830 nm for CW5. In the former system, the sensor array consisted of 32 bifurcated source-detector probes with a nearest interoptode distance of 1.9 cm, forming a total measurement area of 25×7 cm2 on the scalp [Fig. 1c]. In order to obtain a sufficient signal-to-noise ratio (SNR), we chose only 65 measurement channels with the first two nearest–source-detector pairs. Note that one source-detector pair was considered one channel. In the case of CW5, the probe array consisted of 10 laser fibers and 16 receivers with a nearest–source-detector distance of 3 cm [Fig. 1d], covering a measurement area of 24×6 cm2 on the scalp with a total of 32 measurements. Fig. 1Two diffuse optical tomography imaging systems: (a) shows DYNOT and (b) shows CW5. (c,d) Illustrate the schematic arrangements of sources and detectors for DYNOT and CW5, respectively, where (c) included 32 bifurcated optodes (32 sources and 32 detectors) and (d) included 10 sources (solid circles in central row) and 16 detectors (squares in top and bottom rows).  In order to place the probe array on the bilateral sensorimotor cortex accurately so as to allow for group analysis across subjects, the array was positioned according to the international 10–20 system used in electroencephalography.24 Thus, the black circle point [see Figs. 1c and 1d] in the center of each probe array, was placed on the vertex (Cz) of the subject's head. In order to reduce light absorption by hair and obtain enough optical signals, we manually moved away the hair under the probes using a comb during probe placement. 2.3.Functional Near-Infrared Spectroscopy Data ProcessingfNIRS data were processed and analyzed using channelwise assessment; the channels with significant motion artifacts and loose contacts between probes and scalp were excluded before data processing. After that, bandpass filtering was applied to remove high-frequency instrument noise and low-frequency baseline drift. For the finger-movement task, bandpass frequencies were between 0.01 and 0.2 Hz; for the resting-state session, the bandpass frequencies were between 0.009 and 0.08 Hz to guarantee the filtered signals to be in the range of sLFF. For finger-movement data, block averaging was performed on all channels in order to maximize the SNR. 2.4.Resting-State Functional Connectivity Analysis2.4.1.Selection of seed regions based on the finger-movement taskThe activated regions induced by the finger-movement task were considered as seed regions on the bilateral motor cortex. To obtain an activation image, we generated the light-sensitivity matrix based on the probe arrangement and a semi-infinite diffusion model for image reconstruction.17, 25 Solving the inverse matrix allowed us to quantify the task-induced absorption changes in spatial distribution at each wavelength. Then, the concentration changes of HbO2 and HbR were obtained using modified Beer–Lambert's law26, 27 (i.e., the proportional relation between the chromophore concentrations and absorption coefficients of the tissue). Changes in HbT were further obtained by summing changes of HbO2 and HbR. Thus, three activation maps of HbO2, HbR, and HbT were acquired with each DOT imager from each subject. To determine which regions were significantly activated by the finger-movement task at the group level (p < 0.05), we utilized the one-sample t-test to analyze the pixelwise changes of HbO2, HbR, and HbT. This could produce group-level activation t-maps of three respective hemoglobin concentrations. Because HbO2 signals often had the best SNRs as compared to HbR and HbT, only HbO2 task-induced activation t-map was utilized in this work and is shown in Fig. 2. Within Fig. 2, we selected and labeled two activation regions bilaterally (with an average size of ∼1.5×3 cm2), one on the left and one on the right, as seed regions that were to be referenced during correlation analysis as so to determine RSFC in the bilateral sensorimotor areas. Fig. 2Group-level activation t-maps induced by the finger-movement task on the sensorimotor cortex: (a) obtained from DYNOT and (b) obtained from CW5. Bright color means the regions being significantly activated. Two inserted rectangles marked by solid lines are chosen as seed regions that are used as reference during correlation analysis to determine RSFC.  2.4.2.Correlation analysis in resting stateFor the resting-state time series, the correlation analysis was performed separately based on the left and right seed regions. After averaging across all the pixels within each seed region (∼1.5×3 cm2), we obtained the corresponding time course from the seed region. Then, Pearson's correlation coefficients were calculated between the time courses from the seed region and from each of the other pixels outside the seed region but within the field of view of the probe array. This yielded a spatial correlation map in which each value of the pixels represented the temporal correlation strength between the seed region and each of the other pixels. Then, each correlation value was transformed to z-value using the Fisher's z transformation28 (i.e., z = 0.5 × log [(1 + r)/(1 – r)]) to achieve the normal distribution. For group-level analysis based on each of the two seed regions, a one-sample t-test was produced using pixelwise z-values to statistically infer the regions showing significant functional connectivity. In this way, we produced two RSFC (i.e., resting-state functional connectivity) maps, one from the left seed region and another from the right, having a p threshold of 0.01 with a false discovery rate (FDR) correction.29 In this part of the study, we investigated all three hemodynamic contrasts for RSFC. In order to visualize temporal synchronization between the left and right seed regions during the activation-free resting state, we extracted several resting-state time courses from bilateral seed regions of a subject. In addition, a time course from the central region [as marked by the dashed rectangle in the center of Figs. 2a and 2b] was also selected for comparison. 3.ResultsFigure 3a presents resting-state low-frequency fluctuation (LFF) from the three chosen regions (left seed region, right mirror region, and the center region) taken from DYNOT; Fig. 3b shows similar patterns from corresponding regions measured by CW5. The data were taken from a nonspecific subject to show an example. Both Figs. 3a and 3b reveal that the LFF signals from both seed regions have much stronger synchronized fluctuations and more comparable maximum peaks, as compared to the signals from the central regions. Fig. 3Three time courses of resting-state HbO2 signal changes taken from the left seed, right mirror, and central regions. (a) obtained from DYNOT and (b) from CW5. 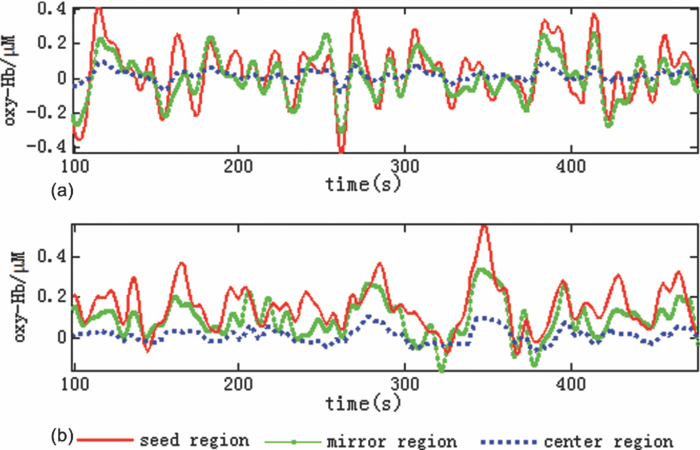 The group-level RSFC assessments that were obtained from DYNOT and CW5 are displayed in Figs. 4 and 5, respectively, after individually utilizing either the left or right seed region as the correlation reference. In Figs. 4 and 5, each row corresponds in sequence to the RSFC maps of HbO2, HbR, and HbT. The color bar represents the statistical t-value; the bright yellow color means significant functional connectivity between the seed region and other pixels in the imaging field (p < 0.01, FDR corrected). Figures 4 and 5 clearly show that each seed region has significant correlation with the surrounding area and with the contralateral mirror regions, but has no or low significant correlation with the central pixels. This observation holds regardless of which side of seed (i.e., left seed or right seed) region was chosen as the correlation reference to determine the RSFC maps. Furthermore, strong connectivity strength between the left and right sensorimotor cortexes remains similar across all three hemodynamic contrasts (p = 0.01) (i.e., HbO2, HbR, and HbT). These consistent conclusions are also found across the results drawn from DYNOT and CW5, unambiguously demonstrating that the fNIRS-based RSFC is repeatable by various DOT imaging systems and that fNIRS is a feasible and liable technique on assessing RSFC. Fig. 4Group-level RSFC t-maps (p < 0.01, FDR corrected) obtained from DYNOT system. The t-maps of three hemodynamic contrasts (HbO2, HbR, and HbT) are separately represented. The seed-region is individually represented by the rectangle when either the left or right seed-region is used as the correlation reference.  Fig. 5Group-level RSFC t-maps (p < 0.01, FDR corrected) obtained from CW5 system. The t-maps of three hemodynamic contrasts (HbO2, HbR, and HbT) are separately represented. The seed region is individually represented by the rectangle when either the left or right seed region is used as the correlation reference.  We also analyze RSFC maps obtained from both DYNOT and CW5 at the individual-level. The data were collected from a subject who participated in the measurements by both DYNOT and CW5. The results shown in Fig. 6 illustrate interhemisphere correlation between the bilateral motor cortexes from each of the DOT systems. It is also seen that the DYNOT-based RSFC is less homogenous and less consistent across the bilateral motor regions as compared to CW5-based results. We attributed these imperfect features to the loose contacts between the probes and scalp because of the rigidness and heaviness of probes inherent in the DYNOT system. Fig. 6Correlation maps of one subject assessed by bilateral seed regions: (a) obtained from DYNOT system and (b) obtained from CW5 system. The correlation maps of the three hemodynamic contrasts (HbO2, HbR, and HbT) are separately represented. The seed regions are shown in black boxes.  Furthermore, dependence of RSFC evaluation on the time length of resting-state course is also investigated and illustrated in Fig. 7, where Figs. 7a and 7b are the RSFC maps obtained from a short (150-s) and long (500-s) time course using the two separate seed regions, respectively, taken from a random subject using DYNOT. The results obviously reveal that the patterns and strengths of functional connectivity are consistent on the bilateral motor cortex across different time lengths, whereas a longer temporal course may lead to an improved spatial resolution in RSFC. Figure 7 may suggest that the length of the time course should be a little longer (∼7–8 min) if the spatial resolution is a concern; on the other hand, the time course can be shortened (∼2–3 min) if one wishes to see the overall pattern of RSFC. 4.Discussions and ConclusionsIn this study, fNIRS-based RSFC on the sensorimotor cortex has been investigated and assessed using seed-based correlation analysis by two commonly and independently used DOT systems. The seed was firstly localized by a finger-movement task, and then the functional connectivity maps were generated using the seed-based correlation analysis. The experiment proves a high temporal synchronization and a strong functional connectivity between the bilateral motor cortexes during the nonstimulation or resting state. In the experiments, although DYNOT and CW5 were two independent imaging systems and utilized different number of fiber probes with distinct probe arrangements to collect data, the analyzed results and RSFC maps were still quite similar and consistent between the both systems. Furthermore, these new observations are also in excellent agreement with the previous fNIRS-based report,20, 21 effectively confirming that the fNIRS-based RSFC is reproducible on various DOT imaging systems, regardless of the reconstruction algorithms used, the connectivity assessment method employed, and measurement geometry as well as fiber-probe arrangement employed. It is also noteworthy that the group- or individual-level RSFC maps could be derived from all three hemodynamic contrasts (i.e., HbO2, HbR, and HbT), using either the left or right seed-region as the correlation reference for bilateral motor areas. This is because the patterns and strengths of RSFC of these three contrasts are basically similar, regardless of the side of seed regions. However, we believe that the RSFC maps of HbO2 and HbT present larger similarity in their connectivity pattern and spatial extension as compared to the HbR-based RSFC maps. Indeed, the latter ones shown in Figs. 4 and 5 appear to have a more heterogeneous connectivity pattern and less symmetric characteristic across bilateral motor cortex. This qualitative observation seems to agree with the recent report by Lu 21 but not completely consistent with the results given by White 20 Because our experimental protocols were very similar to those used by Lu,21 it is expected that our study should arrive at the same conclusion as theirs. We may not have to be of coincidence with the observations shown by Ref. 20 due to the different experimental protocols. Presumably, further experimental designs with a larger subject pool are needed in order to determine which hemodynamic contrast should be optimally utilized for better assessment of fNIRS-based RSFC. In conclusion, we have utilized two independent DOT systems (i.e., DYNOT and CW5) to evaluate fNIRS-based RSFC in the sensorimotor cortex by performing seed-based correlation analysis. Our results revealed consistent patterns of temporal synchronization and correlation strengths in RSFC between the bilateral motor cortexes. We have observed consistent results from both DYNOT and CW5 imaging systems; especially, our conclusions are also in good agreement with a previous reported study.21 Overall, this paper demonstrates that the fNIRS-based RSFC is reproducible by various DOT imaging systems among different research groups, enhancing the confidence of neuroscience researchers and clinicians to utilize fNIRS for future applications. AcknowledgmentsThis work was supported in part by an NIH funding from NINDS (Grant No. 4R33NS052850–03). ReferencesK. J. Friston, C. D. Frith, P. F. Liddle, and
R. S. Frackowiak,
“Functional connectivity: the principal-component analysis of large (PET) data sets,”
J. Cereb. Blood Flow Metab., 13 5
–14
(1993). Google Scholar
B. Biswal, F. Z. Yetkin, V. M. Haughton, and
J. S. Hyde,
“Functional connectivity in the motor cortex of resting human brain using echo-planar MRI,”
Magn. Reson. Med., 34 537
–541
(1995). https://doi.org/10.1002/mrm.1910340409 Google Scholar
M. D. Greicius, B. Krasnow, A. L. Reiss, and
V. Menon,
“Functional connectivity in the resting brain: a network analysis of the default mode hypothesis,”
Proc. Natl. Acad. Sci. USA, 100 253
–258
(2003). https://doi.org/10.1073/pnas.0135058100 Google Scholar
M. J. Lowe, B. J. Mock, and
J. A. Sorenson,
“Functional connectivity in single and multislice echoplanar imaging using resting state fluctuations,”
Neuroimage, 7 119
–132
(1998). https://doi.org/10.1006/nimg.1997.0315 Google Scholar
J. Xiong, L. M. Parsons, J. Gao, and
P. T. Fox,
“Interregional connectivity to primary motor cortex revealed using MRI resting state images,”
Hum. Brain Mapp., 8 151
–156
(1999). https://doi.org/10.1002/(SICI)1097-0193(1999)8:2/3<151::AID-HBM13>3.0.CO;2-5 Google Scholar
M. L. Schroeter, O. Schmiedel, and
D. Y. von Cramon,
“Spontaneous low-frequency oscillations decline in the aging brain,”
J. Cereb. Blood Flow 348 Metab., 24 1183
–1191
(2004). https://doi.org/10.1097/01.WCB.0000135231.90164.40 Google Scholar
R. Salvador, J. Suckling, M. R. Coleman, J. D. Pickard, D. Menon, and
E. Bullmore,
“Neurophysiological architecture of functional magnetic resonance images of human brain,”
Cereb Cortex, 15 1332
–1342
(2005). https://doi.org/10.1093/cercor/bhi016 Google Scholar
M. E. Raichle and
M. A. Mintun,
“Brain work and brain imaging,”
Annu. Rev. Neurosci., 29 449
–476
(2006). https://doi.org/10.1146/annurev.neuro.29.051605.112819 Google Scholar
M. Liang, Y. Zhou, T. Jiang, Z. Liu, L. Tian, H. Liu, and
Y. Hao,
“Widespread functional disconnectivity in schizophrenia with resting state functional magnetic resonance imaging,”
Neuroreport, 17 209
–213
(2006). https://doi.org/10.1097/01.wnr.0000198434.06518.b8 Google Scholar
Y. Zhou, M. Liang, L. Tian, K. Wang, Y. Hao, H. Liu, Z. Liu, and
T. Jiang,
“Functional disintegration in paranoid schizophrenia using resting-state fMRI,”
Schizophr. Res., 97 194
–205
(2007). https://doi.org/10.1016/j.schres.2007.05.029 Google Scholar
M. D. Greicius, G. Srivastava, A. L. Reiss, and
V. Menon,
“Default-mode network activity distinguishes Alzheimer's disease from healthy aging: evidence from functional MRI,”
Proc. Natl. Acad. Sci. USA, 101 4637
–4642
(2004). https://doi.org/10.1073/pnas.0308627101 Google Scholar
L. Wang, Y. Zang, Y. He, M. Liang, X. Zhang, L. Tian, T. Wu, T. Jiang, and
K. Li,
“Changes in hippocampal connectivity in the early stages of Alzheimer's disease: evidence from resting state fMRI,”
Neuroimage, 31 496
–504
(2006). https://doi.org/10.1016/j.neuroimage.2005.12.033 Google Scholar
L. Wang, C. Yu, H. Chen, W. Qin, Y. He, F. Fan, Y. Zhang, M. Wang, K. Li, Y. Zang, T. Woodward, and
C. Zhu,
“Dynamic functional reorganization of the motor execution network after stroke,”
Brain, 133 1224
–1238
(2010). https://doi.org/10.1093/brain/awq043 Google Scholar
L. Wang, C. Zhu, Y. He, Y. Zang, Q. Cao, H. Zhang, Q. Zhong, and
Y. Wang,
“Altered small-world brain functional networks in children with attention-deficit/hyperactivity disorder,”
Hum. Brain Mapp., 30 638
–649
(2009). https://doi.org/10.1002/hbm.20530 Google Scholar
F. F. Jobsis,
“Noninvasive infrared monitoring of cerebral and myocardial oxygen sufficentcy and circulatory parameters,”
Science, 198 1264
–1267
(1977). https://doi.org/10.1126/science.929199 Google Scholar
H. Obrig and
A. Villringer,
“Beyond the visible–imaging the human brain with light,”
J. Cereb. Blood Flow Metab., 23 1
–18
(2003). https://doi.org/10.1097/00004647-200301000-00001 Google Scholar
D. A. Boas, A. M. Dale, and
M. A. Franceschini,
“Diffuse optical imaging of brain activation: approaches to optimizing image sensitivity, resolution, and accuracy,”
NeuroImage, 23 S275
–S288
(2004). https://doi.org/10.1016/j.neuroimage.2004.07.011 Google Scholar
S. C. Bunce, M. Izzetoglu, K. Izzetoglu, B. Onaral, and
K. Pourrezaei,
“Functional near-infrared spectroscopy,”
IEEE Eng. Med. Biol. Mag., 25 54
–62
(2006). https://doi.org/10.1109/MEMB.2006.1657788 Google Scholar
Y. Hoshi,
“Functional near-infrared spectroscopy: current status and future prospects,”
J Biomed. Opt., 12 062106
(2007). https://doi.org/10.1117/1.2804911 Google Scholar
B. R. White, A. Z. Snyder, A. L. Cohen, S. E. Petersen, M. E. Raichle, B. L. Schlaggar, and
J. P. Culver,
“Resting-state functional connectivity in the human brain revealed with diffuse optical tomography,”
NeuroImage, 47 148
–156
(2009). https://doi.org/10.1016/j.neuroimage.2009.03.058 Google Scholar
C. Lu, Y. Zhang, B. B. Biswal, Y. Zang, D. Peng, and
C. Zhu,
“Use of fNIRS to assess resting state functional connectivity,”
J. Neurosci. Methods, 186 242
–249
(2010). https://doi.org/10.1016/j.jneumeth.2009.11.010 Google Scholar
Y. Zhang, C. Lu, B. B Biswal, Y. Zang, D. Peng, and
C. Zhu,
“Detecting resting-state functional connectivity in the language system using functional near-infrared spectroscopy,”
J. Biomed. Opt., 15 047003
(2010). https://doi.org/10.1117/1.3462973 Google Scholar
H. Zhang, Y. Zhang, C. Lu, S. Ma, Y. Zang, and
C. Zhu,
“Functional connectivity as revealed by independent component analysis of resting-state FNIRS measurements,”
Neuroimage, 51 1150
–1161
(2010). https://doi.org/10.1016/j.neuroimage.2010.02.080 Google Scholar
H. H. Jasper,
“The ten–twenty electrode system of the International Federation,”
Electroencephalogr. Clin. Neurophysiol., 10 371
–375
(1958). Google Scholar
H. Niu, Z. Lin, F. Tian, S. Dhamne, and
H. Liu,
“Comprehensive Investigation of three-dimensional diffuse optical tomography with depth compensation algorithm,”
J. Biomed. Opt., 15 046005
(2010). https://doi.org/10.1117/1.3462986 Google Scholar
D. T. Delpy, M. Cope, P. Van Der Zee, S. R. Arridge, S. Wray, and
J. S. Wyatt,
“Estimation of optical pathlength through tissue from direct time of flight measurement,”
Phys. Med. Biol., 33 1433
–1442
(1988). https://doi.org/10.1088/0031-9155/33/12/008 Google Scholar
D. A. Boas, T. Gaudette, G. Strangman, X. Cheng, J. J. A. Marota, and
J. B. Mandeville,
“The Accuracy of Near Infrared Spectroscopy and Imaging during Focal Changes in Cerebral Hemodynamics,”
NeuroImage, 13 76
–90
(2001). https://doi.org/10.1006/nimg.2000.0674 Google Scholar
W. H. Press, Numerical Recipes in C, Cambridge University Press, Cambridge, England
(1986). Google Scholar
N. A. Lazar, and
T. Nichols,
“Thresholding of statistical maps in functional neuroimaging using the false discovery rate,”
NeuroImage, 15 870
–878
(2002). https://doi.org/10.1006/nimg.2001.1037 Google Scholar
|


