
|
|
1.IntroductionThe rapidly emerging area of nanotechnology has provided a new impetus to life sciences by way of introducing new tools and techniques.1 Among these, molecular trafficking in cells and diagnosis of pathological tissue sites in vivo tagged with luminescent nanomaterials have demonstrated powerful imaging potential of nanotechnology.2–4 Targeted drug and gene delivery by means of nanoparticle (NP) vehicles5 bioconjugated with targeting molecules, such as receptor ligands, antibodies, peptides and metabolites represents another promising application scope of nanomaterials.6,7 At the same time, the widespread applications of nanotechnology in daily life (cosmetic products) and medical practices (pharmaceutical products) have raised several concerns on the nanomaterial potential hazards due to their unpredictable fate in mammalian organisms and environment, demanding systematic studies.8,9 Recently emerged nanotoxicology addresses these issues. In particular, nanomaterial absorption rate in biological tissue, and associated toxicological consequences of this absorption are the key problems. Skin represents the organ, which is the most exposed to this potential nanotechnology assault. Therefore, assessment of nanomaterial absorption in skin represents an important research goal.10–12 Nanoparticle skin penetration occurs predominantly via intercellular and/or trans-appendageal pathways. NP skin permeability depends on the NP properties, such as size, shape, surface functional groups, surface charge.9,13 Skin properties can profoundly affect NP penetration. For example, pathologically modified skin (e.g., melanoma lesion) is considerably more permeable to NPs. Chemical (skin enhancers) and physical (ultrasound, massage) treatments of skin promote nanomaterial uptake in skin.13–17 Investigation of skin permeability versus these parameters will provide valuable knowledge on how to promote or avoid NP penetration in skin. Among many methods of assaying NP penetration in skin, optical imaging methods stand out due to their noninvasiveness, high sensitivity, and high spatial resolution. Indeed, in optical imaging of nanoparticle distribution in skin, in vitro and in vivo, including quantum dots13 and zinc oxide,12 NPs impregnated with organic fluorescent dye have been successfully demonstrated.18 However, the existing nanomaterials have several shortcomings. Organic fluorescent dyes sealed in the NP matrix are still prone to photobleaching, and have low efficiency in the infrared (IR) spectral range. Cytotoxicity of quantum dots is hotly debated; their luminescence is intermittent (blinking), and susceptible to environmental perturbations.19–21 The existing nanomaterials are characterized by relatively broad emission and suboptimal signal-to-background ratio, termed contrast. First, the vast majority of fluorescent probes are excited by light in the ultraviolet (UV) or visible range, while the emitted fluorescence signal is detectable in the visible spectral range. However, it is in this spectral range biological tissues absorb and scatter light strongly.22 Second, the tissue exposure to light in this range induces intrinsic fluorescence of the living biological tissue (termed autofluorescence) caused by the presence of endogenous fluorophores, such as NAD[P]H, FAD, flavin, keratin, etc. (skin autofluorescence).23 Although signals generated by luminescent NPs and autofluorescence of biological tissue are separable using spectral methods, the practical efficiency of these approaches is limited. Third, multiple scattering of light in the optically turbid medium of biological tissue generates an unwanted signal overhead in the detection channel. These impair the detection sensitivity and contrast in many biomedical imaging scenarios. In order to counter these shortfalls of the existent luminescent nanomaterials, we demonstrated the application of UCNPs to background-free imaging of nanoparticle penetration in skin. A recent breakthrough in UCNP synthesis24–26 resulted in nanoparticles with greatly improved luminescence property, measured in terms of conversion efficiency, , i.e., the emission/excitation power ratio. The unique photophysical properties of UCNPs were expected to allow almost complete suppression of the biological tissue background that may lead to the ultimate single nanoparticle photodetection sensitivity. Photon upconversion is a nonlinear process manifested by conversion of the longer-wavelength excitation to shorter-wavelength emission. The mechanism is based on the sequential absorption of two or more photons by the metastable long-lived energy state, as shown in Fig. 1 (adapted from Ref. 27), which can be induced by relatively low-intensity () continuous-wave excitation.28 This process differs markedly from simultaneous two-photon absorption (occurs via a virtual energy level) stimulated by the excitation intensity as high as that is usually realized by means of a complex and expensive femtosecond pulsed laser.29 The majority of the upconversion processes involve photon absorption mediated by the dopant ions know as sensitizers, followed by nonradiative energy transfer from the sensitizer to another dopant ion knows as an activator, culminating in the energy transfer upconversion. The latter process involves a pair of the sensitizer and activator ions excited to the intermediate excited levels.30 The activator can be transferred to the next excited energy level at the expense of the participating sensitizer decaying to the ground state. Materials that contain lanthanide and transition-metal ions feature several metastable levels, and often exhibit upconversion phosphorescence, also referred to as luminescence. Fig. 1Schematic energy level diagram of Ytterbium () ions with participating Erbium () or Thulium () ions, respectively. and () serve as the sensitizer and activator, respectively.  The most popular UCNP represents an inorganic nanocrystal matrix () co-doped with the sensitizer ytterbium () and activator erbium () or thulium () rare-earth ions. In the quantum system, a network of closely spaced Yb-ions sensitizes infrared radiation at a wavelength of 978 nm, and couples the nonradiative resonance energy to neighboring Tm-ions characterized by multiple excited states with exceptionally long (sub-ms) lifetimes. As a result of the energy transfer upconversion, radiates at 474 nm (three sequential photons) and 798 nm (two sequential photons) spectral bands (Fig. 1). Since the UCNP excitation/emission process is nonlinear, its conversion efficiency () increases linearly versus the excitation intensity reaching saturation at the high intensity value of to .30 There are two main advantages of UCNPs in the context of biomedical optical imaging. Firstly, the luminescence band at 798 nm falls into the biological tissue transparency window spectral range [clear area in the gray-shaded plot of Fig. 2(a)]. The absorption of the IR (978 nm) laser light by water constituent of biological sample, such as skin, is compensated by the reduced scattering of bio-tissue. The biological tissue transparency window for skin [Fig. 2(b)] is calculated and presented in Fig. 2(a) in terms of the effective attenuation (defined as the tissue depth at which incident light intensity is attenuated fold) versus wavelength. of skin with such constituents as water, blood etc., was calculated as , where and stand for the absorption and scattering coefficients31 —reduced scattering coefficient, being the anisotropy factor of tissue. The excitation/emission of () is hence advantageous for biomedical optical imaging. Secondly, UCNP excitation at 978 nm elicits minimal autofluorescence from biological tissue, and this minute autofluorescence signal is Stokes-shifted to the longer-wavelength, while the upconversion emission is shorter-wavelength shifted allowing efficient spectral separation of the autofluorescence and UCNP luminescence.32 Fig. 2(a) Optical effective attenuation spectrum of living skin tissue (solid green line) dominated by water (, blue “-∙∙-” line), hemoglobin (Hb, brown “- -” line), oxy-hemoglobin (, red solid “-” line), proteins (not shown), with the scattering effect taken into account. Biological tissue transparency window ranges from 700 to 1300 nm, visualized as clear area against the gray-shaded area. Calculated based on the published data.33 (b) Autofluorescence image of human skin under the excitation at 405 nm. The viable epidermis layer is color-coded green and marked by an arrow, with cell nuclei are visible as dark ovals. Dermis, visualized primarily via collagen and elastin bundles, is adjacent to the epidermis extending to the right. 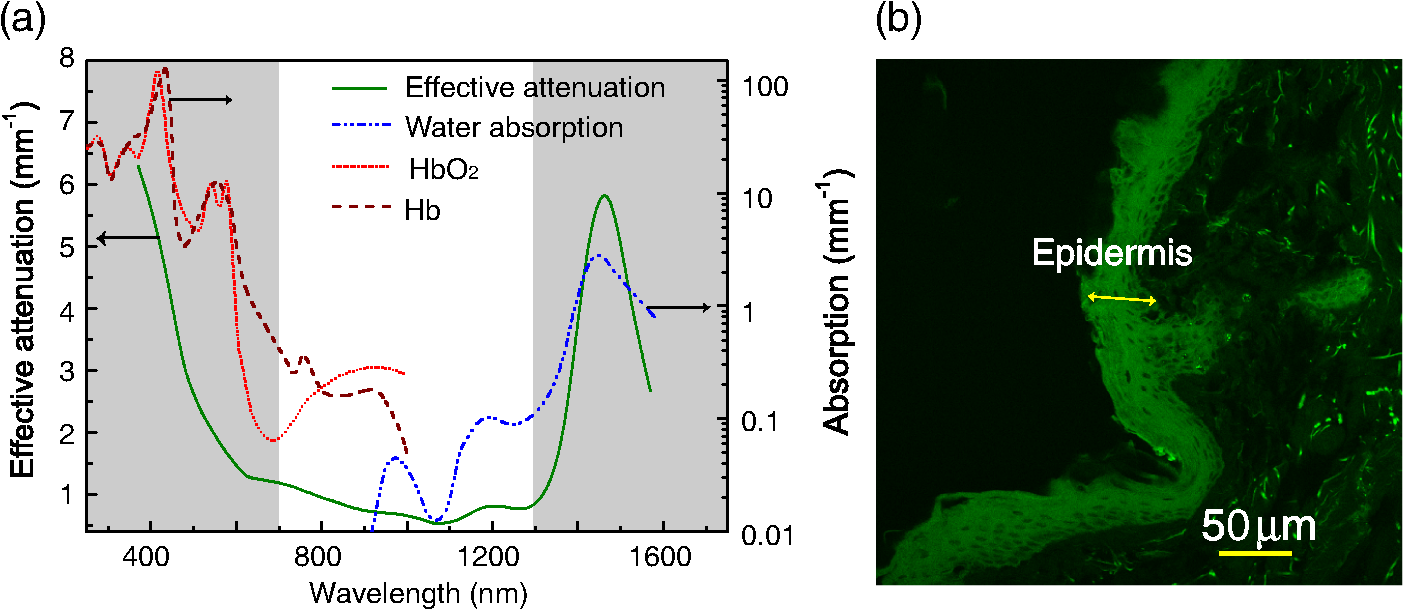 The promise of upconversion nanoparticles has been recently demonstrated by imaging of UCNP biomolecular complexes in cell cultures, tissue phantoms, and whole animal models,34–38 with the autofluorescence background suppressed. The biocompatibility/cytotoxicity and targeted delivery was thougoughly reviewed.39 These studies have demonstrated the potential of the upconversion luminescence for applications in biomedical imaging. These studies have also revealed shortcomings of UCNP technology. These include limited penetration depth of the UCNP-assisted optical imaging in whole animals because of the requirement for the high excitation intensity usually realised by focussing, which is not readily achievable in turbid biological tissue.32 Besides, the broad angular distribution of unwanted background photons emerging from biological tissue deteriorates the spectral filtering efficiency of UCNP luminescence (-fold suppression efficiency drops to -fold).40 These findings suggest considering target applications, that make use of the key UCNP merits, while evading their shorfalls. One such application is ultrasensitive imaging of UCNPs in thin tissue layers, such as skin. Demonstration of the background-free imaging of nanoparticles in skin will pave a way towards ultrasensitive in vivo imaging of NP penetration distribution profile in skin and diffusion kinetics. The paper scope is as follows. First, UCNP-assisted optical imaging that exhibited complete suppression of the optical excitation and skin autofluorescence background is reported for the first time to the best of our knowledge. Based on this result, the ultimate sensitivity of the UCNP imaging is evaluated and compared with that achievable by using conventional fluorescent dyes. Second, assessment of the basic transport properties of UCNPs, such as permeability and diffusion coefficient, by means of optical imaging of freshly excised human skin topically treated with upconversion nanoparticles formulated in oil, is reported. 2.Materials and Methods2.1.Upconversion NanoparticlesTwo UCNP samples, designated as UC1 and UC2, were used in this study. Both samples represented a fluoride nanocrystal doped with ions, UC1 and UC2 co-doped with Er () and Tm () ions, respectively. The mean diameters of the oleic acid-capped nanoparticles UC1 and UC2 were 32 and 8 nm, respectively. The luminescence emission spectra of the samples are shown in Fig. 3. The UC1 sample features multiple narrow spectral bands forming green and red spectral multiplets in the visible spectrum. The UC2 sample features a narrow IR band centered at a wavelength of 798 nm, in addition to a blue emission band centered at 474 nm. Note that the IR band of UC2 falls within the biological tissue transparency window. A modified oxygen-free hydrothermal protocol was used for the synthesis of UCNP samples,41 which was reported to produce mono-dispersed particles with controllable sizes and high crystal quality. The UC1 sample (, mean-sized 32 nm) was synthesized using a two-step procedure, where the molar concentrations of Yb and Er were chosen as 18% and 2%, respectively.
The sample UC2 (, mean-sized 8 nm) was synthesized following the same procedure, as described above, except at Step 2, a lower temperature of 280°C and shorter reaction time of 30 min were used. 2.2.CharacterizationTransmission electron microscope (TEM) measurements of UCNP size and morphology were performed using a Philips CM10 TEM with Olympus Sis Megaview G2 Digital Camera. The samples for TEM analysis were prepared by placing a drop (20 μL) of the dilute suspension of nanocrystals onto formvar-coated copper grids (300 meshes) and allowing them to dry in a desiccator at room temperature. Size distributions were validated by dynamic light scattering (DLS) technique using Zetasizer system ZS90 (Malvern Instruments Ltd., United Kingdom) equipped with helium-neon laser (632.8 nm). The upconversion luminescence spectra of the colloidal solutions in quartz cuvettes with 10 mm path length were acquired using a Fluorolog-Tau3 spectrofluorometer (Jobin Yvon-Horiba) illuminated with an external 978-nm continuous-wave diode laser with maximum achievable power of . 2.3.Fresh Skin Franz Cell AssayHuman skin was acquired from the liposuction procedure at Princess Alexandra Hospital, Brisbane. All experiments conducted on human subjects were carried out with the approval of Princess Alexandra Hospital Human Ethics Research Committee (Approval no. 097/090, administrated by the University of Queensland Human Ethics Committee). Freshly excised skin was processed one day following the surgery, which ensured that the skin viability was largely preserved.42 The skin sample was divided into six patches. Each patch was fixed on a Franz cell, which is a common tool for evaluation of transdermal solute transport, whose receptor phase is usually filled with a saline or PBS buffer to keep the membrane (skin) moist and the entire cell is kept at 35°C to achieve a skin surface temperature of 31°C, in order to maintain physiologically relevant conditions.43 The skin patch treatment exposure area was chosen as , and the UCNP material was applied in quantity of 0.8 mg formulated in 250-μL capric/caprylic triglyceride (CCT) oil in similarity with many cosmetic formulations available on the market. Several selected skin sites were produced with microneedle pretreatment, in order to promote UCNP penetration into the deeper layers of skin, typically, dermis. The geometrical size of the microneedle arrays was in terms of its length, width, and thickness, respectively. There were three microneedles per 5-mm plate. The plates were assembled in banks of two with 2-mm spacing. A LaserPro S290 laser milling machine was used to cut the 50-μm thick 304 stainless steel sheet to the microneedle specifications. Quality control was done on the microneedles before application and the observed configuration was long and wide, with a 250-μm long tip angled at 55 deg. After treatment with UCNP (18 h), skin patches were washed thoroughly. The treated skin was frozen and sectioned, along the dermis-stratum corneum plane, into 20-μm thin cross-sections using a microtome, fixed on glass slides, mounted with Antifade Gold (Invitrogen, New York) and covered with 170-μm thick coverslips. All skin processing followed a standard procedure commonly used in therapeutic research avoiding contamination introduced by handling. Based on the data reported elsewhere,44,45 the microneedle perforated micro-channel dimensions were estimated as follows: depth, 200 μm; surface perforation length, 150 to 200 μm, with negligible surface perforation width.44 The skin cross-section looked unperturbed 18 h post-microtomed, as observed by Bal et al.45 in accord with our own observations. 2.4.Wide-Field Epi-Luminescence Optical MicroscopyThe optical microscopy system for upconversion luminescence image acquisition was based on the commercial inverted microscope (Olympus IX71, Olympus, Tokyo, Japan), where our home-built illumination module was incorporated. This module transformed the outputs of light sources, coupled to the microscope illumination port via a multimode fiber (Fig. 4), to uniform illumination of the field-of-view at the sample plane. These light sources were an UV-light-emitting diode (mean-wavelength 365 nm) and infrared (IR) continuous wave laser at 978 nm. In brief, the fiber output is imaged at the back focal plane of the objective lens [ UAPO water-immersion objective lens (Olympus, Tokyo, Japan)], by means of coupling the objective and field lens; whereas an iris (behind the coupling objective) is imaged at the field of view whose area is controlled by the iris aperture. Hence, this circuit represents a Köhler illumination type. The multimode fiber was dithered by a mechanical vibrator leading to speckle averaging at the field of view, which improved the uniformity of the illumination field. An auxiliary illumination module mounted upright was used for acquisition of bright-field images in transmission mode [see, for example, Fig. 5(a)]. Fig. 4A schematic diagram of the modified inverted optical microscopy built in-house showing an illumination and detection optical circuits. The infrared (IR) and ultraviolet (UV) excitation sources are multimode fiber-coupled. The fiber output is converted to uniformly illuminated field-of-view at the sample plane. The filter sets are interchangeable depending on the excitation and emission wavelengths. See text for details.  Fig. 5Optical image of the freshly excised human skin cross-section topically treated with the upconversion nanoparticles (sample UC1, mean size 32 nm) formulated in oil. The images were acquired under (a) bright field, (b) 978-nm laser illuminations; (c) pseudo-color overlay of (a) and (b) highlighting the NP confinement in stratum corneum. SC, Epi, and Dermis designate stratum corneum, viable epidermis, and dermis layers, respectively. Yellow slanted cuts are to guide the eye for delineating these layers.  Several filter sets were inserted into the microscope illumination and detection paths, including a filter set designed for acquisition of skin tissue autofluorescence and upconversion nanoparticles images excited by the UV (FC6) and IR (FC5) sources, respectively. FC6 contained a band-pass filter wavelength-centered at 350 nm, with the bandwidth of 50 nm (short notation, ), long-pass dichroic mirror (beam splitter), with the wavelength cut-off at 409 nm, and an additional band-pass in front of the electron-multiplying charge-coupled device (EMCCD) camera (IXon EMCCD Camera, Andor Technology plc., Belfast, UK). The FC5 filter set comprised a long-pass (cut-off, 850 nm) color-glass filter (RG 850, Edmund Optics Inc., Barrington, New Jersey) in the excitation path to filter the 978-nm excitation source, a single-edge dichroic mirror (FF511-Di01-, wavelength cut-off 800 nm; Semrock) reflecting the IR excitation and transmitting the visible emission light to the EM CCD. A blocking-edge short-pass filter (FF01-842/SP-25, wavelength cut-off, 842 nm; Semrock, Rochester, New York) was placed in front of the camera to block the residual IR light. The field of view/spot size and the illumination power intensity were tunable to optimize imaging conditions. 3.Results and Discussion3.1.Size DistributionThe size distribution of as-synthesized nanomaterials was evaluated by analyzing TEM images of the UCNP samples. Figure 6 shows TEM images of (UC1) and (UC2) nanoparticles. The size distribution of UC1 [Fig. 6(a)] and UC2 [Fig. 6(b)] samples was estimated as and , respectively, which was consistent with the DLS measurement. As confirmed by the x-ray crystallography analysis (not shown), the UC1 and UC2 nanoparticles exhibited - (hexagonal) and - (cubic) crystal phases, respectively. Fig. 6The size distribution of the upconversion nanoparticle samples: (a) and (b) nano crystal. Insets: Transmission electron microscope (TEM) images of the corresponding samples. Scale bar, 100 nm.  Both materials were surface-coordinated with oleic acid functional groups that form a nonpolar hydrocarbon chain monolayer on the surface of nanoparticles that renders them soluble in organic solvents. Specifically, as-synthesized samples were re-dispersed in hexane. UCNPs were also mixable with CCT oil which represented the oil base of cosmetics formulations, producing uniform suspension due to its molecular structure and high viscosity. 3.2.Luminescence SpectraThe luminescence spectrum of the UC1 sample shows three typical emission bands, which are grouped in blue (408 nm), green (522 and 541 nm), and red (658 nm) multiplets [Fig. 3(a)]. Referring to the energy diagram shown in Fig. 1, these transitions are attributed to , , , and , respectively. The green/red and blue multiplets are due to the sequential two and three photon energy absorption, respectively, via the upconversion processes. Note that the peak intensity in the green band is higher than that in the red band. This corroborates our earlier assertion of the -crystal phase of the sample UC1, and also reports on its high crystal quality, as the green band is highly susceptible to nonradiative relaxation due to bulk crystal and surface defects. The luminescence spectrum of the UC2 sample exhibits two emission bands grouped in blue (474 nm) and infrared (798 nm) multiplets [Fig. 3(b)] due to the sequential three and two photon energy absorption, respectively. As discussed in Introduction, this nanomaterial is particularly promising for biomedical imaging applications due to its excitation and emission bands in the near-IR spectral range (978 and 798 nm, respectively) that are situated in the biological tissue therapeutic window [Fig. 2(a)]. It is also anticipated that optical excitation at 978 nm would elicit very little autofluorescence response of the skin tissue. More quantitative assessment of the background due to the autofluorescence and optical excitation back-scattering represents one of the prime goals of this work, and is reported in the experiment described below (Sec. 3.4). 3.3.Imaging of UCNP/Intact SkinTwo UCNP formulations were applied on freshly excised skin patches. These patches were mounted on Franz’s cells orienting stratum corneum upwards and immersing the dermal side to buffer solution that was kept at temperature 35°C to sustain the physiological conditions of skin for the duration of the experiment, i.e., 18 h. The formulations based on the UC1 and UC2 samples were applied on intact skin and skin treated with a microneedle device, respectively. Application of this device produced a set of tapered indentations protruding to variable depths in skin, predominantly, in dermis. The subsequent application of the UCNP formulation led to the nanoparticle penetration into these indentations followed by their closure and localization of UC2 NPs in discrete sites in dermis. The skin surface remained intact in between the microneedles. This experimental arrangement allowed testing the intact skin permeability to nanoparticles of mean-sizes 32 and 8 nm; in the latter case, examining intact skin fragments; and, also, diffusion of the 8-nm NPs (UC2) in dermis. Figure 5 shows the results of our optical imaging of the 32-nm NP (UC1) distribution in intact skin. Figure 5(a) represents the bright filed image and Fig. 5(b) represents the upconversion luminescence image of the same site illuminated with the 978-nm laser. One can clearly see that NPs were confined in the SC layer of skin [demarcated in Fig. 5(c)], with no traces of NPs in the deeper layers (to the right of SC). The second observation emphasizes the high contrast of the UCNP signal under the epi-luminescent imaging conditions. In order to evaluate this imaging contrast quantitatively, we carried out a more comprehensive study of UCNPs in skin by using sample UC2 (), since its excitation/emission bands were situated in the biological tissue transparency window, i.e., more suitable for biomedical applications. 3.4.Quantitative Evaluation of UCNP Imaging Contrast in SkinUCNP/skin images were acquired using the modified inverted microscope (described in Sec. 2.4—Wide-Field Epi-Luminescence Optical Microscopy) and illuminated by an UV [365 nm, Fig. 7(a) and 7(d)] light-emitting diode and IR [978 nm, Fig. 7(b) and 7(e)] laser, followed by the image processing and analysis. The radius of the uniformly illuminated area was measured as for the UV and IR illumination allowing estimation of the excitation intensity at the sample by reading out the optical power at the sample plane. Figure 7, top row, presents the distribution of 8-nm UCNPs in intact skin, i.e., skin fragments that evaded the microneedle treatment. Figure 7, bottom row, presents the UCNP distribution in the micro-needle-treated skin. As expected, the nanoparticles stayed in SC of the intact skin, with some accumulation in the skin fold, whereas the compact localization of UCNPs in deep sites in dermis is clearly observable (Fig. 7, bottom row). As schematically shown in Fig. 7(g), UCNP accumulation sites were located randomly at the same 100-μm-scale depth in dermis, as expected from operation of the microneedle device,44,45 which corroborated the device-assisted nanoparticle penetration pathway. Fig. 7Eight nanaometer nanoparticle (, sample UC2) distribution in (top row) intact and (bottom row) microneedle-treated human skin, respectively, following topical application of the upconversion nanoparticle (UCNP) formulated in capric/caprylic triglyceride (CCT) oil. (a), (d), Ultraviolet (UV; 365 nm) excited autofluorescence images of skin; (b), (e) images of UCNPs excited by a 980-nm laser; (c), (f), pseudo-colour overlaid images of (a), (d) showing UCNPs (purple color) in the skin furrow and dermis (green color), respectively. (g) Schematic diagram of the procedure of the application of a microneedle (here, one-blade microneedle, for clarity). From left to right: the microneedle blade is removed from the skin, leaving a perforation that takes the shape of the blade. This cut closes within several minutes followed by application of the formulated upconversion nanoparticles that penetrate to dermis through random perforation pores. At the skin preparation stage, thin skin cross-sections are microtomed with a blade, so that a line of randomly distributed UCNP sites at the intersection of the microneedle and microtome blades are clearly observable. 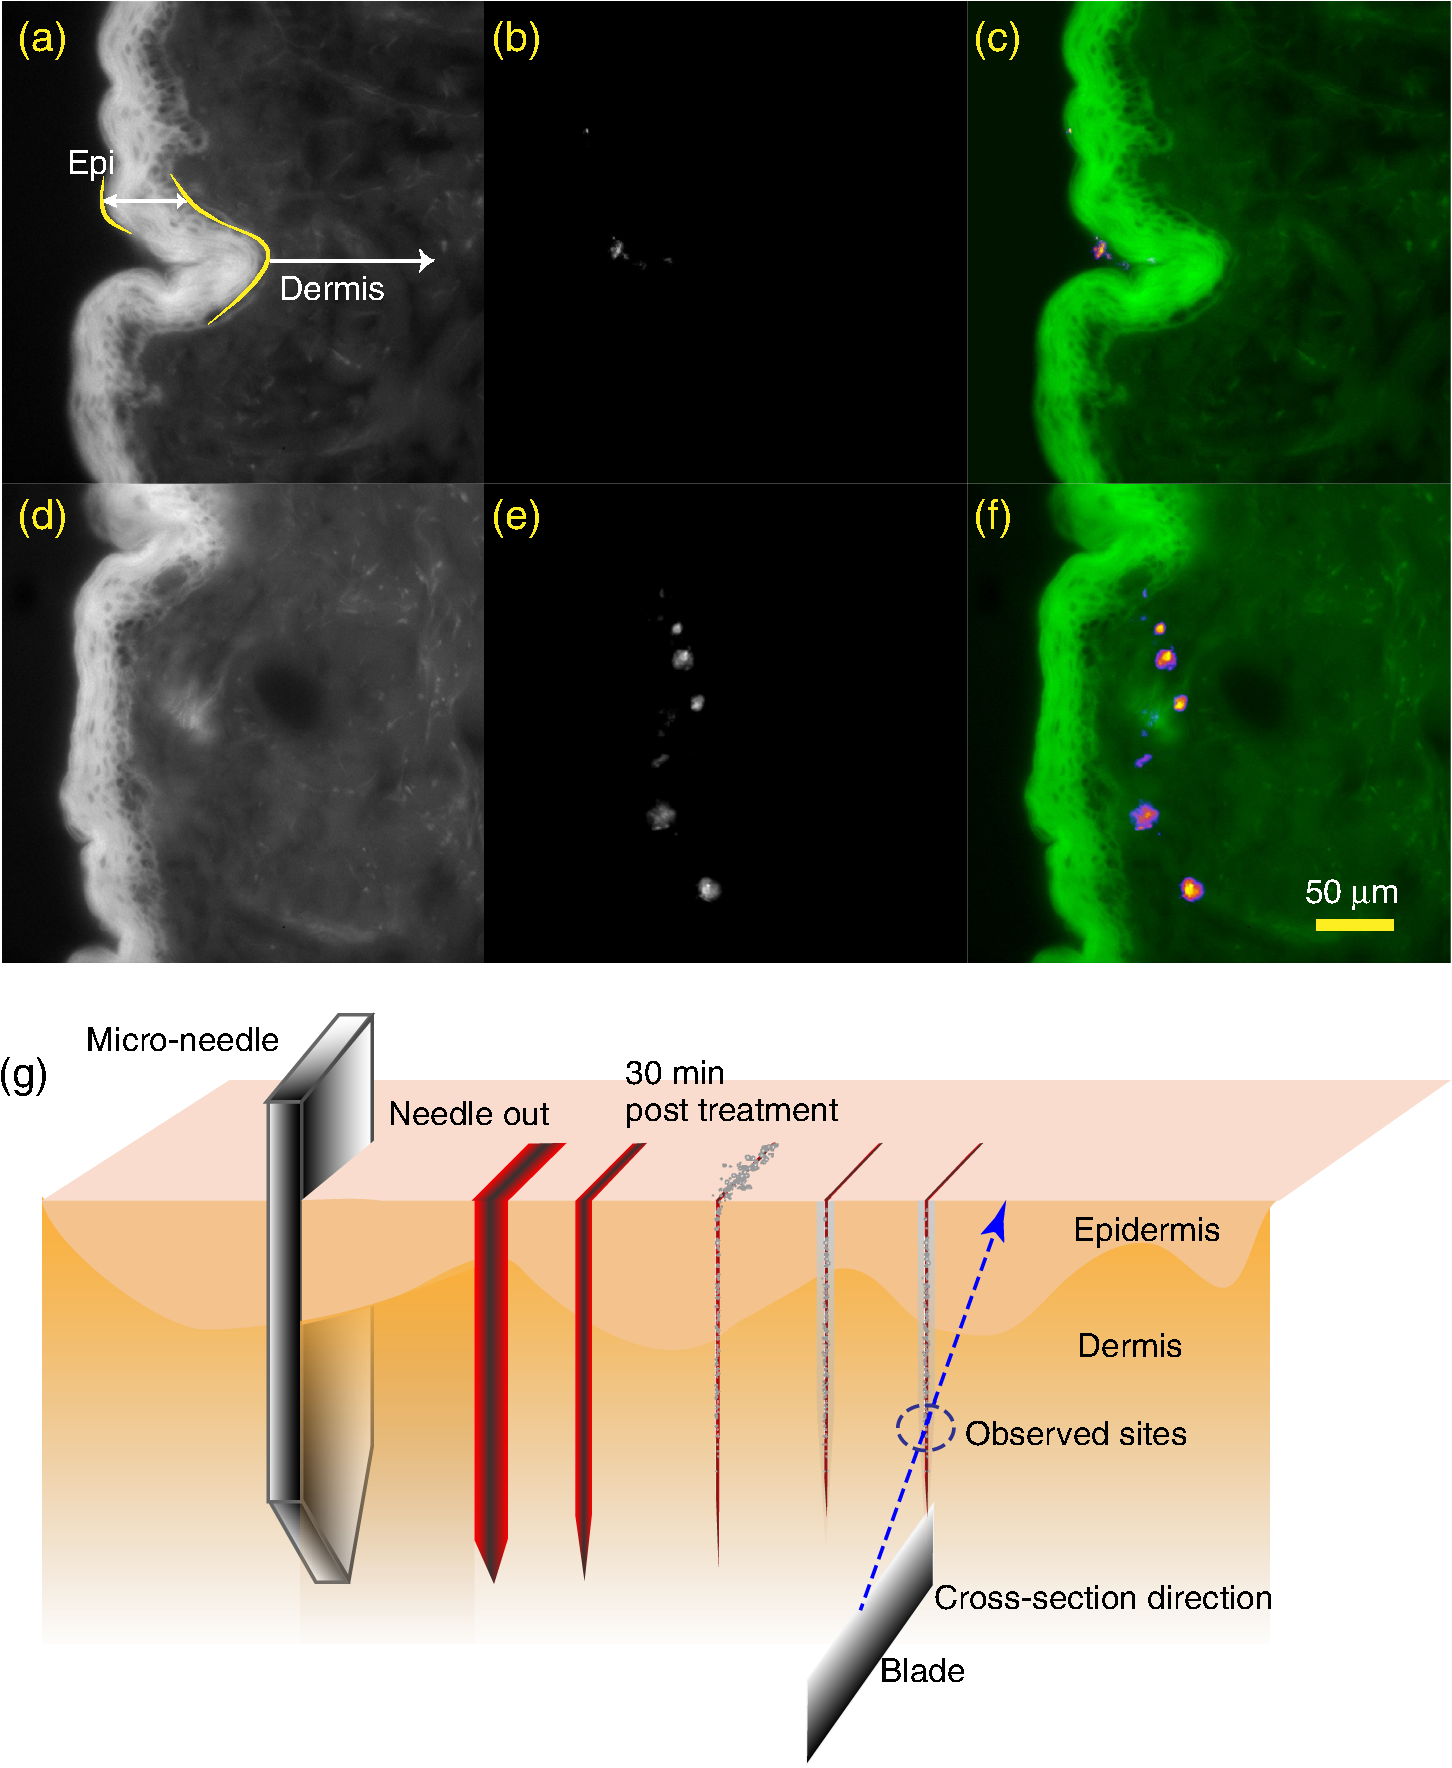 A very high Epi-luminescence imaging contrast, defined as the signal-to-background (S/B) ratio, of UCNP versus skin deserves particular attention. It turned out that the background signal was at the level of the cooled EMCCD camera electronic noise, i.e., approximately 60 photoelectrons per pixel per second (), with very little dependence on the sample layout, including a clear glass cover slip and fixed thin human skin sample, ambient lighting, and 978-nm laser illumination (see Table 1). The mean signal level of the UCNP was estimated as at the suboptimal excitation intensity of (, being the saturation intensity) determined by the available power of the laser source and illumination module throughput. Due to the supra-linear dependence of the UCNP conversion efficiency, , its saturation occurs at the higher intensities, such as reported by Ref. 46, or reported in our case,47 which varies depending on the material characteristics. Table 1Evaluation of UCNPs and freshly excised human skin signals excited by the IR and UV light sources Error was determined based on a standard deviation over the measurements at several pixels.
Table 2Parameters used for comparative estimate of the imaging contrast of Stilbene 1 and a single UCNP, 70 nm in diameter.
In order to place this investigation into the context of fluorescent molecular probe imaging on the biological tissue autofluorescence background, we quantified the autofluorescence signal of our freshly excised skin sample under the UV excitation. The measured average optical background signals from the epidermis and dermis human skin layers amounted to and , respectively, at the UV excitation intensity of (Table 1). Note that the autofluorescence signal (comprising contributions from endogenous NAD[P]H elastin, tryptophan, flavins, and porphyrins) was appreciably faded during the 18-h experimental procedure due to the disruption of the metabolic activity of cells in the epidermal and dermal layers.42 The dermis layer autofluorescence turned out to be dimmer because of the lower abundance of the dominant endogenous fluorophores, NAD[P]H and FAD, and inefficient excitation of the major dermal structures of collagen and elastin at 365 nm. In order to demonstrate the promise of the molecular probes based on the upconversion nanoparticles for ultrahigh-sensitivity imaging, two imaging scenarios were modeled and compared. Epi-luminescence imaging of a single UCNP and UV organic fluorescent dye [Stilbene 1, (Sb1)] on the experimentally measured skin background were considered, and their contrasts were evaluated. The detected signal, [] of a single molecular probe is calculated by using the following equation: where , , and denote the emitter absorption cross-section, conversion efficiency, and number of emitters contributing to the signal sampled by one pixel of the imaging camera, respectively; is a conversion coefficient that combines the objective lens collections efficiency, microscope detection circuit throughput, and EMCCD camera quantum conversion efficiency. For simplicity, is assumed spectrally invariant. In the UCNP model, we consider a particle of the mean diameter of 70 nm, whose photophysical properties were characterized, based on the method reported by Popov et al.47 Note that UCNP’s is a linear function at reaching a plateau at , which we assume equal to , and will be used hereafter for the evaluation.47 The number of Sb1 molecules that make up the imaging contrast S/B, comparable to that of the UCNP was estimated from the following equation: where and denote the skin sample autofluorescent signal and EMCCD electronic noise, respectively, as shown in Table 1. Note that the ratio of is constant in virtue of the linearity of the Sb1 and endogeneous fluorophore signals versus the excitation intensity, so it suffices to use its experimental value measured at .Substituting the tabulated values to Eq. (2), one gets the number of Stilbene 1 molecules of that reaches the signal level of one upconversion nanoparticle whose imaging contrast on the skin autofluorescence background is comparable to that of a single UCNP-based molecular probe, see Table 2 (parameters used for this estimation). Such a significant (five orders of magnitude) difference in imaging contrasts is partly due to the least favorable choice of the UV fluorophore. However, in the case of ultrahigh sensitivity imaging of live skin, the background due to the autofluorescence and excitation light back-scattering can be daunting for a fluorescent organic dye in UV and visible spectral ranges, while UCNP contrast is still expected to be determined by the electronic noise. So, although our comparison is arguably biased, it is not unrealistic for the in vivo imaging. Such an unprecedented contrast of the upconversion nanomaterials can be utilized in many challenging optical biological imaging applications. As an example of the utility of this high imaging contrast, we demonstrate the evaluation of the NP diffusion rate in dermis. 3.5.Upconversion Nanoparticle Diffusion in DermisReferring to Fig. 7, tight clustering of UCNPs at the microneedle indentation sites suggested anomalously slow diffusion rate of these 8-nm NPs into skin. In order to quantify this observation, we analyzed the transport properties of UCNPs (sample UC2) by fitting our data to the following theoretical model. The diffusion of the upconversion nanoparticles in dermal tissue outside of a microneedle channel (diameter ) of the assumed initial distribution of UCNPs is described by the following diffusion equation in cylindrical coordinates: where is the NP concentration at time and distance from the center of the microneedle, and is the diffusion coefficient. The UCNP concentration at is assumed constant; imposes the boundary condition at , and the initial condition, , of no nanoparticles outside of the channel at .Equation (3) is readily solved using Laplace transform (see, for example, Ref. 49) yielding the Laplace-domain solution: where is the modified Bessel function, is the Laplace variable, and is the characteristic time of diffusion. Equation (4) for concentration was inverted numerically and fitted to the experimental data using a custom-written code in Python programming language. The numerical inversion was performed using an algorithm described in Ref. 50. As the diameter of the channel produced by the microneedle was not known, two methods of fitting the experimental data were implemented: In Method 1, was fixed to 3 μm, and and were found by regression [see Fig. 8(b), blue solid line]. In Method 2, , and were all determined by regression [Fig. 8(b), red dotted line]. The result of the fitting curve and data is shown in Fig. 8(b) exhibiting good regression quality. The first and second methods yielded the nanoparticle diffusion coefficient of and (), respectively. This approach provided a relatively tight range for the approximation of the nanoparticle diffusion coefficient in the dermal tissue.Fig. 8Diffusion of upconversion nanoparticles from a dermal site located at the tip of microneedle channel. (a) Distribution of upconversion nanoparticle (UCNP) concentration evaluated in terms of photoelectrons per pixel per second versus the pixel coordinate, the peak represents the UCNP counts at the tip of microneedle. (b) Averaged UCNP concentration radial profile (gray diamond scatter) fitted to the diffusion theoretical model (method 1—blue solid line; method 2—red dotted line).  To compare our results with the existing data, we refer to the diffusion rates for different molecules in dermal tissues.51,52 For example, the diffusion coefficient of hydrocortisone () in human dermis was reported as . Assuming that the diffusion coefficient in the dermis behaves similarly to that of water and is proportional to ,53 where is the volume of the molecule or nanoparticle, the expected ratio of the diffusion coefficients is: where is the density of hydrocortisone, is Avogadro’s number, and (8 nm) is the UCNP (UC2) diameter. Using the experimental values for and given above yields a much smaller ratio of about . Therefore, is more than three orders of magnitude less than expected from our evaluation [see Eq. (5)]. Such considerable reduction of the diffusion rate in dermis in comparison with that in homogeneous medium is not unreasonable, and can be explained by e.g., the binding of UCNPs to immobile fractions (fiber phase) of the dermis. Another potential explanation is the NP size was comparable or larger than the average distance between fibers in the dermis.The aggregation of UCNPs in skin might be another likely contributor to the UCNP diffusion arrest in dermis. Although our estimation of the NP diffusion rate in skin warrants further study, it demonstrated the potential of the background-free imaging to investigate the useful properties of the nanoparticle transport and distribution in biological tissue, such as skin. The high-contrast, high-sensitivity imaging was instrumental in the acquisition of the low-intensity NP diffusion tail, which would otherwise be obscured by the optical background because of skin autofluorescence and scattering. 4.ConclusionsWe reported on the application of upconversion nanoparticles (UCNP) to optical imaging in skin. Demonstration of the complete suppression of background due to the biological tissue scattering and autofluorescence represents the key result of this work. Due to the background level suppressed to that of the electronic noise, the UCNP imaging contrast was pushed to the highest achievable value considering the available excitation intensity. High-sensitivity imaging scenarios cross-comparison between UCNP and UV organic fluorescent dye models demonstrated many orders of magnitude superiority of UCNP, with useful bearings on prospective ultrahigh-sensitivity imaging in vivo and quantitative evaluation of long term toxicity effects. The utility of the background-free imaging of UCNP in skin was demonstrated by investigating nanoparticle transport properties in skin. We found that 8- and 32-nm UCNPs stayed at the topmost layer of the intact skin, stratum corneum. In case of the microneedle treated skin, 8-nm nanoparticles were found confined at the micro-needle indentations in dermis spreading very slowly ( to ). This study holds considerable promise for deployment of the upconversion nanomaterials in optical ultrahigh-sensitivity imaging in thin tissue slices, such as skin, with very realistic prospects of extension to in vivo applications. AcknowledgmentsThe authors would like to acknowledge Australian Research Council Discovery Project Grant No. DP130101112; National Health and Medical Research Council, Australia, Grant No. APP1008739; and Macquarie University Postgraduate Research Funding and Russian Foundation for Basic Research Grant Nos. 11-02-01542-a and 12-04-01258-a. We are grateful to Jenny Ordóñez and Li Lin for providing support with skin preparation and microneedles. ReferencesC. M. Niemeyer,
“Nanoparticles, proteins, and nucleic acids: biotechnology meets materials science,”
Angew. Chem. Int. Ed., 40
(22), 4128
–4158
(2001). http://dx.doi.org/10.1002/1521-3773(20011119)40:22<4128::AID-ANIE4128>3.0.CO;2-S ACIEF5 1433-7851 Google Scholar
P. Alivisatos,
“The use of nanocrystals in biological detection,”
Nat. Biotechnol., 22
(1), 47
–52
(2003). http://dx.doi.org/10.1038/nbt927 NABIF9 1087-0156 Google Scholar
T. A. Kelfet al.,
“Non-specific cellular uptake of surface-functionalized quantum dots,”
Nanotechnol., 21
(28), 285105
(2010). http://dx.doi.org/10.1088/0957-4484/21/28/285105 NNOTER 0957-4484 Google Scholar
V. K. A. Sreenivasanet al.,
“Barstar:barnase—a versatile platform for colloidal diamond bioconjugation,”
J. Mater. Chem., 21
(1), 65
–68
(2011). http://dx.doi.org/10.1039/c0jm02819c JMACEP 0959-9428 Google Scholar
L. Brannon-PeppasJ. O. Blanchette,
“Nanoparticle and targeted systems for cancer therapy,”
Adv. Drug Del. Rev., 56
(11), 1649
–1659
(2004). http://dx.doi.org/10.1016/j.addr.2004.02.014 ADDREP 0169-409X Google Scholar
N. Yamazakiet al.,
“Endogenous lectins as targets for drug delivery,”
Adv. Drug Del. Rev., 43
(2‚ Äì3), 225
–244
(2000). http://dx.doi.org/10.1016/S0169-409X(00)00071-5 ADDREP 0169-409X Google Scholar
A. Beckeret al.,
“Receptor-targeted optical imaging of tumors with near-infrared fluorescent ligands,”
Nat. Biotechnol., 19
(4), 327
–331
(2001). http://dx.doi.org/10.1038/86707 NABIF9 1087-0156 Google Scholar
G. J. Nohyneket al.,
“Grey goo on the skin? Nanotechnology, cosmetic and sunscreen safety,”
Crit. Rev. Toxicol., 37
(3), 251
–277
(2007). http://dx.doi.org/10.1080/10408440601177780 CRTXB2 1040-8444 Google Scholar
M. J. OsmondM. J. McCall,
“Zinc oxide nanoparticles in modern sunscreens: an analysis of potential exposure and hazard,”
Nanotoxicol., 4
(1), 15
–41
(2010). http://dx.doi.org/10.3109/17435390903502028 1743-5390 Google Scholar
S. E. Crosset al.,
“Human skin penetration of sunscreen nanoparticles: In-vitro assessment of a novel micronized zinc oxide formulation,”
Skin Pharmacol. Physi., 20
(3), 148
–154
(2007). http://dx.doi.org/10.1159/000098701 1660-5527 Google Scholar
B. Gulsonet al.,
“Small amounts of zinc from zinc oxide particles in sunscreens applied outdoors are absorbed through human skin,”
Toxicol. Sci., 118
(1), 140
–149
(2010). http://dx.doi.org/10.1093/toxsci/kfq243 1096-6080 Google Scholar
A. V. Zvyaginet al.,
“Imaging of zinc oxide nanoparticle penetration in human skin in vitro and in vivo,”
J. Biomed. Opt., 13
(6), 064031
(2008). http://dx.doi.org/10.1117/1.3041492 JBOPFO 1083-3668 Google Scholar
T. W. Prowet al.,
“Quantum dot penetration into viable human skin,”
Nanotoxicol., 6
(2), 173
–185
(2012). http://dx.doi.org/10.3109/17435390.2011.569092 Google Scholar
T. Mauroet al.,
“Barrier recovery is impeded at neutral pH, independent of ionic effects: Implications for extracellular lipid processing,”
Arch. Dermatol. Res., 290
(4), 215
–222
(1998). http://dx.doi.org/10.1007/s004030050293 ADREDL 0340-3696 Google Scholar
J. A. BouwstraM. Ponec,
“The skin barrier in healthy and diseased state,”
Biochim. Biophys. Acta-Biomembr., 1758
(12), 2080
–2095
(2006). http://dx.doi.org/10.1016/j.bbamem.2006.06.021 0005-2736 Google Scholar
T.-R. Kuoet al.,
“Chemical enhancer induced changes in the mechanisms of transdermal delivery of zinc oxide nanoparticles,”
Biomaterials, 30
(16), 3002
–3008
(2009). http://dx.doi.org/10.1016/j.biomaterials.2009.02.003 BIMADU 0142-9612 Google Scholar
A. P. Popovet al.,
“Advantages of NIR radiation use for optical determination of skin horny layer thickness with embedded nanoparticles during tape stripping procedure,”
Las. Phys., 16
(5), 751
–757
(2006). http://dx.doi.org/10.1134/S1054660X06050045 LAPHEJ 1054-660X Google Scholar
C. Wuet al.,
“Multicolor conjugated polymer dots for biological fluorescence imaging,”
Acs. Nano., 2
(11), 2415
–2423
(2008). http://dx.doi.org/10.1021/nn800590n 1936-0851 Google Scholar
R. Hardman,
“A toxicologic review of quantum dots: Toxicity depends on physicochemical and environmental factors,”
Environ. Health Perspect., 114
(2), 165
–172
(2006). http://dx.doi.org/10.1289/ehp.8284 EVHPAZ 0091-6765 Google Scholar
T. S. Haucket al.,
“In vivo quantum-dot toxicity assessment,”
Small., 6
(1), 138
–144
(2010). http://dx.doi.org/10.1002/smll.v6:1 1613-6829 Google Scholar
D. R. Larsonet al.,
“Water-soluble quantum dots for multiphoton fluorescence imaging in vivo,”
Science, 300
(5624), 1434
–1436
(2003). http://dx.doi.org/10.1126/science.1083780 SCIEAS 0036-8075 Google Scholar
M. H. Niemz, Laser-Tissue Interactions: Fundamentals and Applications, Springer, Berlin; Heidelberg, New York
(1996). Google Scholar
K. Königet al.,
“In vivo drug screening in human skin using femtosecond laser multiphoton tomography,”
Skin Pharmacol. Phys., 19
(2), 78
–88
(2006). http://dx.doi.org/10.1159/000091974 Google Scholar
F. Wanget al.,
“Tuning upconversion through energy migration in core-shell nanoparticles,”
Nat. Mat., 10
(12), 968
–973
(2011). http://dx.doi.org/10.1038/nmat3149 NMAACR 1476-1122 Google Scholar
H. X. Maiet al.,
“High-quality sodium rare-earth fluoride nanocrystals: Controlled synthesis and optical properties,”
J. Am. Chem. Soc., 128
(19), 6426
–6436
(2006). http://dx.doi.org/10.1021/ja060212h JACSAT 0002-7863 Google Scholar
H. X. Maiet al.,
“Highly efficient multicolor up-conversion emissions and their mechanisms of monodisperse core and core/shell-structured nanocrystals,”
J. Phys. Chem. C, 111
(37), 13721
–13729
(2007). http://dx.doi.org/10.1021/jp073920d 1932-7447 Google Scholar
J. F. Suyveret al.,
“Upconversion spectroscopy and properties of doped with , and/or ,”
J. Lumines., 117
(1), 1
–12
(2006). http://dx.doi.org/10.1016/j.jlumin.2005.03.011 JLUMA8 0022-2313 Google Scholar
S. W. Wuet al.,
“Non-blinking and photostable upconverted luminescence from single lanthanide-doped nanocrystals,”
Proc. Acad. Nat. Sci. USA, 106
(27), 10917
–10921
(2009). http://dx.doi.org/10.1073/pnas.0904792106 PNASA6 0027-8424 Google Scholar
M. Yuet al.,
“Laser scanning up-conversion luminescence microscopy for imaging cells labeled with rare-earth nanophosphors,”
Anal. Chem., 81
(3), 930
–935
(2009). http://dx.doi.org/10.1021/ac802072d ANCHAM 0003-2700 Google Scholar
R. H. Pageet al.,
“Upconversion-pumped luminescence efficiency of rare-earth-doped hosts sensitized with trivalent ytterbium,”
J. Opt. Soc. Am. B: Opt. Phys., 15
(3), 996
–1008
(1998). http://dx.doi.org/10.1364/JOSAB.15.000996 JOBPDE 0740-3224 Google Scholar
N. Y. Ignatievaet al.,
“Laser-induced modification of the patellar ligament tissue: Comparative study of structural and optical changes,”
Las. Med. Sci., 26
(3), 401
–413
(2011). http://dx.doi.org/10.1007/s10103-010-0871-0 LMSCEZ 1435-604X Google Scholar
C. Vinegoniet al.,
“Transillumination fluorescence imaging in mice using biocompatible upconverting nanoparticles,”
Opt. Lett., 34
(17), 2566
–2568
(2009). http://dx.doi.org/10.1364/OL.34.002566 OPLEDP 0146-9592 Google Scholar
V. V. Tuchin, Tissue Optics: Light Scattering Methods and Instruments for Medical Diagnosis, SPIE, Bellingham, WA
(2007). Google Scholar
Q. Liuet al.,
“Sub-10 nm hexagonal lanthanide-doped naluf(4) upconversion nanocrystals for sensitive bioimaging in vivo,”
J. Am. Chem. Soc, 133
(43), 17122
–17125
(2011). http://dx.doi.org/10.1021/ja207078s JACSAT 0002-7863 Google Scholar
Q. Zhanet al.,
“Using 915 nm laser excited -doped upconversion nanoparticles for in vitro and deeper in vivo bioimaging without overheating irradiation,”
Acs. Nano., 5
(5), 3744
–3757
(2011). http://dx.doi.org/10.1021/nn200110j 1936-0851 Google Scholar
M. Nyket al.,
“High contrast in vitro and in vivo photoluminescence bioimaging using near infrared to near infrared up-conversion in and doped fluoride nanophosphors,”
Nano. Lett., 8
(11), 3834
–3838
(2008). http://dx.doi.org/10.1021/nl802223f NALEFD 1530-6984 Google Scholar
C. T. Xuet al.,
“Autofluorescence insensitive imaging using upconverting nanocrystals in scattering media,”
Appl. Phys. Lett., 93
(17), 171103
(2008). http://dx.doi.org/10.1063/1.3005588 APPLAB 0003-6951 Google Scholar
L. Xionget al.,
“High contrast upconversion luminescence targeted imaging in vivo using peptide-labeled nanophosphors,”
Anal. Chem., 81
(21), 8687
–8694
(2009). http://dx.doi.org/10.1021/ac901960d ANCHAM 0003-2700 Google Scholar
F. Wanget al.,
“Upconversion nanoparticles in biological labeling, imaging, and therapy,”
Analyst, 135
(8), 1839
–1854
(2010). http://dx.doi.org/10.1039/c0an00144a ANLYAG 0365-4885 Google Scholar
F. Leblondet al.,
“Pre-clinical whole-body fluorescence imaging: Review of instruments, methods and applications,”
J. Photochem. Photobiol. B: Biol., 98
(1), 77
–94
(2010). http://dx.doi.org/10.1016/j.jphotobiol.2009.11.007 JPPBEG 1011-1344 Google Scholar
G. S. YiG. M. Chow,
“Water-soluble nanoparticles with significant enhancement of upconversion fluorescence,”
Chem. Mater., 19
(3), 341
–343
(2007). http://dx.doi.org/10.1021/cm062447y CMATEX 0897-4756 Google Scholar
W. Y. Sanchezet al.,
“Analysis of the metabolic deterioration of ex vivo skin from ischemic necrosis through the imaging of intracellular NAD(P)H by multiphoton tomography and fluorescence lifetime imaging microscopy,”
J. Biomed. Opt., 15
(4), 046008
(2010). http://dx.doi.org/10.1117/1.3466580 JBOPFO 1083-3668 Google Scholar
Dermal Absorption and Toxicity Assessment, Informa Healthcare, New York
(2007). Google Scholar
H. KalluriA. Banga,
“Formation and closure of microchannels in skin following microporation,”
Pharm. Res., 28
(1), 82
–94
(2011). http://dx.doi.org/10.1007/s11095-010-0122-x PHREEB 0724-8741 Google Scholar
S. Balet al.,
“In vivo visualization of microneedle conduits in human skin using laser scanning microscopy,”
Las. Phys. Lett., 7
(3), 242
–246
(2010). http://dx.doi.org/10.1002/lapl.v7:3 1612-2011 Google Scholar
J. C. BoyerF. van Veggel,
“Absolute quantum yield measurements of colloidal , upconverting nanoparticles,”
Nanoscale, 2
(8), 1417
–1419
(2010). http://dx.doi.org/10.1039/c0nr00253d 1556-276X Google Scholar
A. P. Popovet al.,
“Upconversion luminophores as a novel tool for deep tissue imaging,”
Novel Biophotonic Techniques and Applications, 80900V SPIE, Munich, Germany
(2011). Google Scholar
T. M. Stacheleket al.,
“Detection and assignment of the “phantom” photochemical singlet of trans-stilbene by two-photon excitation,”
J. Chem. Phys., 66
(10), 4540
–4543
(1977). http://dx.doi.org/10.1063/1.433708 JCPSA6 0021-9606 Google Scholar
H. S. CarslawJ. C. Jaeger, Conduction of Heat in Solids, Clarendon Press, Oxford
(1959). Google Scholar
L. N. TrefethenJ. A. C. WeidemanT. Schmelzer,
“Talbot quadratures and rational approximations,”
BIT, 46
(3), 653
–670
(2006). http://dx.doi.org/10.1007/s10543-006-0077-9 NBITAB 0006-3835 Google Scholar
K. Kretsoset al.,
“Partitioning, diffusivity and clearance of skin permeants in mammalian dermis,”
Int. J. Pharm., 346
(64–79),
(2008). http://dx.doi.org/10.1016/j.ijpharm.2007.06.020 IJPHDE 0378-5173 Google Scholar
Y. G. AnissimovM. S. Roberts,
“Modelling dermal drug distribution after topical application in human,”
Pharm. Res., 28
(9), 2119
–2129
(2011). http://dx.doi.org/10.1007/s11095-011-0437-2 PHREEB 0724-8741 Google Scholar
C. R. WilkeP. Chang,
“Correlation of diffusion coefficients in dilute solutions,”
AlChE J., 1
(2), 264
–270
(1955). http://dx.doi.org/10.1002/(ISSN)1547-5905 AICEAC 0001-1541 Google Scholar
|
||||||||||||||||||||||||||||||||||||


