
|
|
1.IntroductionStudying cellular responses to different environmental factors (e.g., drug, tobacco, alcohol, radiation, etc.) is important for various medical disciplines, including pharmacology and toxicology. In addition to analysis of specific mechanisms, rapid and sensitive monitoring of general cellular responses is required in applications such as preliminary drug screening or in the estimation of nonspecific toxic (or subtoxic) effects.1 Because of the potential importance of this information, many testing systems have been developed to determine the general and specific toxicity at the cellular level.1, 2, 3, 4 Among the various testing systems, differential modifications of optical spectroscopy have been found to be promising. Absorption (transmittance) spectroscopy. Drug actions can be evaluated through alterations in attenuation of optical radiation resulting from corresponding changes in endogenous absorbing cellular structures [e.g., near-IR absorption spectroscopy can measure changes in the redox state cytochrome (Cyt) under the influence of cyanide, a mitochondrial inhibitor].5 A common problem of this technique, however, is its relatively low absorption sensitivity due to the short optical path of light in cells. Refractive microscopy. Techniques such as phase-contrast and differential-interference-contrast microscopy provide information about drug actions by simultaneously monitoring corresponding changes in the cellular fine-refractive structure, for example, via drug-induced changes in mitochondrial shape and size.6, 7 Although this technique is more sensitive (at least 1 order of magnitude) and yields more specific information on cellular changes than does the conventional cytotoxicity tests, greater sensitivity is still needed. Fluorescent technique. Today, the flow cytometry and confocal scanning microscopy with fluorescence labeling provide the most powerful and sensitive tools for observing and quantitating metabolic, physiologic, and morphologic parameters in single cells.8, 9, 10, 11, 12, 13 For example, these techniques are used to detect the toxic impact of drugs on mitochondrial metabolism through differential diagnosis of oxidized and reduced forms of respiratory chain components9 or measurement of the concentration of NADH with a dual-pulsed laser technique.10 However, photobleaching effects and the quick escape of fluorescent indicators through diffusion limit the great potential of these tools. Moreover, growing evidence shows that fluorescence labeling may seriously distort genuine cell-drug interactions through unwanted indicator-cell or indicator-drug interactions.11, 12 Raman and optical scattering microscopy. Recently, nonresonant Raman spectroscopy demonstrated the ability to image DNA and protein redistribution during paclitaxel-induced apoptosis in single HeLa cells.13, 14 A relatively weak scattering phenomenon limited this technique to study the dense biological structures, such as nuclei. Another technique, optical scattering imaging, demonstrated that it was capable of monitoring calcium-induced alterations in mitochondrial morphology, as verified in parallel with fluorescence and differential-interference contrast microscopy.15 These techniques do not require a staining procedure, making them promising candidates for further development. Photothermal technique. The optical absorption of nonfluorescent cellular structures can be measured by detecting absorbed energy transformed through nonradiative relaxation into heat, that is, photothermal (PT) effects.16 For nonfluorescent samples, this PT technique provides the highest absorption sensitivity (approximately 5 orders of magnitude better than transmission spectroscopy) and allows evaluation of super small concentrations of molecules with a sensitivity comparable to that of laser fluorescence methods.16, 17 Several studies have demonstrated promising applications of PT techniques in different modes, such as imaging of single live cells in vitro without conventional labeling18, 19, 20 and sensitivity-specific PT responses to different environmental impacts,21, 22, 23, 24, 25, 26, 27, 28, 29, 30 including photodynamic effects,21 the influence of drugs,22, 23, 30 laser radiation,20 radiation,30 and apoptosis-inducing factors25, 26, 27, 28, 29, 30 such as different chemicals,25, 27 nicotine,26, 30 and lasers.28 The universal mechanisms of PT assay to monitor different impacts, and especially its high sensitivity, however, was not discussed in detail. In particular, necessary verification of PT data has not been performed with conventional assay in parallel for a broad range of doses, which is crucial for understanding the principal of PT assay. This present work attempts to fill this gap. In particular, we present further development of our theoretical model of PT assay,26, 29, 30 which was verified with an advanced PT microscope/spectrometer and conventional assays with studies of the nicotine impact on pancreatic cells. Nicotine. Nicotine, a toxic alkaloid and a major component of tobacco smoke, has a wide spectrum of biological activities—some detrimental, some beneficial.31, 32, 33, 34 The positive effects of nicotine are attributed to the activation of metabolic systems in the central nervous system. Conversely, the negative effects of this drug include adverse effects on the cardiovascular and gastrointestinal systems and potentiation of cancer development in various organs, including the pancreas. In particular, it has been reported that nicotine reduces the intracellular level of ATP, which indicates a switch from apoptosis to necrosis.32 Furthermore, preincubation of human cells with nicotine completely inhibited ultraviolet light-induced apoptosis (e.g., through prevention of Cyt release and caspase activation).33 Nicotine has also been reported to affect the responsiveness of squamous cell carcinoma to treatment as a result of its ability to decrease the cytotoxicity of anticancer agents such as cisplatin and radiation.34 While it is important to understand the mechanisms by which nicotine induces the inhibition of apoptosis, we also need to understand the possible induction of apoptosis in response to high concentrations of nicotine and inhibition of apoptosis by the influence of low concentrations of nicotine. Here, based on our theoretical model, we demonstrate that the advanced PT assay, in addition to its ability to detect the impact of low doses of nicotine with high sensitivity, has also the potential to distinguish between various functional states of cells associated with the nicotine-induced change in metabolism, early and late stages of apoptosis, and necrosis. 2.Methods and Materials2.1.Physical Basis of the PT MethodAs summarized from previous publications,20, 23, 24 the phenomena surrounding the PT method can briefly be described as follows. For a short laser pulse (where and represent the relaxation of excited molecular states and the thermal relaxation time, respectively) irradiated a single absorbing target, the temperature dynamic may be roughly estimated in linear mode as follows23, 24: where is the laser fluence rate is the absorption coefficient [ , where is the cross section of absorption and is the concentration of absorbing biomolecules per unit of volume and are local density and heat capacity, respectively; and is the quantum yield of absorbed energy transformed into heat: , where and are the quantum yield of absorbed energy transformed into fluorescence and photochemical processes, respectively. For targets with three basic geometries: a sphere with radius ; a cylinder with radius and length ; and a plane circle disk with radius and thickness : a parameter may be estimated, respectively, as follows35, 51: where is thermal diffusivity. The average relaxation time can be estimated as follows16:where and are nonradiative and radiative relaxation times, respectively, and is the rate of photochemical processes. For condensed biological tissue, the typical time for is , and (i.e., most absorbed energy is transformed into heat); therefore, in Eq. 1 .29 Thus, the PT response from an absorbing target demonstrates a high initial peak (due to fast heating of the target) and a much slower exponential tail (corresponding to the cooling time of the heated target with time ). For example, for spherical targets with , 100 nm, 500 nm, and , estimations of (for water parameters, ) are approximately 4 nsec, 16 nsec, , and , respectively.In turn, temperature distribution is transformed into refraction distribution (where describes the temperature sensitivity of the refractive index), which induces a probe-beam phase shift, being20, 23: where is the length of the absorbing target. Phase shift can be detected with different techniques, including phase-contrast imaging (see Sec. 2(C)).2.2.Biological Basis of PT Assay2.2.1.Main principleIn the PT assay, the cellular response to the impact of nicotine (or other agents such as drug, radiation, etc.)30 is monitored through nicotine-induced changes in PT responses from light-absorbing, nonfluorescent endogenous cellular nanostructures that can be used as natural indicators of nicotine’s action.23 Indeed, many cellular proteins with chromophoric groups (e.g., cytochromes - P450 and others) are involved in cellular signaling pathways that are extremely sensitive to different impacts.2, 3 From a diagnostic perspective, most chromophores provide the strongest local absorption in the visible and near-infrared regions (at least to times higher than background absorption from water, lipids, etc.)35 with specific localization in membrane and cytoplasm (e.g., organelles, reticulum, etc.) forming specific cellular absorbing structures. The most potential cellular events during the nicotine-cell interaction (e.g., change in metabolism, inactivation of enzymes, apoptosis, or necrosis) may be accompanied by the changes in local absorbing structures properties, that, in turn, will influence the PT response. Indeed, according to Sec. 2(A), on the one hand, PT-response amplitude and temporal shape depend on several chromophore’s properties, including local absorption, biomolecule concentration, characteristic relaxation times, and thermodynamic and geometric parameters. On the other hand, published data show that different environmental impacts on cells through various mechanisms may accompany changes in biomolecular concentration and coefficient absorption,5, 6, 7, 36, 37 quantum yields (e.g., through quenching of fluorescence or photochemical reactions),16, 38 or shape and size of the organelles,6, 7, 15 including their shrinking, swelling, or spatial reorganizations. The shrinking of the cell as a whole, and especially cellular organelles, are usually related to a metabolic response to a small concentration of toxic agents, drug, or early apoptosis.39, 40, 41, 42, 43, 44 In particular, a recent study showed that a decrease in cell and organelles volume may occur much earlier, before other characteristic ultrastructural or biochemical events take place during apoptosis (e.g., at least a few hours before DNA fragmentation).43, 44 The swelling phenomena usually appears at lethal drug doses, toxic effects, late apoptosis, or necrosis.39, 40 The change of spatial location of absorbing chromophores may be related to cytochrome release from mitochondria41, 42, 43, 44 or a release of lysosomal enzymes during necrosis.39, 40 2.2.2.Nanocluster model of PT assayOur underlying hypothesis of mechanism and model of PT assay26, 29, 30 is based on our discovery of the similarity of the PT response behavior in the broad exposure doses under impacts of different origins (e.g., radiation, chemicals, oxidative stress, etc.).30 We already developed the PT model for enhanced selective nanophotothermolysis with nanoclusters,45, 46, 47, 48, 49 and high sensitive biological detection of low-dose radiations.50 We further extend this approach for high sensitive detection of nicotine impacts on different cells. Briefly, the main mechanism of PT assay is determined by laser interaction with endogenous cellular nanoabsorbers, which create absorbing nanoclusters. The nanocluster’s structure depends on properties of single absorbing nanoabsorbers (i.e., biomolecules) with typically nanoscale dimensions (e.g., 7 to 10 nm for cytochrome ),36 and their spatial location (e.g., in membrane, organelles, cytosol, etc.), while whole nanocluster sizes may reach even microscale level (e.g., a few microns as for mitochondria with absorbing cytochromes). Due to the close proximity of nanoabsorbers in these nanoclusters, laser-induced optical, thermal, acoustic, and bubble formation phenomena around each nanoabsorber can overlap, and during interaction may create synergistic effects that are extremely sensitive to spatial organization of nanoabsorbers in nanoclusters, especially to their spatial relocation during cell metabolism, or different therapeutic interventions. At short laser pulses ( , where is thermal relaxation time of a single nanoabsorber), the laser heats each nanoabsorber itself.52 At longer laser pulses , the laser heats also some area around each nanoabsorber due to the heat diffusion. It leads to an increase in the thermal-spot size compared to nanoabsorber size on the value .51 For example, for the typical parameters used [ ; (water)] and 8-ns laser pulse width, thermal overlapping effects will take place within distance . In general, at a distance between a nanoabsorber larger than the thermal diffusion length (i.e., ), the thermal field from each nanoabsorber may be considered as separate, while at a shorter distance or longer laser pulse , the thermal field from each nanoabsorber can overlap, which provides cooperative effects. 2.2.3.PT resolutionThe minimal size of local temperature distribution on PT images visible with a far-field PT microscope is determined by its resolution , which depends on conventional diffractive resolution ,51 and factor as ). For the and other mentioned parameters, and are comparable (0.763 and , respectively). Thus, thermal blurring of the diffraction spot due to heat diffusion during the laser pulse is negligible, and in pulse mode, resolution of the PT microscope mostly depends on conventional diffraction resolution.51 It means that a far-field PT microscope cannot resolve the previously mentioned nanocluster’s structures if the distance between the individual nanoabsorbers is less than the diffraction limit. However, recording specific PT response parameters allows us partly to overcome this problem, because its integrated parameters are very sensitive to nanocluster structure. 2.2.4.Relationship between PT responses and nicotine-induced modification of nanocluster structureThe most important consideration for PT assay are the actions of nicotine on cells which may lead to: 1. an increase or decrease in a local and whole cell volume (e.g., mitochondrial organelles) containing the same amount of absorbing compound (e.g., Cyt in mitochondria); 2. a change in the distance between the closest nanoabsorbers (e.g., during spatial shape change of the membrane with nanoabsorbers); and 3. a release of nanoabsorbers (i.e., absorbing chromophores) from their initial location sites (e.g., Cyt from mitochondria during apoptosis) (Fig. 1 ).30 We may assume also that the released chromophores (during apoptosis or necrosis) can interact with the cytoplasm compartment and create new complexes (or can aggregate itself in new nanoclusters), which may exhibit increased local absorption. Thus, according to the described phenomenological model of the PT assay, the link between nicotine action and PT response is as follows: a change in nanocluster structure, altered localized absorption, a change in laser-induced localized temperature, a change in the local intensity (amplitude) of the PT-image amplitude, and the probability of nonlinear PT phenomena. Fig. 1Qualitative illustration of nanocluster model the PT assay. (a) Change of size absorbing nanocluster (shrinking phenomena); (b) change distance between two nanoabsorbers within nanocluster; (c) spatial relocation of nanoabsorbers (e.g., release Cyt from mitochondria). 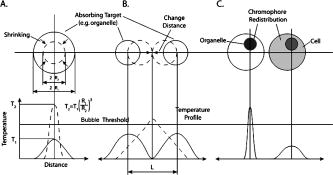 Case 1. This case assumes that the absorbing nanocluster initially had a spherical shape with radius and averaged absorption at a constant number of molecules in the volume [i.e., in Eq. 2: ]. Environmentally induced shrinkage (or swelling) of the nanocluster(s) leads to an increase (or decrease) in local averaged absorption and, in turn, to an increase (or decrease) in temperature and PT response [Fig. 1(a)]. Linear phenomena. The rigorous expression for the total energy absorbed by a spherical absorber in linear mode is derived as follows53: which gives the following expression for first- (at ) and second-order approximations:First approximation is valid for most structures in nonpigmented cells because typical values are: ,35 and (single biomolecules) (mitochondria), i.e., . Local temperature (Eq. 1), which is proportional to the number of molecules in a unit of volume , can be determined at a constant total number of molecules in the whole volume during a change in this volume (i.e., there is no leakage of molecules outside the volume or any modification of the molecules during shrinkage or swelling) as follows:According to this equation, temperature change is strongly dependent on target size (as ). Therefore, even a small geometric change can lead to a significant temperature change. For example, even small shrinkage may lead to sudden bubble formation around the strongest absorbing zone. In the two-beam technique, according to Eq. 4,20, 23 PT response is proportional to the phase change of the probe beam . In particular, if a short laser pulse produces the initial Gaussian distribution of temperature around an absorbing target with radius , where is the maximum temperature [Eq. 1], the probe-beam phase shift in the heat-diffusion process can be described as follows,20 with account taken additionally of the thermal dynamic [Eq. 4]:According to this equation, and with consideration of the previous finding that (see previous), the PT response immediately after the laser pulse (when diffusion may be neglected, i.e., ) will be inversely proportional to the second degree of the target size [i.e., ]. Thus, in a linear mode, direct detection of local temperature is more sensitive to a change in nanotarget size (response ) (Fig. 1, left) than indirect detection of a change via a probe beam passing through the heated zone (because in this case the PT response is ).The advantage offered by the direct-detection method can also be realized in a nonlinear mode, when the probe beam is used to detect the laser-induced bubble formation around the strongest cellular nanostructures. Nonlinear phenomena. The detailed consideration of nonlinear phenomena such as bubble formation and their influence on cells itself is outside the scope of this work, because it has been the subject of many studies.53, 54, 55, 56, 57, 58, 59, 60 In particular, critical temperature for nucleation into cells depends on many factors (e.g., the rate of energy deposition, intracellular density and composition, water content, size of absorbing targets, etc.) and for the typical condition of temperature ranges between 150 to 220°C with the bubble expanding and collapsing on the timescale of 0.1 to .53, 60 The bubble formation can be accompanied by acoustic, chemical, and mechanical phenomena such as shock and acoustic waves, which can damage cells. We emphasize that laser generation bubbles are considered here mainly as a diagnostic tool to monitor local absorption and its changes without direct connection to cell damage, although it would happen. The high sensitivity of the PT technique allows us to detect any small single nanoscale bubbles near the threshold of their generation that could not be very harmful for cells.61 So, this type of diagnostic can be considered noninvasive, or minimal invasive. Because we used relatively low (not lethal) doses of nicotine, we do not expect that the other mentioned factors are crucial for nucleation, although this issue requires further study. Thus, the overlapping thermal and acoustic fields, especially bubbles from separate nanoabsorbers within the nanocluster,47 may lead finally to synergistic increases in efficacy of bubble formation (e.g., by decreased threshold), especially when initial laser-induced temperature is close to the bubble formation. All of these phenomena may dramatically increase the sensitivity and the diagnostic value of this approach, because they are very crucial in changing the position of each nanoabsorber depending on cell function, metabolism, intracellular motion, protein-protein interaction, microenvironmental factors, and external impactors.6, 7, 15, 35 Also, laser generation of single or multinanobubbles around nanotargets and their further expansion above the diffraction limit present one of the possible ways to obtain information of a nanocluster’s structure behavior through their transformation to microscale parameters, which are visible and detectable with a diffraction-limited optical technique. Case 2. This case assumes that two (or more) nanoabsorbers with a characteristic radius are closely located to each other [Fig. 1(b)]. This situation is typical for locating single (or clustered) nanoscale absorbing biomolecules on external or internal cellular membranes or organelle membranes whose complex shape is changed under the impact of nicotine (drug). The integrated temperature profile has the shape shown in Fig. 1(b). The maximum temperature is observed only in the center of each target. If the distance between the centers changes (e.g., decreases up to attachment or even overlapping of nanoabsorbers), however, the integrated temperature profile may show that the temperature in the center between the two targets exceeds the temperature in the center of each target before the distance between the centers was reduced. This decrease in distance between the centers will lead to an increase in PT-response amplitude and to sudden bubble formation (see previous) if the temperature is close to the phase-transition threshold. In this case, the PT assay will be sensitive to a small change in distance between the two absorbing targets. For example, this situation is valid when the thermal spot, , after the laser pulse, becomes larger than the real target size (i.e., ), which is typical for closely located nanobasorbers and relatively long laser pulses , when . Case 3. Complete release of chromophores from a small-volume absorbing volume to a larger-volume one, (Fig. 1, right), results in a redistribution of chromophores within the larger volume, leading to reduced PT-response amplitude in times. For example, during apoptosis, release of cytochrome from the one mitochondrion into the cytoplasm, with typical volumes of and , respectively, may reduce the PT response times. This response is valid for a total redistribution only, although release may not be complete. 2.3.Experimental SetupThe general principle of combining the dual-laser-beam PT method with the phase-contrast technique has been reported in earlier publications.18, 23 For the studies described here, we used a new modification of the PT microscope/spectrometer (Fig. 2 ) recently described in detail.27, 63 Briefly, in PT imaging (PTI) mode, a single cell is irradiated with a short, laser pump pulse [tunable optical parametric oscillator (OPO); wavelength 420 to 575 nm; pulse width 8 ns; pulse energy 0.1 to ; Lotis Limited, Minsk, Belarus) and on time-resolved monitoring of temperature-dependent variations of the refractive index in the cell with phase-contrast imaging [Olympus BX51 microscope with a CCD camera (AE-260E, Apogee Incorporated, Union, Illinois)] of a second, collinear laser pulse (Raman shifter; wavelength 639 nm; pulse width 13 ns; pulse energy 2 nJ) with a tunable time delay between pump and probe pulses (0 to 5000 ns). The low energy level chosen for the probe laser pulse permits minimizing the influence of probe-beam absorption by objects and saturation of optical sensors. The diameters of the pump- and probe-beam spots were 23 and , respectively, covering the entire cell. Formation of a PT image required just one pump pulse without laser scanning. After passing through the sample, the pump radiation was cut off with a filter. The entire PT image-acquisition procedure included illuminating the cell with three pulses: first, a probe pulse; then, after a 0.1-s delay, a pump pulse; and, finally, a second probe pulse with a tunable delay after the pump pulse (0 to 5000 ns). The PT image was calculated as the difference between the two probe images.20, 23 Because of the pump beam’s broad sizes, resolution of the PT microscope (Sec. 2(C)) was determined in the current experiments by conventional diffraction-limited resolution of the microscope itself . In addition to the PTI mode, a second, more simple thermal-lens (thermolens) mode permitted recording the integrated PT response from the whole cell. In this mode, a pump laser-induced refractive heterogeneity (called a virtual thermolens16) caused a defocusing of a collinear cw intensity stabilized He-Ne laser probe beam (model 117A; Spectra-Physics Incorporated; wavelength 633 nm; power 1.4 mW) and hence a reduction in the beam’s intensity at its center, as detected by a photodiode (C5658; Hamamatsu Corporation) supplied with a 0.5-mm-diam pinhole and recorded with a Tektronix TDS 3032B oscilloscope. Compared to previous schematics,18, 23 incorporation in PT microscope high-speed, high-sensitive photodetectors, a stabilized pilot laser, a high-resolution transmission, phase contrast, and fluorescent optical modules with different magnifications (20, 40, 60, and 100x) allowed significant improvement of many PT parameters, in particular, the sensitivity and resolution of the thermolens mode, and verification of the nature of PT images by directly comparing it with other conventional images. 2.4.Preparation and Measurement Procedures2.4.1.Pancreatic cancer cell line AR42JThese cells were maintained in Ham’s F-12 medium, supplemented with heat-inactivated fetal bovine serum (20%), in tissue culture flasks at 37°C with 5% carbon dioxide in air and high humidity. Nicotine (98% pure) was purchased from Sigma Chemical Company (Saint Louis, Missouri). A stock solution of nicotine was prepared in phosphate-buffered saline and neutralized to pH 7.2 with hydrochloric acid. Cells were treated with graded doses of nicotine in concentrations ranging from 1 nM to 100 mM. After treatment with nicotine, the medium was removed and rinsed with a solution. The cells were resuspended in an additional 1 mL of this solution, and the flask was incubated at room temperature (or at 37°C) until the cells detached. The cell suspension was centrifuged at 2000 rpm for 10 min, and the cell pellet was resuspended in fresh medium. 2.4.2.Primary of acinar cellsMale Sprague Dawley rats were sacrificed after an 18-h fast. The pancreas was rapidly removed and freed from fat and lymph nodes. Dispersed pancreatic acini were isolated by enzymatic digestion following the method of Williams.62 Acini were suspended in incubation solution at approximately 0.6-mg acinar protein/ml, preincubated at 37°C for 30 min. The incubation solution contained 128-mM NaCl, 4.7-mM KCl, 1-mM , 1.28-mM , 0.56-mM , 10-mM HEPES, 11.1-mM glucose, 0.5% BSA, soybean trypsin inhibitor, and minimum Eagle’s medium (MEM). The solution was routinely equilibrated with 100% oxygen and titrated to pH 7.4. Cell viability, assessed by trypan blue exclusion, exceeded 95% after each experimental procedure. 2.4.3.Cell line Hep G2 (hepatocellar carcinoma) [ATCC]Cells were incubated at 37°C in a suitable incubator with 5% in air atmosphere. These cells are grown in Dubelco’s Modified Eagle’s Medium/HAM’s Nutrient Mixture F-12, 1:1 with 2.5-mM L-glutamine, 1, sodium bicarbonate, 15-mM HEPES, and 0.5-mM sodium pyruvate, with G418. 2.4.4.PT experiments with cellsThe cell in suspension in concentration and total volume 6 to were put into sealed chambers S-24737 (Molecular Probes). Two chambers with control (untreated) cells and cells treated with nicotine for each concentration were fixed at the same standard microscopic slide. The measurements were performed at room temperature. Each cell was positioned into the center of coaxial laser beams and irradiated with one pump pulse. The total number of irradiated cells was 100, and all experiments were performed three times under the same conditions: 100 control cells, then 100 treated cells, then again control, and so on. Some crucial data were obtained with the use of 300 cells in experiments that were performed five times. In selected experiment, especially at low nicotine concentration, when the difference in PT response from treated and control cells was low, to increase accuracy we irradiated one cell in the chamber with control cells, then irradiated one cell in a closely located chamber with treated cells, and so on. Position cells in an objective plane were changed with a 3-D automatic scanning microscopic stage (Conix Research, Incorporated). The functional state of irradiated cells with specific morphological features (e.g., apoptotic bodies, lost membrane integrity in case of necrosis, etc.) was controlled in parallel with high resolution phase-contrast imaging. 2.4.5.Quantitation of PT response as a function of nicotine concentrationIn a method similar to that used in laser load tests (initially used to estimate cell photodamage),63, 64 we measured the percentage of linear and nonlinear PT responses. The experimental results were used to calculate a ratio: , where is the total number of PT responses after a one-time irradiation of each cell with just one laser pulse, and , where and are the number of linear and nonlinear PT responses, respectively. The results are presented as differences in the percent of the number of nonlinear PT responses between nicotine-treated and control cells, i.e., as . In contrast to the laser load test,63, 64 we named this modified approach as the nonlinear differential PT (DPT) test, assuming its distinctive features and photothermal origin. In partcular, this parameter was used solely for diagnostic purposes as an indicator of nicotine-induced change in the cellular local absortion in noninvasive or minimally invasive condition. This approach with almost real-time measurements of control and treated cells on the same slide allowed us to distinguish small differences in nonlinear DPT parameter , and thus to exclude similar variation in both cellular properties with time (e.g., slight decrease in viability). This parameter also allowed us to correctly compare results with different cell types, because data did not depend on absolute percentage of nonlinear PT response. It allowed us also to increase the accuracy of PT measurements. In particular, as we have demonstrated recently, the reproducibility of nondifferential PT response was within 8.9% for 70 cells, with pulse-to-pulse energy stability in the range of 3.2% for the whole beam and approximately 6.5% for local points of the beam (i.e., hot spots).64 The use of differential parameter allowed us finally to improve accuracy to 6.9%. This parameter was also useful for interpretation of the obtained data. For example, its positive sign indicated activation metabolsim and early apoptosis (both accompanied to shrinking absorbing zones), while its negative sign indicated late apoptosis and toxic phenomena accompanied by swelling effects. 2.5.Assay for Nicotine-Induced Apoptosis and CytotoxicityApoptotic cell death was distinguished from necrotic cell death by fluorescence microscopy. Cells were stained with Annexin V and propidium iodide (PI) (Roche Applied Science, Indianapolis, Indiana) for 15 min, washed twice, and observed with a fluorescence microscope (AxioSkop2 MAT; Carl Zeiss, Göttingen, Germany). Viable apoptotic and necrotic cells demonstrated green around the membrane (apoptosis), or red nuclei and a green membrane (necrosis). More than 500 cells were counted, and the data were calculated as mean plus/minus the standard deviation of three experiments. 3.ResultsTypical PT images of a pancreatic cell in suspension are shown in Fig. 3 . PTI of the cells was performed in a linear regime at a pump pulse energy that caused no cell damage. Lack of damage was verified through cell viability testing after cells in the population were irradiated with one pump pulse. The photodamage threshold for pancreatic cells (at 50% of damaged cells) was found to be at a wavelength of 530 nm. This pulse energy is equivalent to an approximate energy fluence rate of for a pump-beam diameter. As shown in Fig. 3 (left), the PT assay permitted the imaging of some tiny local cellular structures that were not visible by less sensitive transmission imaging. Such structures indicate zones of relatively strong local absorption and correspondingly greater heat release. Compared to previous findings,18, 23 high sensitivity of a new PT set-up allowed us to reveal also some absorbing background between local zones. Minimal size of most local zones was comparable with resolution of the PT microscope. PT image of a cell incubated with nicotine for 1 h (Fig. 3, middle) was structurally similar to that of an untreated cell but showed a slight increase in the number of zones of localized absorption and, what is more important, an increase in PT-signal amplitude of these zones (on average, two-fold, although some individual zones reached even a three-fold increase in intensity) without change of their sizes. In some cases, the zones showed only an increased intensity without an increase in the number of zones. A further increase in nicotine concentration or time of exposure led to a dramatic decrease in the number of detectable zones, their intensity, and sometimes an increase in their geometric sizes (Fig. 3, right). Fig. 3Typical PT images of pancreatic cancer cells AR42J. Left: control cell, no nicotine teratmnet. Middle: treated cell with concentration nicotine , 1-h incubation. Right: treated cell with concentration nicotine 10 mM, 1-h incubation. Pump laser: wavelength 525 nm; pulse width 8 ns; energy ; and probe time delay 10 ns. 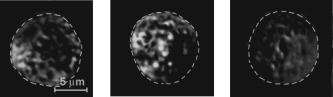 In the thermolens mode at a low laser energy that did not cause significant cell photodamage, the classic PT response was observed (Fig. 4 , top), that is, a high initial peak due to fast heating of the cell through absorption by chromophores, and a much slower exponential tail corresponding to cell cooling as a whole through heat diffusion into the surrounding solution. In the current experiments, the minimum rise time of the PT response was determined by the time response of the photodetector (10 ns). The average cooling time was found to be (at level e), which is a shorter thermal relaxation time , calculated with the first equation in Eq. 2 for a spherical target and measured actual cell size (Fig. 3). This discrepancy can be explained by gravitational flattening out or partial adhesion of cells on the bottom of the slide. The approximation of cell shape as a plane circle disk [see the last equation in Eq. 2] gives (for observed time) as the size of disk thickness of 4 to . This calculation is in agreement with qualitative microscopic observations of cell shape. PT-response amplitude increased with increases in the pulse energy level until local temperatures reached the bubble formation thresholds. At these energy levels, dependence of the peak PT response on the pump pulse energy level was initially saturated (not shown) and then led to formation of a negative peak (Fig. 4, middle and bottom), which indicate microbubble formation around local absorbing zones. More detail of feature PT imaging and time-resolved monitoring of laser-induced bubble-formation phenomena in different cells can be found in our recent publication.64 In particular, the formation of negative peaks can be explained by several effects such as the change in refractive index inside the bubble, scattering of light on the bubble, and a decrease in local temperature related to bubble-induced local cooling phenomena. Fig. 4The temporal shape of integrated PT responses from a pancreatic cancer cell AR 42J at different laser energy. Laser energy and amplitude/time scale from top to bottom: , respectively. 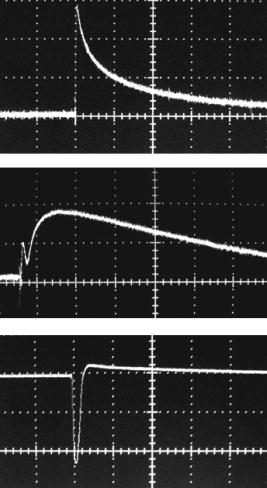 After an initial expansion (rise time of the negative peak), the vapor rapidly cooled and condensed, and the bubbles collapsed (fall time of the negative peak). The lifespan of the bubbles depended on the size of the endogenous absorbing cellular structures and on the laser energy level, ranging on average from 0.5 to . The shape and amplitude of the negative peak were not repeatable from pulse to pulse. For example, after the second laser pulse, the negative peak often disappeared or was significantly reduced in size. It could be explained by laser-induced damage or at least modification of absorbing zones leading to a decrease in local absorption. That is why all measurements were performed with the use of just one laser pulse. With an increase in the laser energy level, the amplitude of negative dramatically increased and reached a level that is at least 1 order magnitude larger than the amplitude positive PT response. With the new high sensitive thermolens scheme, the signal-to-noise ratio for linear and nonlinear PT response was 15 to 20 and 150 to 220, respectively. Figure 5 shows the behavior of percentage of linear PT responses for both control and nicotine-treated cells at different laser pulses. At low energy levels of less than , no change in PT responses occurred for either control or treated cells (i.e., no significant overheating effects around local absorbing zones). However, with an increase in laser energy, the percentage of linear PT responses for treated cells decreased, while there was no change for control cells. With a further increase in energy, the percentage of linear PT responses for treated cells continued to drop significantly, while the percentage of linear PT responses for control cells started to decrease slowly as compared to treated cells. At high energy, a tendency to closing the gap in the percentage of a linear PT response for control and treated cells was observed. The relatively large energy range between one causing no nonlinear PT responses (i.e., only linear PT responses) and one causing a high rate of nonlinear PT responses ( and , respectively) can be explained by natural cell heterogeneities reflecting different sizes and numbers of absorbing nanoclusters as well as different amounts and spatial localizations of absorbing chromophores in these nanoclusters. Indeed, controlled experiments with much more homogeneous spatial distribution of nanoabsorbers (e.g., trypan blue solution, or high concentration of 2- to 250-nm gold nanoparticle in suspension)28, 47, 48, 49 revealed that the energy range is much more narrow (e.g., 18 and and 250 and , respectively). The most “informative” energy range, where the maximum differences in PT responses for control and treated cells appeared, was around (Fig. 5), which was used in all further experiments. Fig. 5Linear PT response as function of laser pulse energy from control and nicotine treated pancreatic cancer cells (AR42J), concentration 5 mM, incubation time is 1 h.  With increased incubation time for fixed nicotine concentration and laser energy ( and , respectively), a percentage of the nonlinear PT responses demonstrated significant growth during the first hour, with an estimated threshold sensitivity to distinguish small changes after 1 to 3 min of incubation (Fig. 6 ). With further increases in incubation time, this parameter achieved a maximum around 3 h, and then slowly declined. The viability tests with trypan blue and Annexin V performed in parallel revealed no notable change in functional cell state during the first 2-h incubation with a slow increase in apoptotic (black circle) and necrotic (blank circle) cells. Thus, the PT assay demonstrated higher sensitivity and time response to nicotine-induced metabolic cells (increase and then slight decrease in metabolism with time incubation) compared to conventional assay. Fig. 6Nonlinear differential PT response from pancreatic cancer cells as function incubation time compared to conventional cell viability tests, nicotine concentration .  To quantitate more accurately PT assay response by excluding possible but not well controlled variation cell properties other than nicotine potential factors (fluctuation of temperature, natural change viability in close chambers, etc.), we used as defined in Sec. 2(D) the nonlinear differential PT test (PDT) and parameter as the differences in the percentage of nonlinear PT responses for treated and control cells measured over a broad range of nicotine concentrations. As can be seen in Fig. 7 , with an increase in the nicotine concentration from 1 nM to 1 mM, the parameter increased, reaching a maximum of approximately 5 mM and then rapidly decreasing to the level of the control cells, or even below the level in the concentration range of 5 to 50 mM. Conventional tests (Annexin V-PI), performed in parallel, showed no response for nicotine concentrations of less than (Fig. 7, bottom). The responses in growing apoptotic and necrotic cells, however, increased slightly with increases in nicotine concentration from to 1 mM, with a significant notable increase in the growth rate after a concentration of 1 mM. We obtained similar PT data also for normal (noncancer) pacncreatic acinar cells and hepatocytes, for which, however, PT response at the same energy was higher compared to the AR42J cell. Correspondingly, the maximum in parameters was achieved at lower laser energy (80 and , respectively) (Fig. 7). Fig. 7Top: Nonlinear differential PT response from pancreatic cancer (AR42J), primary acinar cells, and hepoticytes (Hep G2) cells as a function of nicotine concentration. Pump energy 150, 80, and , respectively. The time incubation with nicotine for all cells is 1 h. Bottom: monitoring of nicotine-induced total cell damage and proportion between apoptotic (gray bars) and necrotic (black bars) cells with Annexin V-PI kits after 1 h of incubation with nicotine. Open bars: total number of both cells.  The analysis of intrastructures of AR42J cells obtained with fluorescent, transmission, and phase contrast imaging for specific nicotine concentration (corresponding to the maximum and minimum of PT responses) revealed some contrast enhancement of tiny local structures for all images, especially for phase-contrast images at concentration 1 mM, that correlated with behavior of PT images in the same concentration range (Fig. 3). At higher concentration these local structures fully or partly disappeared. For example, fluorescent images of the control cells with different labels (Fig. 8 , bottom, and Fig. 9 , first row, right) have shown relatively smooth distribution of label components (protein and mitochondria, respectively), while at concentration 1 mM, the image of mitochondria (Fig. 9, first row, second) revealed notable enhancement of clustered structures. Transmission images at high concentration (Fig. 9, middle row, right) revealed some signs likely of an apoptotic body, while phase contrast images at highest concentration 100 mM (Fig. 9, bottom row, right) demonstrated some loss of membrane integrity related with necrosis. Fig. 8Top: fluorescent images (obtained with Annexin V-PI kit) of pancreatic cells AR42J before (left) and after treatment with nicotine in concentration of (right). Bottom: typical images of single pancreatic cancer cells after treatment with nicotine (the same condition as on top). Green color indicates apoptotic related phenomena; red color indicates necrotic phenomena.  Fig. 9Fluorescent (top row), transmission image (middle row), and phase-contrast (bottom row) images of AR42J cells in suspension. Micro-objective’s magnification 60x. First column: control cells (no treatment with nicotine); second column: 1-h incubation with nicotine, ; third column: 1-h incubation with nicotine at concentration 10 mM (first, middle) and 100 mM (bottom). Fluorescent image was obtained by labeling mitochondria with Mitotracker Red.  The monitoring of cell size in suspension (averaged by 150 cells) with transmission microscopy at high resolution (magnification 100x) at different nicotine concentration revealed a slight tendency to cell shrinking as a whole in the concentration range of to 1 mM and relatively fast swelling at concentration of 50 mM (Table 1 ). Table 1Dependence of cell (AR42J) size on nicotine concentration at incubation time 1 h.
4.Discussion4.1.Mechanism of PT AssayAnalysis of PT-image cell structure before and after the impact of nicotine (Fig. 3) indicates that nicotine’s action leads, at least at a concentration range around (1-h incubation), to increased intensity of local absorbing structures without notable change of their sizes as determined by resolution (i.e., by diffraction spot) of a PT microscope. On the contrary, high doses lead to dramatic decrease in the intensity of local zones with notable swelling of some of them, which is in line with our previous findings of toxic action of some drugs and chemicals on cells.23 The observed phenomena can be explained by the change of local absorption within cellular absorbing nanoclusters under nicotine impact, as described in the nanocluster model (Sec. 2(B)). These PT image data are in good correlation with increased PT response amplitude in linear mode at low laser energy (the percentage of this response was the same and close to 100%, as indicated in Fig. 5), and especially with increase in the percentage of nonlinear PT response (and decrease in the percentage of linear PT response, respectively) at high laser energy (Fig. 7). Hence, both local PT image amplitude and PT response amplitude in linear mode, and the percentage of nonlinear PT responses yield information in different ways on the change of local cellular absorption, although the nonlinear PT response was more sensitive than the linear response to changes in nicotine concentration. Thus, the data shown in Figs. 6, 7 may be interpreted as follows. A low nicotine dose (i.e., low concentration or low incubation time) leads to increased local absorption, and a high concentration leads to decreased local absorption. The comparison of the behavior of PT-image structures (Fig. 3), the percentage of nonlinear PT responses through differential parameter (Fig. 7, top), the apoptosis- and necrosis-related effects observed with conventional assays (Fig. 7, bottom, Fig. 8), and notable change in conventional image structures (Fig. 9) and cell sizes (Table 1) indicate that the PT data may be correlated with the following stages of cell responses to nicotine’s impact: 1. increased nonlinear PT response at low concentrations (1 nM to ), where standard assay does not reveal any sign even of early apoptosis, which means that PT assay may detect nicotine-induced reversible metabolic changes; 2. further increased PT response with a slightly higher rate of nicotine concentrations of 0.5 to 5 mM, which are detectable with different methods (shrinking whole cells, and especially cellular local structures); and 3. a sharp decrease of the PT response in a relatively narrow concentration range (5 to 30 mM), which is correlated with late apoptosis- or the necrosis-related phenomena. Comparison of PT and conventional viability data for AR42J shows (Fig. 7) that the high sensitivity of the PT assay permits detecting nicotine’s impact at a minimum concentration of 1 to 10 nM, while a conventional kit allows some change to be detected at a minimum concentration of 10 to . In other words, the PT assay is at least 3 orders of magnitude more sensitive than the conventional assay. 4.2.Nature of Absorbing NanoclustersThe observed behavior of the PT response to nicotine’s impact (Fig. 7) is similar to that recently found with advanced PT assay for different environment factors, such as drugs, chemicals, and even ionizing radiation.29, 30, 50, 67 The differences are pronounced with doses corresponding to the PT response. For example, for drugs with highly toxic action (e.g., vinblastine),30 no marked stage of growing nonlinear PT response is indicated, only their decreases were associated with the inhibition of metabolic and toxic effects. In particular, as we showed before, the effects of 5-mM sodium azide for 5 min on human lymphocytes and of an antitumor drug (dexamethasone ; 5-min incubation) on human lymphoblasts were similar; that is, linear local PT-response amplitude was decreased (on average, 1.5 to 2 times) in PT images, with total disappearance of the strongest local zones.23 On the contrary, for nontoxic or low-dose toxic compounds, the stage of a growing nonlinear PT response is dominant at low and moderate concentrations. Also, response of different cells to nicotine impact has shown great similarity (Fig. 7). These facts raise the key question: what is the potential of absorbing cellular nanoclusters that are so sensitive to nicotine’s impact? The analysis of previous findings, estimation of the character, and the dynamic range of nicotine-induced changes in various PT parameters, and especially the specific behavior of nonlinear PT responses, allow us to suggest that the mechanism that might be responsible for such behavior is a change in the cellular absorbing nanostructures (see the model in Sec. 2(B)) associated likely with Cyt in mitochondria. Indeed, Cyt is a major cellular component with dominant strongest absorption at 520 to 570 nm (with a maximum near 550 nm) in many cells.25, 65 The PT spectra of individual local zones in PT images (Fig. 3) obtained at different wavelengths of pump lasers were well correlated with the conventional spectra of Cyt , at least in the spectral range of to 550 nm (not shown).66 Also, the use of new high-resolution PT thermolens imaging51 confirmed good correlation of local cellular structure profile obtained in parallel with PT and fluorescent techniques with selective labeling of mitochondria and Cyt (not shown). This finding is also in line with data from other researchers obtained with the time-consuming laser-scanning mode.25 Thus, because PT assay is very sensitive to cellular Cyt distribution located mainly in mitochondria on the one hand, and this organelle, with its many biochemical processes, is very sensitive to drug impact, on the other hand, this particular model may be very promising in pharmaceutical and related research. Most likely, the effects observed in our experiments can be explained by the well known slight metabolic change of shape of mitochondria sizes (rounding up and decreased average size) at low concentration, which leads to increased local absorption and hence, an increase in nonlinear PT response (Fig. 7, top), while high concentration of nicotine leads to swelling of mitochondria and apoptotic-related release of Cyt , leading to sharp decrease in local absorption in mitochondria. The final effects explain very well the dramatic fall of PT response at concentration of nicotine around 10 mM and higher, which is correlated with induction of apoptosis confirmed with an independent test (Fig. 7, bottom). The slight sharp increase of nonlinear PT response in the narrow concentration range 1 to 5 mM can be explained by shrinking phenomena during early apoptosis, compared to the more slight increase at lower concentration relating to metabolic activity. For example, the mitochondria in human fibroblasts, which are long and sometimes bifurcated, after treatment with 2-OH-ethyl methacrylate increased metabolism accompanied by motility and modification of mitochondria shape and sizes (e.g., in a particular case, they became shorter and partially spherical).6, 7 This finding is in line with other data showing that mitochondria start as elongated organelles and form sphere-shaped particles after a calcium overload.15 Much of our previous data convinced us that nicotine used in this study at low doses may activate cellular metabolism in different ways (see the Introduction), while high doses of nicotine may lead to increased intracellular calcium levels resulting in cytotoxicity and eventually cell death. All these events are accompanied by a change in cellular morphology, including metabolic shrinking, toxic-related cellular edema, pyknosis, and intracytoplasmic vacuolation.68, 69, 70, 71 Thus, the data that we present may thus serve as evidence confirming our underlying hypothesis that nicotine’s influence on the cellular PT response may be associated with nicotine-induced geometric changes in Cyt nanoclusters in mitochondria during its metabolic and apoptotic shrinking, release of Cyt during apoptosis, and necrotic swelling. 4.3.Comparison of Linear and Nonlinear ModesWe have also found that nonlinear PT responses (i.e., parameter ) were less sensitive to changes in whole-cell size under nicotine impact than to changes in intracellular structures. Indeed, comparison of the data in Fig. 9 and Table 1 show that nicotine-induced changes in internal cellular structure are more profound than that of the change in whole cell size. Furthermore, measurement of the number of nonlinear PT responses seems to be more accurate for monitoring local effects than measurement of the amplitude of linear PT responses (analogous to analog versus digital techniques), or monitoring whole cell sizes. The choice of laser energy in these modes is compromised by high sensitivity to small changes in local absorption and by the dynamic range of the PT response to different nicotine concentrations. The linear mode, which can detect changes in local peak amplitude in PT images, has an advantage in relatively large absorption changes because its dynamic diapason is much bigger ( to ) than in the nonlinear mode (10 to 25), although the best sensitivity to small changes occurs in the nonlinear mode as predicted in our theoretical model (Sec. 2(B)). With that, the maximum amplitude of the negative peak (Fig. 4, bottom) was found to be, on average, at a higher magnitude than the positive linear PT response (Fig. 4, top). Thus, we confirm here previous findings that laser-induced bubble formation, in addition to the laser load test63 and selective cell killing with nanoabsorbers,45, 46, 47, 48, 49 is a useful phenomenon from additional points of view: 1. the use of bubble formation for diagnostic purposes as an indicator of local absorption, and especially its changes under nicotine’s impact; and 2. it significantly increases the sensitivity of the PT assay. 4.4.PT Imaging Features: Potential for 3-D Spectral PT Molecular ImagingAlthough we provide reasons why that in used spectral range, the dominant cellular local absorption is determined by mitochondrial Cyt , identification of all PT-image structures in a broad spectral range (at least visible and near-IR) requires further detailed study. This is completely an unexplored area of research that faces many difficulties such as high complexity of cellular absorbing spectra in visible-spectrum regions consisting of relatively broad absorption spectral bands, relatively low-level absorption in single cells (undetectable with conventional optical technique), and nanoscale size of absorbing proteins. We hope that the use of the nanocluster model of PT assay will help to understand most observing phenomena, and high sensitivity differential parameters to spatial reorganization of nanocluster structure should open the way to get information of their spectral, and especially spatial,51 properties by providing controllable impact with known action on cellular proteins with the chromophore group. The far-field (i.e., diffraction-limited) PT microscope/spectrometer has potential also for PT molecular imaging with 3-D resolution using confocal schematics.72 In current research, the PT image represents a 2- D depth-integrated laser-induced temperature distribution in the irradiated cell, which correlates with the spatial profile of a cellular absorbing structure. This profile can be detected with high sensitive PT assay only (Fig. 3), because conventional transmission (absorption) imaging, as demonstrated in Fig. 9, middle row, does not provide adequate information due to its low absorption sensitivity. Comparison of PT (Fig. 3) and phase contrast images (Fig. 9, bottom row) shows some similarity (PT image contrast a little better), however, the nature of these images is completely different. PT images provide cellular absorption contrast [transformed by the pump laser pulse into refractive contrast, Eq. 4] related to the spatial distribution of Cyt , while phase-contrast imaging depends on natural refractive intracellular heterogeneities, in particular, related to mitochondrial refractive structure.15 Because Cyt is located mainly in mitochondria, both imagings provide some similar structure. However, phase contrast is not wavelength dependent and does not provide molecular imaging, while spectrally selective PT imaging has potential to provide such imaging. The fluorescent imaging (Fig. 9, top row) demonstrated some nicotine-induced modification in cellular structure related to mitochondria redistribution, although it required labeling, while PT imaging provided similar information without any labeling. 4.5.Universal Character of PT AssayBecause spatial reorganization of cellular structures, including shrinking or swelling of different organelles, are very common phenomena accompanied with many cellular processes (e.g., cell division, cell differentiation, apoptosis, phagocytosis, necrosis, or drug-cell interaction),1, 2, 3, 4, 39, 40, 41, 42, 43, 44 it seems that PT assay, with its high sensitivity to these effects, after proper verification and calibration may become a universal assay applicable to various biological tasks. Indeed, shrinkage seems to be a universal phenomenon induced by different factors, including various cancer chemotherapeutic agents at low doses, decreased oxygen concentration, hypoxic stress, low-dose ionizing radiation, or change in osmolarity. For example, hypertonicity leads to cell shrinkage due to the release of water from cells. On the contrary, in the severe stage of apoptosis, or especially during cell death through necrosis after a variety of acute lethal injuries, most of these effects were accompanied from cell shrinking to generalized swelling effects, which results in corresponding spatial modifications in cell shape and organelles. In particular, one of the earliest ultrastructural changes is enlargement of the volume of the endoplasmic reticulum and dilation of the cisternae.39, 40 These changes are usually correlated with increased water content, the same as in hypotonic conditions. Likewise, swelling phenomena could be the result of increased accumulation of sodium, with water being passively transported into cells. During this stage, necrosis triggers the release of lysosomal enzymes into the cytoplasm, similar to the release of Cyt from mitochondria during apoptosis.42 Thus, PT assay can detect and identify different cellular events, for example, apoptotic effects through dramatic specific changes of PT response (Figs. 3, 4).67 The nanoscluster model described was successfully verified also with nanoclusters created by 2- to 260-nm gold nanoparticles attached selectively to cancer cell membranes with primary and secondary antibodies.46 In particular, we demonstrated that creating 100- to 200–nm nanoclusters using 40-nm solid spherical gold particles allow through plasmon-plasmon effects, and spatial overlapping thermal and bubble formation phenomena synergistically increase efficiency (at least 2 orders of magnitude) of selective nanophotothermolysis of cancer cells, including red shifting of maximum absorption of nanoclusters to near-IR window transparency of biological tissues compared to maximum absorption of single particles in visible range.47, 48, 49 As we have recently demonstrated, PT speed analysis can be easily increased to in flow cytometry mode with potential to achieve to .72, 73, 74, 75 5.ConclusionWe demonstrate the capability of the PT technique to detect, with an extremely high degree of sensitivity, the impact of nicotine at the single-cell level at a concentration threshold of 1 nM. Acquisition time for this process is approximately 3 to 5 min, with no need for laser scanning, conventional staining, or fluorescence labeling. The specific PT-response behavior at different nicotine concentrations is associated with different nicotine-induced functional and morphologic changes in cells, such as altered metabolism, apoptosis, and necrosis-related effects. Because the average nicotine concentration in the blood of light (or passive) smokers ranges from 5 to (25 to 75 nM), the new PT assay offers the opportunity to study nicotine’s influence at extremely low concentrations, potentially in vivo, at least on an animal model,72, 73, 74, 75 of which current analytical techniques are inadequate. Despite the promising data obtained, additional research is required to evaluate the capability of the PT assay to perform quantitative studies with a further focus on mechanisms of action and identification of other types of absorbing nanoclusters (besides Cyt ) that are sensitive to nicotine impact. We hope that, after additional verification, this nanocluster model of PT assay may serve as the basis for developing a throughput automated screening system that is low cost, rapid (minutes), and robust, has a large dynamic range (e.g., nicotine concentrations ranging from 1 nM to 10 mM), and is informative (several diagnostic parameters). Other uses for the PT assay may include the quantitative study of drug cytotoxicity, fast screening of apoptotic effects, and chemosensitivity tests in general, including study of the efficiency of combined treatment or of the potential influence of nicotine on the efficacy of chemo- and radiotherapy for cancer.30, 50 AcknowledgmentsThis work was supported by a grant from the National Cancer Institute (CA097422), by the Arkansas Bioscience Institute, and, in part, by a grant from the National Science Foundation (BES0119470) and from the National Institute of Biomedical Imaging and Bioengineering (R01 EB 000873). (Zharov is the principal investigator in both grants.) The authors thank Dmitri O. Lapotko for his help with the development of the first PT microscope prototype, which was modified for current work. We thank Scott Ferguson for his assistance with laser measurements, Mark Viegas for help with cells size measurement, the Office of Grants and Scientific Publications at the University of Arkansas for Medical Sciences, and Donna Williams for editorial assistance during the preparation of this manuscript. ReferencesC. D. Klaassen,
“The basic science of poisons,”
Toxicology, 5th ed.McGraw-Hill, New York (1996). Google Scholar
K. Horakova,
“The use of cell culture systems for the assessment of general cellular toxicity and to detect the nature and location of free radical damage,”
Gen. Physiol. Biophys., 12 63
–69
(1999). 0231-5882 Google Scholar
J. M. Frazier,
“In vitro models for toxicological research and testing,”
Toxicol. Lett., 68 73
–90
(1993). https://doi.org/10.1016/0378-4274(93)90121-D 0378-4274 Google Scholar
S. R.T. Farr and
I. I. Dunn,
“Concise review: gene expression applied to toxicology,”
Toxicol. Sci., 50 1
–9
(1999). https://doi.org/10.1093/toxsci/50.1.1 1096-6080 Google Scholar
I. Szundi,
G. L Liao, and
O. Einarsdottir,
“Near-infrared time-resolved optical absorption studies of the reaction of fully reduced cytochrome c oxidase with dioxygen,”
Biochemistry, 40 2332
–2339
(2001). https://doi.org/10.1021/bi002220v 0006-2960 Google Scholar
D. G. Weiss,
“Videomicroscopic measurements in living cells: dynamic determination of multiple end points for in vitro toxicology,”
Mol. Toxicol., 1 465
–488
(1987). https://doi.org/10.1016/S1568-1637(02)00012-0 0883-9492 Google Scholar
W. Maile,
T. Lindl, and
D. G. Weiss,
“New methods for cytotoxicity testing: quantitative video microscopy of intracellular motion and mitochondria-specific fluorescence,”
Mol. Toxicol., 1 427
–437
(1987). https://doi.org/10.1016/S1567-1739(01)00050-5 0883-9492 Google Scholar
J. Slavik, Fluorescence Microscopy and Fluorescent Probes, Plenum Press, New York (1996). Google Scholar
J. D. Rabinowitz,
J. F. Vacchino,
C. Beeson, and
H. M. McConnell,
“Potentiometric measurement of intracellular redox activity,”
J. Am. Chem. Soc., 120 2464
–2473
(1998). 0002-7863 Google Scholar
H. Schneckenburger,
M. H. Gschwend,
R. Sailer,
W. S. Strauss,
M. Lyttek, and
K. Stock,
“Time-resolved in situ measurement of mitochondrial malfunction by energy transfer spectroscopy,”
J. Biomed. Opt., 5 362
–366
(2000). https://doi.org/10.1117/1.1289358 1083-3668 Google Scholar
P. L Johnson,
W. Smith, and
S. B. Knisley,
“Errors caused by combination of Di-4 ANEPPS and Fluo for measurements of transmembrane potentials and intracellular calcium,”
Ann. Biomed. Eng., 27
(4), 563
–571
(1999). https://doi.org/10.1114/1.198 0090-6964 Google Scholar
A. M. Blackwood,
G. A. Sagnella,
N. D. Markandu, and
G. A. MacGregor,
“Problems associated with using Fura-2 to measure free intracellular calcium concentrations in human red blood cells,”
J. Hum. Hypertens., 11 601
–604
(1997). 0950-9240 Google Scholar
J. B. Pawley, Handbook of Biological Confocal Microscopy, 2nd ed.Plenum Press, New York (1995). Google Scholar
N. Uzunbajakava,
A. Lenferrink,
Y. Kraan,
G. Vremsen,
J. Greve, and
C. Otto,
“Nonresonant confocal raman imaging of DNA and protein distribution in apoptotic cells,”
Biophys. J., 84 3968
–3981
(2003). 0006-3495 Google Scholar
N. N. Boustany,
R Drezek, and
N. V. Thakor,
“Calcium-induced alteration in mitochondrial morphology quantified in situ with optical scatter imaging,”
Biophys. J., 83
(3), 1691
–1700
(2002). 0006-3495 Google Scholar
V. P. Zharov and
V. S. Letokhov, Laser Optoacoustic Spectroscopy, Springer-Verlag, Berlin (1986). Google Scholar
T. Kitamori,
M. Uchida,
A. Egami,
K. Sekiguchi,
J. Zheng,
T. Sawada,
M. Tokeshi,
K. Sato, and
H. Kimura,
“Subsingle-molecule determination of nonfluorescent species by scanning thermal lens microscope and its application to single-cell measurement,”
Proc. SPIE, 3922 67
–72
(2000). 0277-786X Google Scholar
D. Lapotko,
G. Kuchinsky,
M. Potapnev, and
D. Pechkovsky,
“Photothermal image cytometry of human neutrophils,”
Cytometry, 24 198
–203
(1996). https://doi.org/10.1002/(SICI)1097-0320(19960701)24:3<198::AID-CYTO2>3.0.CO;2-E 0196-4763 Google Scholar
H. Kimura,
K. Sekiguchi,
F. Nagao,
M. Mukaida,
T. Kitamori, and
T. Sawada,
“Imaging of blood antigen distribution on blood cells by thermal lens microscopy,”
Proc. SPIE, 3916 278
–284
(2000). 0277-786X Google Scholar
D. O. Lapotko,
T. R. Romanovskaya,
A. Shnip, and
V. P. Zharov,
“Photothermal time-resolved imaging of living cells,”
Lasers Surg. Med., 31 53
–63
(2002). https://doi.org/10.1002/lsm.10068 0196-8092 Google Scholar
D. Lapotko,
T. Romanovskaya,
G. Kutchinsky, and
V. Zharov,
“Photothermal studies of modulating effect of photoactivated chlorin on interaction of blood cells with bacteria,”
Cytometry, 37 320
–326
(1999). https://doi.org/10.1002/(SICI)1097-0320(19991201)37:4<320::AID-CYTO10>3.0.CO;2-U 0196-4763 Google Scholar
D. Lapotko and
T. Romanovskaya,
“Pharmaceutical application of photothermal cytometry,”
Proc. SPIE, 3926 228
–238
(2000). 0277-786X Google Scholar
D. Lapotko,
T. Romanovskaya, and
V. Zharov,
“Photothermal images of live cells in presence of drug,”
J. Biomed. Opt., 7 425
–434
(2002). https://doi.org/10.1117/1.1481902 1083-3668 Google Scholar
V. P. Zharov,
D. Lapotko, and
T. Romanovskaya,
“Photothermal lifetime imaging of cell-drug interactions,”
Proc. SPIE, 4623 384
–395
(2002). 0277-786X Google Scholar
E. Tamaki,
K. Sato,
M. Tokeshi,
K. Sato,
M. Aihara, and
T. Kitamori,
“Single-cell analysis via scanning thermal lens microscope with a microchip: direct monitoring of cytochrome c distribution during apoptosis process,”
Anal. Chem., 74 1560
–1564
(2002). 0003-2700 Google Scholar
V. P. Zharov,
V. Galitovsky, and
P. Chowdhury,
“Detection of the effect of nicotine on pancreatic acinar cells with a photothermal assay,”
60
–61
(2003). Google Scholar
V. P. Zharov and
D. O. Lapotko,
“Photothermal microscopy of nanoobjects,”
Proc. SPIE, 4960 455
–463
(2003). 0277-786X Google Scholar
V. P. Zharov,
D. O. Lapotko, and
V. Galitovsky,
“Photothermal study of laser-induced apoptosis and necrosis with endogenous and exogenous nano-absorbers,”
Lasers Surg. Med. Suppl., 16 12
–13
(2004). 1050-9267 Google Scholar
V. Galitovskiy,
P. Chowdhury, and
V. P Zharov,
“Photothermal detection of drug-induced apoptotic effects in a cancer cells,”
Life Sci., 75 2677
–2687
(2004). 0024-3205 Google Scholar
V. P. Zharov,
V. Galitovsky,
P. Chowdhury, and
T. Chambers,
“Photothermal evaluation of the influence of nicotine, antitumor drugs, and -radiation on cellular absorbing structures,”
Proc. SPIE, 5329 35
–144
(2004). 0277-786X Google Scholar
N. S. Miller,
“Nicotine addiction as a disease,”
The Clinical Management of Nicotine Dependence, 66
–78 Springer-Verlag, New York (1991). Google Scholar
N. Sugano and
K. Ito,
“Nicotine switches the form of H(2)O(2)-induced cell death from apoptosis to necrosis in U937 cells,”
Immunol. Lett., 72
(3), 163
–166
(2000). 0165-2478 Google Scholar
N. Sugano,
T. Minegishi,
K. Kawamoto, and
K. Ito,
“Nicotine inhibits UV-induced activation of the apoptotic pathway,”
Toxicol. Lett., 125
(1-3), 61
–65
(2001). 0378-4274 Google Scholar
N. Onoda,
A. Nehmi,
D. Weiner,
S. Mujumdar,
R. Christen, and
G. Los,
“The nicotine affects the signaling of the death pathway, reducing the response of head and neck cancer cell lines to DNA damaging agents,”
Head Neck, 23 860
–870
(2001). https://doi.org/10.1097/00003246-199505000-00014 1043-3074 Google Scholar
V. S. Letokhov,
“Effects of transient local heating of spatially and spectrally heterogeneous biotissue by short laser pulses,”
Nuovo Cimento Soc. Ital. Fis., D, 13 939
–948
(1991). 0392-6737 Google Scholar
T. Karu,
“Primary and secondary mechanisms of action of visible to near-IR radiation on cells,”
J. Photochem. Photobiol., B, 49
(1), 1
–17
(1999). https://doi.org/10.1016/S1011-1344(98)00219-X 1011-1344 Google Scholar
D. Lapotko,
T. Romanovskaya, and
E. Gordiyko,
“Photothermal monitoring of redox state of respiratory chain in single live cells,”
Photochem. Photobiol., 75
(5), 519
–526
(2002). https://doi.org/10.1562/0031-8655(2002)075<0519:PMORSO>2.0.CO;2 0031-8655 Google Scholar
S. E. Braslavsky,
“Photoacoustic and photothermal methods applied to the study of radiationless deactivation processes in biological systems,”
Photochem. Photobiol., 43 667
–675
(1986). 0031-8655 Google Scholar
B. F. Trump,
I. K. Beresesky, and
A. R. Osornio-Vargas,
“Cell death and the disease process. The role of calcium,”
Cell Death Biol. Pathol., 25 209
–242
(1981). Google Scholar
A. H. Wyllie,
“The biology of cell death in tumor,”
Anticancer Res., 5 131
–136
(1985). 0250-7005 Google Scholar
A Lawen,
“Apoptosis: an introduction,”
BioEssays, 25 888
–896
(2003). 0265-9247 Google Scholar
C. M. Luetjens,
D Kogel,
C. Reimertz,
H. Dubmann,
A. Renz,
K. Schulze-Osthoff,
A. L Nieminen,
M. Poppe, and
J. H. M Prehn,
“Multiple kinetics of mitochondrial cytochrome c release in drug-induced apoptosis,”
Mol. Pharmacol., 60
(5), 1008
–1019
(2001). 0026-895X Google Scholar
S. P. Yu and
D. W. Choi,
“Ions, cell volume, and apoptosis,”
Proc. Natl. Acad. Sci. U.S.A., 97
(17), 9360
–9362
(2000). 0027-8424 Google Scholar
F. Lang,
E. Gulbins,
I. Szabo,
A. Lepple-Wienhues,
S. M. Huber,
C. Duranton,
K. S. Lang,
P. A. Lang, and
T. Wieder,
“Cell volume and the regulation of apoptotic cell death,”
J. Mol. Recognit., 17
(5), 473
–480
(2004). 0952-3499 Google Scholar
V. Zharov,
V. Galitovsky, and
M. Viegas,
“Photothermal detection of local thermal effects during selective nanophotothermolysis,”
Appl. Phys. Lett., 83
(24), 4897
–4899
(2003). https://doi.org/10.1063/1.1632546 0003-6951 Google Scholar
V. P. Zharov,
V. Galitovskaya, and
M. Viegas,
“Photothermal guidance of selective photothermolysis with nanoparticles,”
Proc. SPIE, 5319 291
–300
(2004). 0277-786X Google Scholar
V. P. Zharov,
R. R. Letfullin, and
E. N. Galitovskaya,
“Microbubbles-overlapping mode for laser killing of cancer cells with absorbing nanoparticle clusters,”
J. Phys. D, 38
(15), 2571
–2581
(2005). https://doi.org/10.1088/0022-3727/38/15/007 0022-3727 Google Scholar
V. P. Zharov,
R. R. Letfullin, and
E. N. Galitovskaya,
“Laser-induced synergistic effects around absorbing nanoclusters in live cells,”
Proc. SPIE, 5695 43
–50
(2005). 0277-786X Google Scholar
V P. Zharov,
R. R. Letfullin, and
E. N. Galitovskaya,
“Enhanced selective laser killing cancer cells with aggregated nanoclusters,”
Lasers Surg. Med. Suppl., 17 11
(2005). https://doi.org/10.2108/zsj.17.11 1050-9267 Google Scholar
V. P. Zharov,
M. Viegas, and
L. Soderberg,
“Biological detection of low radiation doses with integrated photothermal assay,”
Proc. SPIE, 5697 271
–281
(2005). 0277-786X Google Scholar
V. Zharov,
“Far-field photothermal microscopy beyond the diffraction limit,”
Opt. Lett., 28 1314
–1316
(2003). 0146-9592 Google Scholar
R. R. Anderson and
J. A. Parrish,
“Selective photothermolysis: precise microsurgery by selective absorption of pulsed radiation,”
Science, 220 524
–527
(1983). 0036-8075 Google Scholar
B. S. Gerstman,
C. R. Thompson,
S. L. Jaques, and
M. E. Roger,
“Laser induced bubble formation in the retina,”
Lasers Surg. Med., 18 10
–21
(1996). https://doi.org/10.1002/(SICI)1096-9101(1996)18:1<10::AID-LSM2>3.0.CO;2-U 0196-8092 Google Scholar
A. Vogel,
P. Schweiger,
A. Frieser,
M. N. Asiyo, and
R. Birngruber,
“Intraocular Nd:YAG laser surgery: laser-tissue interaction, damage range, and reduction of collateral effects,”
IEEE J. Quantum Electron., 20 2240
–2260
(1990). 0018-9197 Google Scholar
S. L. Jacques and
D. J. McAuliffe,
“The melanosome: threshold temperature for explosive vaporization and internal absorption coefficient during pulsed laser irradiation,”
Photochem. Photobiol., 53 769
–775
(1991). 0031-8655 Google Scholar
C. P. Lin and
M. W. Kelly,
“Cavitation and acoustic emission around laser-heated microparticles,”
Appl. Phys. Lett., 72 2800
–2802
(1998). https://doi.org/10.1063/1.121462 0003-6951 Google Scholar
C. P. Lin,
M. W. Kelly,
S. A. Sibayan,
M. A. Latina, and
R. R. Anderson,
“Selective cell killing by microparticle absorption of pulsed laser radiation,”
IEEE J. Sel. Top. Quantum Electron., 5 963
–968
(1999). https://doi.org/10.1109/2944.796318 1077-260X Google Scholar
D. Leszczynski,
C. M. Pitsillides,
R. K. Pastila,
R. R. Anderson, and
C. P. Lin. “Laser-beam-triggered microcavitation: a novel method for selective cell destruction, Radiat. Res., 156 399
–407
(2001). 0033-7587 Google Scholar
C. M. Pitsillides,
E. K. Joe,
X. Wei,
R. R. Anderson, and
C. P. Lin,
“Selective cell targeting with light-absorbing microparticles and nanoparticles,”
Biophys. J., 84 4023
–4032
(2003). 0006-3495 Google Scholar
J. Neumann and
R. Brinkmann,
“Microbubble dynamic around laser heated microparticles,”
Proc. SPIE, 5142 82
–87
(2003). 0277-786X Google Scholar
J. Roegener,
R. Brinkmann, and
C. P. Lin,
“Pump-probe detection of laser-induced microbubble formation in retinal pigment epithelium cells,”
J. Biomed. Opt., 9 367
–371
(2004). https://doi.org/10.1117/1.1646413 1083-3668 Google Scholar
J. A. Williams,
M. Korc, and
R. L. Dormer,
“Action of secretagogues on a new preparation of functionally intact isolated pancreatic acini,”
Am. J. Physiol., 235 E517
–E524
(1978). 0002-9513 Google Scholar
D. Lapotko,
G. Kuchinsky,
H. Antonishina, and
H. Scoromnik,
“Laser viability method for red blood cells state monitoring,”
Proc. SPIE, 2628 340
–348
(1996). 0277-786X Google Scholar
D. O. Lapotko and
V. P. Zharov,
“Spectral evaluation of laser-induced cell damage with photothermal microscopy,”
Lasers Surg. Med., 36 22
–31
(2005). https://doi.org/10.1002/lsm.20119 0196-8092 Google Scholar
Iron in Biochemistry and Medicine, 221
–436 Academic Press, New York (1974). Google Scholar
V. P. Zharov and
D. O. Lapotko,
“Photothermal imaging of nanoparticles,”
IEEE J. Sel. Top. Quantum Electron.,
(1077-260X) Google Scholar
D. O. Lapotko,
“Monitoring of apoptosis in intact single cells with photothermal microscope,”
Cytometry, 58 111
–119
(2004). 0196-4763 Google Scholar
P. Chowdhury,
R. Hosotani,
L. W. Chang, and
P. L. Rayford,
“Metabolic and pathologic effects of nicotine on the gastrointestinal tract and pancreas of rats,”
Pancreas, 5 222
–229
(1990). 0885-3177 Google Scholar
P. Chowdhury,
P. L. Rayford, and
L. W. Chang,
“Induction of pancreatic acinar cell pathology via inhalation of nicotine,”
Proc. Soc. Exp. Biol. Med., 20 159
–164
(1992). 0037-9727 Google Scholar
P. Chowdhury and
P. L. Rayford,
“Smoking and pancreatic disorders,”
Eur. J. Gastroenterol. Hepatol, 12 869
–877
(2000). 0954-691X Google Scholar
P. Chowdhury,
S. MacLeod,
B. Udupa, and
P. L. Rayford,
“Pathophysiological effects of nicotine on pancreas: an update,”
Exp. Biol. Med., 227 445
–454
(2002). 0071-3384 Google Scholar
V. P. Zharov,
E. I. Galanzha,
S. Ferguson, and
V. Tuchin,
“Confocal photothermal flow cytometry in vivo,”
Proc. SPIE, 5697 15
–26
(2005). 0277-786X Google Scholar
V. Zharov,
E. Galanzha, and
V. Tuchin,
“Photothermal imaging of moving cells in lymph and blood flow in vivo animal model,”
Proc. SPIE, 5320 256
–263
(2004). 0277-786X Google Scholar
V. P. Zharov,
E. I. Galanzha, and
V. V. Tuchin,
“Photothermal image flow cytometry in vivo,”
Opt. Lett., 30
(6), 628
–630
(2005). https://doi.org/10.1364/OL.30.000628 0146-9592 Google Scholar
V. P. Zharov,
E. I. Galanzha, and
V. V. Tuchin,
“Integrated photothermal flow cytometry in vivo,”
J. Biomed. Opt.,
(1083-3668) Google Scholar
|


