|
|
1.IntroductionFluorescence and diffuse reflectance spectroscopy in the ultraviolet-visible (UV-VIS) spectrum, are increasingly being investigated for breast cancer diagnosis. 1, 2, 3, 4, 5, 6, 7, 8, 9, 10, 11, 12, 13, 14, 15 This technology is cost-effective, and can be deployed through fiber optic probes to quickly, nondestructively, and quantitatively detect the structural, physiological, and biochemical changes that are associated with the progression of disease. Several studies have demonstrated that there are significant differences in the fluorescence 1, 2, 3, 5, 7, 9, 11 and diffuse reflectance 4, 13, 14, 15, 16, 17 spectra of normal, benign, and malignant breast tissues, which could be used for the diagnosis of breast malignancy. In most previous studies, fluorescence 1, 2, 3, 5, 7, 9, 11 and/or diffuse reflectance spectra 1, 4, 5, 8, 13, 15 of breast tissues were analyzed using empirical methods, in which the spectral intensities and/or line shapes were examined to extract spectral patterns (such as intensities, ratio of intensities, or principal components) that consistently discriminate between malignant and nonmalignant tissues. For example, in one of the first reported studies, Alfano 11 used the ratio of fluorescence intensities at 340 and , excited at , to distinguish malignant from normal breast tissues. While several studies 1, 2, 3, 4, 7, 11, 13 examined the spectral intensities, there are other studies where spectral line shapes were explored for breast cancer diagnosis. For example, Palmer 5 employed principal component analysis (PCA) to extract a set of principal components that dramatically reduced the spectral data dimension with minimal information loss, and showed that a subset of principal components obtained from diffuse reflectance spectra and fluorescence spectra at excitation wavelengths of 300, 400, 420, and displayed the statistically most significant differences between malignant and non-malignant breast tissues. The preceding collection of studies examined spectral intensities or line shapes of turbid tissue fluorescence and/or diffuse reflectance spectra. Although empirical analyses can reveal important spectroscopic features for tissue characterization and disease diagnosis, they do not relate the measured spectra directly to the physically meaningful information that are contained in the spectra. The diffuse reflectance spectrum reflects the absorption and scattering properties of the tissue. The absorption coefficient is directly related to the concentration of physiologically relevant absorbers in the tissue such as oxygenated and deoxygenated hemoglobin. The scattering coefficient reflects the size and density of scattering centers in tissue, such as cells and nuclei. The fluorescence spectrum contains biochemical information about a number of molecules that are relevant to the structural properties of tissues or respiratory metabolism of cells. However, there are distortions in the fluorescence spectra due to the interplay of tissue absorption and scattering, which makes it difficult to interpret the biochemically relevant information contained in the fluorescence. Extracting and quantitatively assessing the intrinsic and physically meaningful information from the fluorescence and diffuse reflectance measurements will provide insight into the biochemical, physiological and morphological changes that take place during the progression of disease. Several studies have been reported in which the absorption and scattering properties were quantified from diffuse reflectance spectra to characterize breast tissues. Ghosh 16 used a model based on the standard diffusion approximation to extract the absorption and scattering coefficients from spatially resolved diffuse reflectance measurements of human breast tissue samples. They showed that malignant tissues had increased absorption and scattering relative to nonmalignant breast tissues. However, they did not report the classification accuracy for diagnosing breast cancer based on the parameters extracted from the model. More recently our group, in two independent studies17, 18 applied a Monte-Carlo-based inverse model for the extraction of absorption and scattering properties from the diffuse reflectance spectra of malignant and nonmalignant breast tissues. Both studies showed that malignant tissues have decreased hemoglobin saturation and increased mean reduced scattering coefficients compared to nonmalignant tissues. Classification based on machine learning using these absorption and scattering properties as inputs achieved an unbiased sensitivity and specificity of 82 and 92%, respectively, in the study by Palmer, 18 and 86 and 80%, respectively, in the study by Zhu 17, for discriminating between malignant and nonmalignant breast tissues. For fluorescence, a number of studies 19, 20, 21, 22, 23, 24, 25 have been carried out to disentangle the effects of absorption and scattering from the measured fluorescence spectrum to recover the intrinsic fluorescence of the tissue. The intrinsic fluorescence is due only to fluorophores present in the medium, from which fluorophore concentrations can be extracted using simple analytical models. A majority of these studies used analytical methods to derive mathematical expressions for the intrinsic fluorescence, from which the intrinsic fluorescence spectrum can be calculated. 20, 21, 22, 24, 25 These methods are based on the diffusion equation and thus are valid for a limited range of absorption and scattering, not flexible in their applicability to various probe geometries or require extensive empirical calibration. Biswal 23 proposed a method that was based on simultaneous measurements of polarized fluorescence and polarized elastic scattering spectra, and turbidity-free fluorescence was obtained by normalizing the polarized fluorescence spectrum by the polarized elastic scattering spectrum. Our group19 developed a fluorescence model based on scalable Monte Carlo simulations, which is capable of extracting the intrinsic fluorescence spectra of a turbid medium, and is applicable for a wide range of optical properties and, in principle, any illumination-collection geometry. The details of the model and its validation in synthetic phantoms are described in the preceding companion manuscript.26 This paper uses the model to recover the intrinsic fluorescence of human breast tissues and to extract the relative fluorescence contribution of individual fluorescing components present in malignant and nonmalignant breast tissues. The specific goals of this study were to (1) apply Monte-Carlo-model-based approaches developed by our group for the analysis of both fluorescence and diffuse reflectance spectra to extract the intrinsic fluorescence, absorption, and scattering properties of breast tissues and (2) test the diagnostic value of these intrinsic tissue properties for discriminating malignant from nonmalignant breast tissues. This work is distinct from previous publications by our group5, 17, 18 in that first, it reports on the application of a new fluorescence model to recover the intrinsic fluorescence and then extract the contributions of individual fluorescing components that may relate to intrinsic fluorophores in the breast; second, it compares the merits of the extracted fluorescence properties versus the tissue absorption and scattering properties for diagnosing breast cancer; and finally, it demonstrates the consistency of our model-based approach for the analysis of diagnostically useful information contained in fluorescence and diffuse reflectance spectra measured with two different instruments and probe geometries. 2.Methods2.1.Sample CollectionThree sets of breast tissue samples were obtained from patients undergoing either breast cancer surgery (lumpectomy or mastectomy) or breast reduction surgery in two independent breast studies; both were approved by the Institutional Review Board at the University of Wisconsin, Madison. The two studies followed similar protocols for tissue handling and spectral measurements. In both studies, fluorescence and diffuse reflectance spectra were measured from freshly excised breast tissue samples immediately after excision. For tissue specimens obtained from cancer surgery, optical measurements were made at a cancerous site and a remote normal tissue site, and for tissue specimens obtained from breast reduction surgery, optical measurements were attempted at a fibroglandular site and an adipose site. The tissue measurement and the handling protocol for the first breast study were described in detail elsewhere,1, 17 and that for the second breast study can also be found in an earlier publication.5 Accompanying histological diagnoses were obtained for each tissue specimen from microscopic evaluation of hematoxylin and eosin (H&E) sections within a depth of from the probe-tissue contact surface (marked by an ink spot). The breast tissue specimens were broadly categorized as malignant, benign, fibrous, and adipose. When malignancy presented anywhere within the depth of histological evaluation, the sample diagnosis was designated as being malignant. If a benign or normal sample exhibited heterogeneous tissue composition, the sample histology was designated to be the predominant tissue type immediately below the tissue surface where the optic probe was placed. In addition, the percent adipose, fibroconnective, and percent glandular tissue content within the region of interest (i.e., the depth in the histological section) was quantified in all breast reduction surgery samples. In the first study,17 fluorescence and diffuse reflectance spectroscopy was performed on 18 breast reduction patients and 45 cancer patients. According to the type of surgery, tissue samples were divided into two sets: the first set (set 1) contained only normal samples from healthy women undergoing breast reduction surgery, and the second (set 2) contained both cancerous and normal samples from cancer patients. A total of 64 normal samples were collected from the 18 breast reduction patients, however, 3 samples had to be excluded due to saturation in the spectral measurements, resulting in a total of 61 samples including 22 fibroglandular and 39 adipose samples in set 1. A total of 96 breast samples were collected from the 45 cancer patients, among which 13 samples had to be excluded from further analysis, due to either saturation of the measured spectra or due to the visible presence of lymphazurin on the measurement site. Thus, a total of 83 tissue samples, including 37 malignant, 2 benign, 6 fibrous, and 38 adipose samples were included in set 2 for further analysis. In the second study,5 a total of 56 tissue samples were obtained from 32 cancer or breast reduction patients, however, 15 samples had to be excluded because they were measured with a demo instrument and the calibration information needed for the model analysis was not available. Thus, a total of 41 samples obtained in the second breast study, including 17 malignant, 4 benign, 6 fibrous, and 14 adipose breast tissues, were included in set 3. Set 1 was used to carry out a correlation analysis between the tissue properties extracted from the model-based approach and histological parameters including percent adipose, fibroconnective, and glandular content in normal breast tissues from healthy women. Sets 2 and 3 were used in the discrimination analysis for the purpose of diagnosing breast cancer. Combining sets 2 and 3 yielded a sample size of 54 malignant, 6 benign, 12 fibrous, and 52 adipose tissues. Table 1 displays the histological break down of the breast tissue samples in this study. Table 1Histological break down of the breast tissue samples examined in this study.
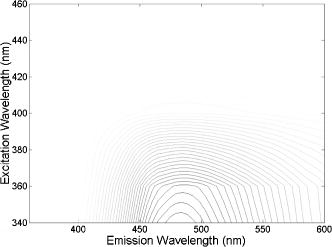
2.2.Fluorescence and Diffuse Reflectance MeasurementsIn the two breast studies, different spectrometers and probe geometries were used for spectral measurements, both of which were described in our earlier publications.1, 5, 17 In the first breast study (corresponds to sets 1 and 2), fluorescence and diffuse reflectance spectra were measured with a multiwavelength optical spectrometer and the fiber optic probe used consists of a central illumination core and a surrounding collection ring.1, 17 In the second breast study (corresponds to set 3), tissue spectral measurements were made using a Skinskan spectrometer (JY Horiba, Edison, New Jersey) and a fiber optic probe that consists of a central collection core and a surrounding illumination ring.5 The measured fluorescence and diffuse reflectance spectra were calibrated in order to correct for the (1) background spectrum, (2) wavelength dependence, and (3) throughput of the system. A detailed description of instrument settings and calibrations for the fluorescence and diffuse reflectance measurements can be found in earlier publications.1, 5, 17 In both breast studies, fluorescence measurements covered excitation wavelengths of 300 to in increments, and emission wavelengths from beyond each excitation wavelength up to in increments of . Diffuse reflectance measurements covered the wavelength range of 350 to . Therefore, spectral analyses were carried out on the three sets of tissue spectra over these common wavelength ranges. 2.3.Extraction of Tissue Optical PropertiesA scalable Monte Carlo inverse model of diffuse reflectance was used to extract the tissue optical properties. Details about the Monte-Carlo-based inverse model of diffuse reflectance can be found in previous publications.17, 18, 27 The accuracy of the inverse model was verified using experimental tissue phantom studies. The results indicated that for phantoms with a wide range of absorption coefficients (0 to ) and reduced scattering coefficients (7 to ), optical properties could be extracted within an average error of 3% for phantoms containing hemoglobin and within 12% for phantoms containing nigrosin.27 The diffuse reflectance spectra were fit to the Monte Carlo model in the wavelength range of 350 to . The primary intrinsic absorbers in the model over this wavelength range were assumed to be oxygenated and deoxygenated hemoglobin and beta-carotene. Lymphazurin (Catalog no. 00592358, Tyco Healthcare, Mansfield, Massachusetts), a dye used to locate the sentinel lymph node during surgery, was included as an extrinsic absorber since it was found to be present in some of the tissue samples. A Gaussian function with a mean of and a standard deviation of was included as an additional absorbing component to account for a deviation in the fit between 500 and , which was found in a large number of tissue samples. In addition, a baseline tissue absorption coefficient, describing protein absorption in the absence of blood28 was added to the absorption coefficient calculated from the concentrations of the chromophores already mentioned. This baseline absorption is given by where is the absorption as a function of wavelength, and is the magnitude of the baseline absorption. The concentrations of each absorber and the magnitude of the baseline absorption described in Eq. 1 were the free parameters related to absorption in the fit, which were extracted from the inversion process.Note that for the first two data sets (sets 1 and 2), NADH was also included in the model as an absorber for the calculation of absorption coefficient, while this was not done for set 3. This discrepancy was due to the difference in model selection by individual researchers, and this was the only difference in the model parameters for fitting the diffuse reflectance spectra of sets 1 and 2 and set 3. However, the absorption due to NADH alone was found to account for only 0 to 3% on average of the total absorption across the wavelength range of 350 to , with a mean of 0.4% and a standard deviation of 2%. This indicated that NADH did not contribute significantly to the absorption in this wavelength range, and the absorption and scattering properties obtained from the three sets of tissue spectra are still comparable. The absorption properties yielded from the model and used in further data analysis then include -carotene concentration, total hemoglobin concentration, and hemoglobin saturation, and the latter two were calculated directly from the concentrations of oxygenated and deoxygenated hemoglobin. For scattering, the refractive indices of the scatterers and the surrounding medium were fixed parameters and were assumed29 to be 1.4 and 1.36, respectively. The scatterer size and density were the free parameters in the model related to scattering, and the scatterer size was constrained to be between 0.35 and in diameter.30 The wavelength-dependent scattering coefficient and anisotropy factor were calculated from scatterer size, density, and the refractive index mismatch between the scatterer and surrounding medium using the Mie theory for spherical particles. The mean reduced scattering coefficient was then calculated from the wavelength-dependent scattering coefficient and anisotropy factor, and used to describe the bulk scattering properties of tissue. Note that the tissue spectra of sets 2 and 3 were measured with different spectrometers and probes, and the spectral intensities were recorded on different scales. To directly compare the results obtained from the two data sets, it is important to remove the system dependency. The Monte Carlo inverse model of diffuse reflectance takes into account the specific probe geometry and incorporates a phantom calibration to account for the difference in system throughput thus allowing for a direct comparison of the absorption and scattering properties extracted from the two data sets.27 2.4.Extraction of Intrinsic Fluorescence SpectraA Monte-Carlo-based model of fluorescence was developed for the extraction of intrinsic fluorescence spectra of turbid tissues and is described in the preceding companion manuscript.19 This model is capable of removing the distorting effects of absorption and scattering and is valid for a wide range of optical properties. Using a phantom study, it was found that this model could recover the intrinsic fluorescence line shape and intensity of the tissue phantoms within an average percent error of less than 10%, as described in the companion manuscript.19 The Monte Carlo model simulates photon propagation (including both incident photons and fluorescence reemission photons) within a turbid medium, given a set of known absorption and scattering coefficients and illumination-collection geometry. In our approach, the set of absorption and scattering coefficients of tissue were derived from the concomitantly measured diffuse reflectance spectrum using the Monte-Carlo-based inverse model of diffuse reflectance, which was described in the previous section. Next, these optical properties were used in the scalable Monte Carlo model of fluorescence to account for the effects of absorption and scattering on the fluorescence emission. In this study, fluorescence spectra within an excitation wavelength range of 340 to and an emission wavelength range of 350 to were processed with the model to retrieve the intrinsic fluorescence, since diffuse reflectance was measured within 350 to and absorption and scattering properties can be determined only for this wavelength range. The absorption and scattering coefficients at were determined using the chromophore concentrations, scatterer size, and scatterer density extracted from the diffuse reflectance spectra within 350 to . Inputs into the fluorescence model include the absorption and scattering coefficients at both the excitation and emission wavelengths. The model then used a scaling technique reported by Graaff 31 to simulate the propagation of photons in a turbid medium with these absorption and scattering properties. A correction curve was generated from the output of the Monte Carlo simulation, which accounts for the effects of absorption and scattering in the medium at both excitation and emission wavelengths, as well as the collection efficiency defined by the specific probe geometry used. This correction curve corresponds to the denominator in Eq. (8) in the companion manuscript.19 The measured tissue fluorescence spectra were then divided point by point by the correction curve to retrieve the intrinsic fluorescence spectra independent of the absorption and scattering properties of tissue and probe geometry. The Monte Carlo model also includes19 a scaling factor , which accounts for the difference in magnitude between the Monte Carlo simulations and the measured result. This factor can be determined by comparing the measured and simulated fluorescence of a reference phantom with known optical properties, and must be known to compare, on an absolute scale, the intrinsic fluorescence measured with the two different instruments and probe geometries. In this study, the intrinsic fluorescence spectra of each tissue sample were normalized to the integrated intensity of the excitation-emission matrix (EEM), thus, the difference in magnitude between the two sets of tissue spectra (sets 2 and 3) and the Monte Carlo simulations are removed, and a direct comparison of the relative (fractional) fluorescence contributions from individual fluorophores is possible. 2.5.Extraction of Relative Fluorescence Contribution from Individual FluorophoresThe intrinsic fluorescence spectrum can be viewed as a linear combination of the fluorescence emission by one or more contributing fluorescent components (fluorophores). A multivariate curve resolution (MCR) method32 was used to decompose the intrinsic tissue fluorescence into several spectral profiles of the contributing components. MCR refers to a group of techniques that intend the recovery of response profiles, e.g., spectra, of the components in an unresolved mixture when no or limited prior information is available about the nature and composition of these mixtures. In this study, three components were assumed to contribute to the tissue fluorescence within excitation wavelength range of 340 to and emission wavelength range of 350 to , as there are three visible fluorescence peaks present in tissue EEMs in these spectral ranges. An MCR toolbox available from the Chemometrics Group at the University of Barcelona32 was used to extract the relative fluorescence contribution of each component, as well as their intrinsic spectral line shape. Prior to MCR analysis, the intrinsic fluorescence spectra of each tissue sample were normalized to the integrated intensity over the entire EEM, that is, the fluorescence intensities over all excitation-emission wavelength pairs sum up to unity. This normalization removed the patient-to-patient variation and the difference in the magnitude of fluorescence spectra measured with different spectrometers and probe geometries. MCR analysis was then carried out on the normalized fluorescence EEM, and the intrinsic tissue fluorescence can be represented as: where represents the contribution and represents the intensity of fluorescence from the ’th component at excitation wavelength of , and emission wavelength of , and is the residual component. In the MCR process, the basis fluorescence profile of each contributing component was normalized to have a peak of unity. Since all spectra were normalized to the integrated intensity within an EEM, then represents the fractional fluorescence contribution from an individual component to that sample. Note that the value of is related to the quantum yield and absorption coefficient (a function of fluorophore concentration and extinction coefficient) of the individual fluorescing component at the excitation wavelength. The quantities are the fluorescence properties that we obtained from the fluorescence model analysis.2.6.Correlation Between Extracted Tissue Properties and Histological Tissue CompositionThe extracted optical properties and fluorescence contributions were evaluated for their correlation with the histological tissue composition in the normal tissues obtained from breast reduction surgery (set 1). The tissue composition within the sensing volume of the optical measurements was recorded as %adipose, %fibro-connective, and %glandular. Spearman correlations were used to determine the correlation coefficients and values for the relationship between the extracted tissue properties and the histological tissue composition. 2.7.Statistical Analysis and Classification Using Fluorescence PropertiesThe tissue absorption and scattering properties and fluorescence contributions of individual components extracted from the tissue sets 2 and 3 were pooled together for the purpose of discriminating malignant from nonmalignant breast tissues. A Wilcoxon rank-sum test was performed to identify which extracted features from the diffuse reflectance and fluorescence spectra show statistically significant differences between malignant and nonmalignant breast tissues. The optical properties and/or fluorophore contributions that displayed statistically significant differences were input to a linear support vector machine (SVM) classifier to test the diagnostic accuracy of using these tissue properties for discriminating malignant from nonmalignant breast tissues. Classification was carried out on (1) absorption and scattering properties only, (2) fluorophore contributions only, and (3) combination of fluorophore contribution with absorption and scattering properties. For each case, two cross-validation schemes, i.e., holdout validation and leave-one-out cross-validation, were employed to perform an unbiased evaluation of the classification accuracy. In the holdout validation, the entire data set was randomly divided into training and testing sets, with each set containing half of the breast samples of each tissue type (i.e., 50% of the total malignant, 50% of the total fibrous/benign, and 50% of the total adipose tissue samples). Such a random partition was repeated 20 times, and the average classification accuracy was evaluated. In the leave-one-out cross-validation, a single sample was used as the testing data and the remaining samples were used as the training data. This was repeated such that each sample was used once as the test data. 3.ResultsFigure 1 shows the average absorption coefficient [Fig. 1a] and average reduced scattering coefficient [Fig. 1b] as a function of wavelength, for malignant , fibrous/benign , and adipose tissues in sample set 2. For all tissue types, significant hemoglobin absorption was observed at approximately 420, 530, and . Adipose tissues displayed an additional absorption band in the wavelength range of 440 to . This absorption band is primarily attributed to beta-carotene, which is present primarily in fat or adipose tissues. The scattering coefficients of all tissue types decreased monotonically with increasing wavelength. The average absorption and reduced scattering coefficients of the three tissue types in sample set 3 displayed similar features, but are not shown here. Fig. 1(a) Average absorption coefficient and (b) average reduced scattering coefficient as a function of wavelength, for malignant , fibrous/benign and adipose tissues in sample set 2.  Figure 2 shows the representative raw [Fig. 2a] and intrinsic [Fig. 2b] EEMs of a malignant tissue sample, each normalized to the integrated intensity of the EEM and plotted on a log scale. In comparing the raw and intrinsic EEMs, the most obvious change is the disappearance of the fluorescence peak at the wavelength pair around in the intrinsic EEM. In addition, the dip shown in the raw EEM at around , which is due to hemoglobin absorption, is also corrected for in the intrinsic EEM. Fig. 2(a) Raw and (b) intrinsic fluorescence EEMs of a representative malignant tissue sample, each normalized to the integrated intensity of the EEM and plotted on a log scale. 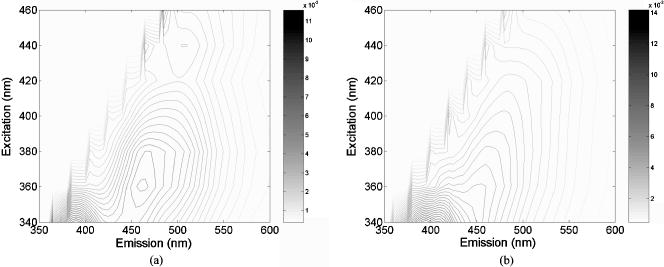 Figure 3 displays the average intrinsic fluorescence spectra obtained at excitation wavelength of 340 [Fig. 3a] and [Fig. 3b] for malignant , fibrous/benign , and adipose tissues in sample set 2. Malignant and fibrous/benign tissue samples share similar spectral profiles and displayed strong fluorescence at the emission wavelengths around at excitation and around at excitation. In adipose tissue samples, there was a weak presence of fluorescence at wavelengths around , but strong fluorescence at the wavelengths between 450 and . The shoulder at a wavelength of in the spectra of malignant and fibrous/benign tissue samples are not fluorescence peaks but rather artifacts that may be introduced from the overcorrection of the Soret band of hemoglobin absorption. The average intrinsic fluorescence spectra of the three tissue types in sample set 3 (not shown here) displayed similar spectral features but the intensities were on a different scale. Fig. 3Average intrinsic fluorescence spectra obtained at excitation wavelengths of (a) 340 and (b) , for malignant , fibrous/benign , and adipose tissues in sample set 2. 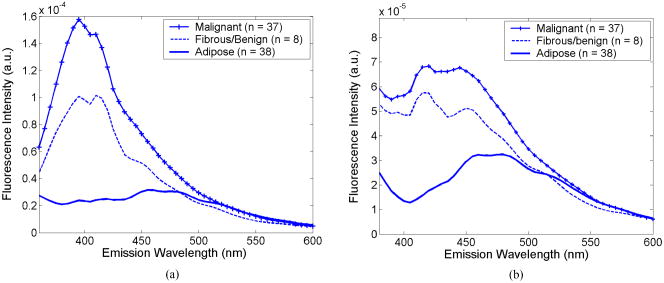 A three-component MCR analysis was carried out on the intrinsic fluorescence EEM to extract the relative contribution of the constituent fluorescing components, as well as their intrinsic spectral line shape. Figures 4a to 4c shows the EEMs of the three fluorescing components (denoted as , , and ) obtained from the MCR analysis on intrinsic EEMs of sample set 2. Each intrinsic tissue EEM is a linear combination of the component EEMs. These three components accounted for a vast majority of variance in the tissue EEMs, as the residual was only about 0.2% of the tissue EEM. The first component [Fig. 4a] displayed excitation-emission maximum at a wavelength pair of . The second component [Fig. 4b] displayed strong fluorescence at the emission wavelengths ranging from 450 to over an excitation range of 360 to . The third component [Fig. 4c] had peak fluorescence at an emission wavelength of at 340 to excitation. This component was found to be prevalent in adipose tissues. Fig. 4EEMs of fluorescing components (a) , (b) , and (c) obtained from a three-component MCR analysis on intrinsic EEMs of sample set 2.  Table 2 shows the correlations between the extracted scattering, absorption and fluorescence (marked with ) properties and the constituent tissue composition, which were evaluated on breast tissues in sample set 1 (note: , positive correlation; , negative correlation; , no significant correlation). Correlations were considered significant for . The mean reduced scattering coefficient, and the fluorescence contribution from and were negatively correlated with %adipose, while positively correlated with %fibroconnective and %glandular tissue content. The -carotene concentration and the fluorescence contribution of both had significant positive correlations with %adipose content, while they showed negative correlations with %fibroconnective and %glandular tissue content. Table 2Correlations between the extracted scattering, absorption and fluorescence (marked with * ) properties and the histological tissue composition, evaluated on breast tissues in sample set 1.
(Note
+
: positive correlation;
−
: negative correlation;
∅
: no significant correlation); correlations were considered significant for
p<0.01
. Table 3 shows the pairwise cross-correlation between extracted scattering, absorption (including baseline absorption component) and fluorescence (marked with ) properties of the combined sample sets (note: , positive correlation; , negative correlation; , no significant correlation). Correlation was evaluated using sample sets 2 and 3. Optical properties obtained from the diffuse reflectance did not show statistically significant correlations with each other. For fluorescence properties, the fluorescence contribution of was negatively correlated with that of and . In addition, the mean reduced scattering coefficient was positively correlated with the fluorescence contribution of , while negatively correlated with the fluorescence contribution of . -carotene concentration had a strong positive correlation with the fluorescence contribution of , and negative correlations with that of and . There was also a positive correlation between the total hemoglobin concentration and , and a negative correlation between hemoglobin saturation and . The baseline absorption component did not show statistically significant correlation with other extracted properties except for the fluorescence contribution of . Table 3Pairwise cross-correlation between extracted scattering, absorption (including baseline absorption component) and fluorescence (marked with * ) properties.
Note:
μs′
: mean reduced scattering coefficient;
β
-carotene:
β
-carotene concentration; total
Hb
: total hemoglobin concentration;
HbO2%
: hemoglobin saturation;
F1*
,
F2*
, and
F3*
: fluorescence contribution of
F1
,
F2
, and
F3
;
+
, positive correlation;
−
, negative correlation;
∅
: no significant correlation. Figure 5 shows the bar graphs of -carotene concentration [Fig. 5a], mean reduced scattering coefficient (mean ) [Fig. 5b], hemoglobin saturation [Fig. 5c] and relative fluorescence contribution of individual fluorescing components [Fig. 5d], as a function of tissue type. Data shown here were obtained from the combined sample sets (sets 2 and 3). -carotene concentration [Fig. 5a] was statistically higher in adipose breast tissues compare to that in malignant and fibrous/benign breast tissues . The mean reduced scattering coefficients [Fig. 5b] of malignant tissues were higher than that of fibrous/benign and adipose breast tissues . Hemoglobin saturation [Fig. 5c] was higher in both fibrous/benign and adipose breast tissues in comparison to that in malignant tissues . In Fig. 5d, it is shown that relative fluorescence contribution of and were higher in malignant and fibrous/benign tissues compare to that in adipose tissues , while the inverse trend was observed for . Fig. 5Bar graphs of (a) -carotene concentration, (b) mean reduced scattering coefficient (mean ), (c) hemoglobin saturation , and (d) relative fluorophore contribution of individual fluorophores ( , , and ), as a function of tissue type for samples combined from sets 2 and 3.  Table 4 lists the results from Wilcoxon rank-sum test on extracted absorption, scattering, and fluorescence properties for malignant versus nonmalignant and malignant versus fibrous/benign breast tissues (properties are listed in the order of decreased value for differentiating between malignant and non-malignant tissues, and fluorescence properties are marked with ). The difference in data distribution is considered statistically significant for . All extracted properties, except for total hemoglobin concentration and the baseline absorption component, displayed statistically significant differences between malignant and non-malignant breast tissues . However, only hemoglobin saturation and the mean reduced scattering coefficient displayed statistically significant difference between malignant and fibrous/benign breast tissues. This suggests that the fluorescence contrast shown between malignant and nonmalignant breast tissues may be primarily associated with the differences between malignant and adipose tissues. Table 4Results from Wilcoxon rank-sum test on extracted absorption, scattering, and fluorescence properties for malignant versus nonmalignant and malignant versus fibrous/benign breast tissues (properties are listed in the order of decreasing p value for differentiating between malignant and nonmalignant tissues; fluorescence properties are marked with * ).
Table 5 shows the results from the (a) holdout validation and (b) leave-one-out cross validation of a linear SVM classification on the combined data sets for discriminating malignant from non-malignant breast tissue samples using: (1) absorption and scattering properties only; (2) fluorescence properties only; and (3) combination of fluorescence, absorption, and scattering properties that show statistically significant differences between malignant and non-malignant breast tissues. The classification rate (C rate), sensitivity and specificity were averaged over repeated training-and-testing trials. In holdout validation [Table 5(a)], classification using absorption and scattering properties alone provided an average sensitivity and specificity of 82.6 and 90.1% respectively in training, and 81.7 and 88.6%, respectively, in testing for discriminating malignant from nonmalignant breast tissues. The classification using fluorescence properties alone yielded slightly higher sensitivity but relatively lower specificity (average SE and SP of 83.4 and 78.7%, respectively, in training, and 82.6 and 75.7%, respectively, in testing) compared to that achieved using absorption and scattering properties alone. It was also shown that combining fluorescence properties with absorption and scattering properties for classification slightly improved the diagnostic accuracy, and the average sensitivity and specificity were improved to 87.6 and 90.6% respectively in training, and 83.9 and 88.6% in testing, for discriminating malignant from non-malignant breast samples. In the leave-one-out cross-validation [Table 5(b)], the classification accuracy for the three cases were comparable to those yielded from the holdout validation. To summarize, the classification using absorption and scattering properties alone and that using combined fluorescence, absorption and scattering properties yielded similar classification accuracy, and both outperformed the classification using fluorescence properties alone. Table 5Results from the (a) holdout validation and (b) leave-one-out cross validation of a linear SVM classification on the combined data sets (sets 2 and 3) for discriminating malignant from nonmalignant breast tissue samples using (1) absorption and scattering properties only, (2) fluorescence properties only, and (3) combination of fluorescence, absorption and scattering properties that show statistically significant differences between malignant and non-malignant breast tissues.
The classification rate (C rate), sensitivity and specificity were averaged over the repeated training-and-testing trials (CV, cross-validation). Table 6 lists the number of tissue samples from each tissue type that were frequently (repeatedly) misclassified in the SVM classification using the three sets of inputs: (1) absorption and scattering properties only; (2) fluorescence properties only; and (3) the combination of fluorescence, absorption, and scattering properties. The sample number for each of the misclassified tissue samples is listed in parentheses to show samples that were misclassified by more than one algorithm. The majority of misclassified malignant tissues had IDC. DCIS, ILC, and LCIS constitute 25 to 40% of the misclassified malignant samples. This may be partly attributed to the fact that these subtypes of malignancy only account for a very small portion of the malignant samples and may be underrepresented in this data set. Among the misclassified malignant samples, the same LCIS and two IDCs were consistently misclassified using both the fluorescence only and the reflectance only algorithms. The ILCs were misclassified in the reflectance only algorithm, while DCIS was misclassified in the fluorescence only algorithm. More fibrous and benign samples were misclassified when using fluorescence properties alone for classification versus using reflectance properties, and these fibrous or benign samples accounted for the majority of misclassified non-malignant samples. Two of the benign samples, two of the fibro glandular samples and one of the adipose samples were consistently misclassified in reflectance only and fluorescence only classifications. For both malignant and non-malignant cases, most samples misclassified using combined tissue properties overlapped with those misclassified using the reflectance only algorithm. Table 6Number of tissue samples and the sample numbers of each tissue type that were misclassified in the SVM classification using the three sets of inputs: (1) absorption and scattering properties only; (2) fluorescence properties only; and (3) combination of fluorescence, absorption, and scattering properties.
The sample number for each of the misclassified tissue samples is listed in parentheses to show samples that were misclassified by more than one algorithm. 4.DiscussionIn this paper, we explored the use of Monte-Carlo-model-based approaches to extract a set of tissue properties, including intrinsic fluorophore contributions and absorption and scattering properties, which include -carotene concentration, total hemoglobin concentration, hemoglobin saturation, and mean reduced scattering coefficient from fluorescence and diffuse reflectance measurements of malignant and nonmalignant breast tissues. For normal samples obtained from breast reduction patients, the mean reduced scattering coefficient decreased with the %adipose tissue content, while it increased with the %fibroconnective and %glandular tissue content. This agrees with findings from previously published studies. For example, Peters 14 estimated the reduced scattering coefficients at for normal fibrous and normal adipose breast tissues and showed that fibrous tissues had higher reduced scattering coefficients as compared to adipose tissues. Cerussi 33 and Durduran 34 also showed in their studies that the scattering coefficients decreased with increasing body mass index (BMI). -carotene concentration was positively correlated with the %adipose tissue content, while negatively correlated with %fibroconnective and %glandular tissue content. This agrees with the fact that the majority of body reserves of -carotene are thought to be in adipose tissues.35 In comparing the malignant, fibrous/benign, and adipose breast tissues, -carotene had an increased concentration in adipose breast tissues compared to that of malignant and fibrous/benign breast tissues . This is expected since -carotene is primarily stored in fatty tissues.35 The hemoglobin saturation showed a significant decrease in malignant tissues relative to that in nonmalignant (including both fibrous/benign and adipose) tissues , which is likely due to the oxygen extraction of rapidly proliferating tumor cells. This property agreed with the findings from our previous studies,17, 18 and has also been reported in several previous studies using other techniques such as measurements36, 37 and near-IR (NIR) diffuse optical spectroscopy.33, 38, 39 Malignant breast tissues had an increased mean reduced scattering coefficient compared to that of nonmalignant breast tissues, which is also consistent with the findings from earlier studies published by Peters 14 and Ghosh 16 Three fluorescence components were extracted from the MCR analysis of the intrinsic fluorescence spectra. The first component has peak fluorescence at an excitation-emission pair of , which coincides with the primary excitation-emission maximum of collagen.40 The EEM of this component is similar to that reported41 for collagen type 1. Therefore, this component is likely attributed to collagen fluorescence, and in this study we assign as the collagen component. Collagen is the structural protein present in tissue extracellular matrix. Certain collagens, especially type 1 collagen, is a major constituent of the dermis and fibrous stroma of breast.42 It was shown that in normal breast tissues the fluorescence contribution of the collagen component decreased with increasing adipose tissue content, while it increased with increasing fibro-connective and glandular tissue content (as seen in Table 2). This agrees with the fact that collagen resides primarily in the dense fibrous stroma of the breast.42 Taroni 43 measured absorption of collagen in healthy breast tissues using time-resolved transmittance spectroscopy, and showed that less fatty tissues are characterized by higher collagen concentration. Results of our study also showed that the collagen component has statistically higher contribution to the fluorescence of malignant and fibrous/benign breast tissues, as compared with that of normal adipose tissues . Similar observations were also reported in previous studies using other optical spectroscopy techniques for breast tissue characterization.44 Haka 44 used Raman spectroscopy for the diagnosis of breast cancer, and found that there was increased contribution from collagen in benign and cancerous breast tissues, relative to that in normal breast tissues. The second component displayed strong fluorescence at the emission wavelengths ranging in 450 to at excitation wavelengths of 360 to . The fluorescence feature is spectrally very similar40, 41, 45 to that of NADH, thus, the primary fluorophore that contributes to this fluorescent component is likely NADH. This component is thus referred as the NADH component. Like the collagen component, the fluorescence contribution from the NADH component was also statistically higher in malignant and fibrous/benign breast tissues than that in adipose breast tissues. Since NADH is one of the important coenzymes for a large number of metabolic activities in cells, the relative concentration of this fluorophore varies according to the oxidative metabolic status of the cells. The higher fluorescence contribution from NADH component in malignant tissues may result from the increased metabolic activity and oxygen depletion in cancer cells, and thus accumulation of NADH. Uppal and Gupta46 carried out an enzymatic measurement of NADH concentration in malignant and normal breast tissues, and found that NADH is significantly higher in malignant tissues as compared with normal breast tissues. In the normal breast, NADH may also increase with the increased metabolism associated with the duct proliferation and secretory activities of the breast lobules, while adipose cells have an indolent metabolism.42 Therefore, fluorescence of adipose tissues would be expected to have lower contribution from NADH than that of fibrous/benign breast tissues. This explains the negative correlation observed between the fluorescence contribution of this component and adipose tissue content, as well as the positive correlation observed between this fluorescence component and fibroconnective and glandular tissue content in healthy breast tissues. The third component displayed an excitation-emission maximum at (360, 480) nm. This fluorescence peak or shoulder was observed in the intrinsic fluorescence spectra of the majority of adipose breast tissues. However, to our knowledge there is very limited work discussing the source of this fluorescent component. Possible sources for this fluorescence feature can be FAD or retinol/vitamin A, both reported to have fluorescence emission maxima at . We measured the fluorescence EEMs of commercially available FAD (F-6625, Sigma-Aldrich Co.) and retinol acetate (R-7882, Sigma-Aldrich Co.). By comparing the extracted EEM of the third component with those of FAD and retinol, we found noticeable similarity between the third component EEM and that of retinol (Fig. 6 ). Also the relative fluorescence contribution of the third component was highly correlated with the percent adipose tissues content in the breast tissues ( , , evaluated on sample set 1, and , , evaluated on samples set 2, not evaluated on sample set 3 since the percent tissue composition was not available for this sample set), as well as the -carotene concentration ( , , evaluated on combined data sets), which was derived from the Monte-Carlo-inverse-model-based analysis of concomitantly measured diffuse reflectance. -carotene is a precursor of vitamin A, and is primarily stored in adipose tissues.47 Based on these observations and facts, we have tentatively attributed this component to retinol, or vitamin A, and referred to as the retinol component. A systematic investigation of this fluorescence component may be required in the future in order to fully identify the source and also explore the potential confounding effects of FAD or other factors that may be present in the tissue. Results from our study suggest that there is a statistically significant increase in fluorescence contribution from retinol component in normal adipose breast tissues compared to that in other tissue types, which may indicate the prevalence of retinol content in normal adipose tissues. Since retinol is fat-soluble, it is primarily present in adipose tissues, and most women carry stores of retinol or vitamin A in their fat cells. Lunetta 35 have estimated and compared the retinol concentrations in normal and cancerous breast tissues in breast cancer patients, and found that the retinol concentration in normal breast tissues was slightly higher (on average) than that in malignant breast tissues, however the differences were not statistically significant. The negative correlation observed between the fluorescence contribution of collagen and NADH components versus the -carotene concentration may be attributed to fact that collagen and NADH is found predominantly in fibroglandular tissue while -carotene is found in fatty tissues. The mean reduced scattering coefficient has a positive correlation with the fluorescence contribution of NADH component, while it has a negative correlation with the fluorescence of the retinol component. This may be due to decreasing scattering,14, 34, 48 decreased NADH fluorescence,42 and increased retinol fluorescence in adipose tissues. The physiological basis for the negative correlation observed between fluorescence contribution of the collagen component and hemoglobin saturation is not clear. However, fluorescence of the collagen component was found to be prevalent in malignant tissues, which has lower hemoglobin saturation than normal tissues. This may contribute to the correlation observed between the two variables. In this study, we extracted the contribution of absorbers, scatterers, and fluorophores in breast tissue and correlated them with histological changes in the normal breast as well as histopathology of the breast. The trends observed in these extracted tissue properties with respect to different tissue types and histopathology findings are consistent with some known facts (such as prevalence of -carotene and fat in breast tissues) or results reported in other studies, which indicates that the optically determined tissue properties reflect the intrinsic changes in biochemical and physiological properties in breast tissues. However, the limitation of this study is that it was not possible to directly compare the extracted tissue properties to tissue constituent concentrations, because this is a study involving clinical samples, on which disruptive biochemical assays cannot be performed. However, we are currently doing a study to compare the extracted tissue properties to immunohistochemical assays (for example, hypoxia, microvessel density, collagen distribution, etc.) to demonstrate that the optical technique is nondestructively able to quantify biological and morphological information from breast tissues. This will provide a means to directly validate the quantitative physiological aspects of this technique. The intrinsic fluorescence spectra of each tissue sample were normalized to the integrated intensity over the entire EEM prior to MCR analysis. This normalization removed the intersample variations in the spectral intensity so that the extracted fluorescence contribution only reflected the fractional contributions of individual fluorophores to the fluorescence of each tissue sample. MCR analysis was also carried out on un-normalized intrinsic fluorescence spectra from set 2 only, and it was observed that the relationships of the extracted fluorophore contribution with different tissue types were the same as those observed with the normalized spectra. The relative fluorescence contribution of all three fluorescing components displayed statistically significant differences between malignant and nonmalignant breast tissues, these differences, however, may be associated with the differences between malignant and adipose tissue only, as a large portion of non-malignant breast samples are adipose tissues. The fluorescence spectra of malignant and fibrous/benign tissue samples shared similar spectral line shapes, and the Wilcoxon rank-sum test did not show statistically significant difference between malignant and fibrous/benign breast tissues in the fluorescence contributions of individual components. In the holdout validation, the classification based on fluorescence contributions alone achieved an average sensitivity and specificity of 83.4 and 78.7%, respectively in training, and 82.6 and 75.7%, respectively, in testing for discriminating malignant from nonmalignant breast tissues. The separation boundary yielded from this classification may discriminate primarily between malignant and normal adipose tissues and a retrospective look at the misclassified samples indicate that most of the misclassified non-malignant samples are fibrous or benign tissues. Classification using absorption and scattering properties that displayed statistically significant differences between malignant and non-malignant breast tissues provided a slightly decreased sensitivity (82.6% in training and 81.7% in testing using holdout validation) but higher specificity (90.1% in training and 88.6% in testing using holdout validation) for discriminating breast malignancy, as compared to that achieved using fluorescence properties alone. The improvement to the specificity may primarily be attributed to the inclusion of hemoglobin saturation and mean reduced scattering coefficient, especially the former, which displayed statistically significant differences between malignant and fibrous/benign breast tissues. The comparable classification performance using fluorescence properties, absorption and scattering properties alone, or both suggest that fluorescence and diffuse reflectance spectra both yield diagnostically useful information for the discrimination of breast malignancy. The retrospective review of the misclassified tissue samples (Table 6) shows that most samples misclassified using fluorescence properties were different from those misclassified using absorption and scattering properties, suggesting the diagnostically useful information yielded from reflectance and fluorescence could be complementary. Although in this study a direct combination of the two sets of tissue properties did not significantly improve the overall classification accuracy, a strategy using absorption and scattering properties and fluorescence properties separately (i.e., sequentially) may have the potential to improve the overall classification. The model-based approach for feature extraction enables a full exploration of the physiologically relevant information contained in the fluorescence and diffuse reflectance spectra, thus providing a comprehensive understanding of the biochemical, physiological, and morphological changes that take place in the tissue, which has implications in applications such as monitoring tumor response to therapy where both metabolism and hemoglobin oxygenation, for example, are important. Besides providing physiologically meaningful information about the tissue composition and pathology, another advantage of the model-based approach for the analysis of tissue spectra is that it can eliminate the instrument dependency, therefore results obtained using different instruments and probes are directly comparable. In our study, we combined the fluorescence, absorption, and scattering properties extracted independently from two sets of tissue spectra, which were measured with two different instruments and fiber optic probes. The extracted properties were comparable and a statistical test showed that there was no statistically significant difference between the two data sets. This enabled an increased sample size by combining the two data sets. In this study, the sensitivity and specificity for discriminating breast malignancy were evaluated using two validation methods, i.e., holdout validation and leave-one-out cross-validation, both of which provide an unbiased evaluation of the classification accuracy and the robustness of the classification algorithm. The classification accuracies were consistent across the repeated trials in which training samples were randomly selected from the entire sample set (combined sets 2 and 3). The classification accuracy achieved using holdout validation and leave-one-out cross validation were also comparable. In conclusion, we presented Monte-Carlo-model-based approaches for the analysis of fluorescence and diffuse reflectance spectra of breast tissues, which enable the extraction of intrinsic fluorescence, absorption, and scattering properties that provide the biochemical and morphological information about the tissue. The diagnostically useful absorption/scattering properties and fluorescence properties can be used alone or in combination for the discrimination of breast malignancy. It was also demonstrated that the model-based approach has the advantage of eliminating the dependency of fluorescence and diffuse reflectance measurements on the instrument and probe geometry, which makes it a more generalized approach for the analysis of tissue spectra. AcknowledgmentsThis work is supported by the National Institutes of Health (NIH) Grant No. 1R01CA100559-01 and the Department of Defense predoctoral traineeship DAMD17-02-1-0628 and W81XWH-05-1-0380. ReferencesC. Zhu,
G. M. Palmer,
T. M. Breslin,
F. Xu, and
N. Ramanujam,
“The use of a multiseparation fiber optic probe for the optical diagnosis of breast cancer,”
J. Biomed. Opt., 10
(2), 024032
(2005). https://doi.org/10.1117/1.1897398 1083-3668 Google Scholar
Y. Yang,
E. J. Celmer,
M. Zurawska Szczepaniak, and
R. R. Alfano,
“Excitation spectrum of malignant and benign breast tissues: a potential optical biopsy approach,”
Lasers Life Sci., 7
(4), 249
–265
(1997). 0886-0467 Google Scholar
Y. Yang,
A. Katz,
E. J. Celmer,
M. Zurawska-Szczepaniak, and
R. R. Alfano,
“Fundamental differences of excitation spectrum between malignant and benign breast tissues,”
Photochem. Photobiol., 66
(4), 518
–522
(1997). https://doi.org/10.1111/j.1751-1097.1997.tb03183.x 0031-8655 Google Scholar
Y. Yang,
A. Katz,
E. J. Celmer,
M. Zurawska Szczepaniak, and
R. R. Alfano,
“Optical spectroscopy of benign and malignant breast tissues,”
Lasers Life Sci., 7
(2), 115
–127
(1996). 0886-0467 Google Scholar
G. M. Palmer,
C. Zhu,
T. M. Breslin,
F. Xu,
K. W. Gilchrist, and
N. Ramanujam,
“Comparison of multiexcitation fluorescence and diffuse reflectance spectroscopy for the diagnosis of breast cancer (March 2003),”
IEEE Trans. Biomed. Eng., 50
(11), 1233
–1242
(2003). https://doi.org/10.1109/TBME.2003.818488 0018-9294 Google Scholar
G. M. Palmer and
N. Ramanujam,
“Diagnosis of breast cancer using optical spectroscopy,”
Med. Laser Appl., 18 233
–248
(2003). 1615-1615 Google Scholar
P. K. Gupta,
S. K. Majumder, and
A. Uppal,
“Breast cancer diagnosis using N2 laser excited autofluorescence spectroscopy,”
Lasers Surg. Med., 21
(5), 417
–422
(1997). https://doi.org/10.1002/(SICI)1096-9101(1997)21:5<417::AID-LSM2>3.3.CO;2-S 0196-8092 Google Scholar
C.-H. Liu,
B. B. Das,
W. L. Sha Glassman,
G. C. Tang,
K. M. Yoo,
H. R. Zhu,
D. L. Akins,
S. S. Lubicz,
J. Cleary,
R. Prudente,
E. J. Celmer,
A. Caron, and
R. R. Alfano,
“Raman, fluorescence, and time-resolved light scattering as optical diagnostic techniques to separate diseased and normal biomedical media,”
J. Photochem. Photobiol., B, 16
(2), 187
–209
(1992). https://doi.org/10.1016/1011-1344(92)80008-J 1011-1344 Google Scholar
S. K. Majumder,
P. K. Gupta,
B. Jain, and
A. Uppal,
“UV excited autofluorescence spectroscopy of human breast tissues for discriminating cancerous tissue from benign tumor and normal tissue,”
Lasers Life Sci., 8
(4), 249
–264
(1999). 0886-0467 Google Scholar
I. J. Bigio and
J. R. Mourant,
“Ultraviolet and visible spectroscopies for tissue diagnostics: fluorescence spectroscopy and elastic-scattering spectroscopy,”
Phys. Med. Biol., 42
(5), 803
–814
(1997). https://doi.org/10.1088/0031-9155/42/5/005 0031-9155 Google Scholar
R. R. Alfano,
B. B. Das,
J. Cleary,
R. Prudente, and
E. J. Celmer,
“Light sheds light on cancer—distinguishing malignant tumors from benign tissues and tumors,”
Bull. N. Y. Acad. Med., 67
(2), 143
–150
(1991). 0028-7091 Google Scholar
S. V. Pushkarev,
S. A. Naumov,
S. M. Vovk,
V. A. Volovodenko, and
V. V. Udut,
“Application of laser fluorescence spectroscopy and diffuse reflection spectroscopy in diagnosing the states of mammary gland tissue,”
Optoelectron. Instrum. Data. Process., 2 71
–76
(1999). Google Scholar
I. J. Bigio,
S. G. Bown,
G. Briggs,
C. Kelley,
S. Lakhani,
D. Pickard,
P. M. Ripley,
I. G. Rose, and
C. Saunders,
“Diagnosis of breast cancer using elastic-scattering spectroscopy: preliminary clinical results,”
J. Biomed. Opt., 5
(2), 221
–228
(2000). https://doi.org/10.1117/1.429990 1083-3668 Google Scholar
V. G. Peters,
D. R. Wyman,
M. S. Patterson, and
G. L. Frank,
“Optical properties of normal and diseased human breast tissues in the visible and near infrared,”
Phys. Med. Biol., 35
(9), 1317
–1334
(1990). https://doi.org/10.1088/0031-9155/35/9/010 0031-9155 Google Scholar
Y. Yang,
E. J. Celmer,
J. A. Koutcher, and
R. R. Alfano,
“UV reflectance spectroscopy probes DNA and protein changes in human breast tissues,”
J. Clin. Laser Med. Surg., 19
(1), 35
–39
(2001). 1044-5471 Google Scholar
N. Ghosh,
S. K. Mohanty,
S. K. Majumder, and
P. K. Gupta,
“Measurement of optical transport properties of normal and malignant human breast tissue,”
Appl. Opt., 40
(1), 176
–184
(2001). https://doi.org/10.1364/AO.40.000176 0003-6935 Google Scholar
C. Zhu,
G. M. Palmer,
T. M. Breslin,
J. Harter, and
N. Ramanujam,
“Diagnosis of breast cancer using diffuse reflectance spectroscopy: comparison of a Monte Carlo versus partial least squares analysis based feature extraction technique,”
Lasers Surg. Med., 38
(7), 714
–724
(2006). https://doi.org/10.1002/lsm.20356 0196-8092 Google Scholar
G. M. Palmer,
C. Zhu,
T. M. Breslin,
F. Xu,
K. W. Gilchrist, and
N. Ramanujam,
“Monte Carlo-based inverse model for calculating tissue optical properties. Part II: application to breast cancer diagnosis,”
Appl. Opt., 45
(5), 1072
–1078
(2006). https://doi.org/10.1364/AO.45.001072 0003-6935 Google Scholar
G. M. Palmer and
N. Ramanujam,
“Monte Carlo based model to extract intrinsic fluorescence from turbid media: theory and phantom validation,”
J. Biomed. Opt., 13 024017
(2008). https://doi.org/10.1117/1.2907161 1083-3668 Google Scholar
Q. Zhang,
M. G. Muller,
J. Wu, and
M. S. Feld,
“Turbidity-free fluorescence spectroscopy of biological tissue,”
Opt. Lett., 25
(19), 1451
–1453
(2000). https://doi.org/10.1364/OL.25.001451 0146-9592 Google Scholar
N. N. Zhadin and
R. R. Alfano,
“Correction of the internal absorption effect in fluorescence emission and excitation spectra from absorbing and highly scattering media: theory and experiment,”
J. Biomed. Opt., 3
(2), 171
–186
(1998). https://doi.org/10.1117/1.429874 1083-3668 Google Scholar
J. Wu,
M. S. Feld, and
R. Rava,
“Analytical model for extracting intrinsic fluorescence in turbid media,”
Appl. Opt., 32
(19), 3585
–3595
(1993). 0003-6935 Google Scholar
N. C. Biswal,
S. Gupta,
N. Ghosh, and
A. Pradhan,
“Recovery of turbidity free fluorescence from measured fluorescence: an experimental approach,”
Opt. Express, 11
(24), 3320
–3331
(2003). 1094-4087 Google Scholar
C. M. Gardner,
S. L. Jacques, and
A. J. Welch,
“Fluorescence spectroscopy of tissue: recovery of intrinsic fluorescence from measured fluorescence,”
Appl. Opt., 35
(10), 1780
–1792
(1996). 0003-6935 Google Scholar
M. G. Muller,
I. Georgakoudi,
Q. Zhang,
J. Wu, and
M. S. Feld,
“Intrinsic fluorescence spectroscopy in turbid media: disentangling effects of scattering and absorption,”
Appl. Opt., 40
(25), 4633
–4646
(2001). https://doi.org/10.1364/AO.40.004633 0003-6935 Google Scholar
G. M. Palmer and
N. Ramanujam,
“Monte-Carlo-based model for the extraction of intrinsic fluorescence from turbid media,”
J. Biomed. Opt., 13
(2), 024017
(2008). https://doi.org/10.1117/1.2907161 1083-3668 Google Scholar
G. M. Palmer and
N. Ramanujam,
“Monte Carlo-based inverse model for calculating tissue optical properties. Part I: theory and validation on synthetic phantoms,”
Appl. Opt., 45
(5), 1062
–1071
(2006). https://doi.org/10.1364/AO.45.001062 0003-6935 Google Scholar
R. Huang and
S. Jacques,
“Skin optics summary,”
(1998) http://omlc.ogi.edu/news/jan98/skinoptics.html Google Scholar
F. P. Bolin,
L. E. Preuss,
R. C. Taylor, and
R. J. Ference,
“Refractive index of some mammalian tissues using a fiber optic cladding method,”
Appl. Opt., 28
(12), 2297
–2303
(1989). 0003-6935 Google Scholar
J. R. Mourant,
J. P. Freyer,
A. H. Hielscher,
A. A. Eick,
D. Shen, and
T. M. Johnson,
“Mechanisms of light scattering from biological cells relevant to noninvasive optical-tissue diagnostics,”
Appl. Opt., 37
(16), 3586
–3593
(1998). https://doi.org/10.1364/AO.37.003586 0003-6935 Google Scholar
R. Graaff,
M. H. Keolink,
F. F. M. de Mul,
W. G. Zijlstra,
A. C. M. Dassel, and
J. G. Aarnoudse,
“Condensed Monte Carlo simulations for the description of light transport,”
Appl. Opt., 32
(4), 426
–434
(1993). 0003-6935 Google Scholar
R. Tauler,
“Multivariate curve resolution, MCR-ALS command line toolbox,”
(2006) http://www.ub.es/gesq/mcr/mcr.htm Google Scholar
A. E. Cerussi,
A. J. Berger,
F. Bevilacqua,
N. Shah,
D. Jakubowski,
J. Butler,
R. F. Holcombe, and
B. J. Tromberg,
“Sources of absorption and scattering contrast for near-infrared optical mammography,”
Acad. Radiol., 8
(3), 211
–218
(2001). 1076-6332 Google Scholar
T. Durduran,
R. Choe,
J. P. Culver,
L. Zubkov,
M. J. Holboke,
J. Giammarco,
B. Chance, and
A. G. Yodh,
“Bulk optical properties of healthy female breast tissue,”
Phys. Med. Biol., 47
(16), 2847
–2861
(2002). https://doi.org/10.1088/0031-9155/47/16/302 0031-9155 Google Scholar
J. M. Lunetta,
R. A. Zulim,
S. R. Dueker,
Y. Lin,
V. Flaig,
P. D. Schneider,
B. M. Wolfe, and
A. J. Clifford,
“Method for the simultaneous determination of retinol and beta-carotene concentrations in human tissues and plasma,”
Anal. Biochem., 304
(1), 100
–109
(2002). 0003-2697 Google Scholar
W. Mueller-Klieser,
K. H. Schlenger,
S. Walenta,
M. Gross,
U. Karbach,
M. Hoeckel, and
P. Vaupel,
“Pathophysiological approaches to identifying tumor hypoxia in patients,”
Radiother. Oncol., 20
(Suppl 1), 21
–28
(1991). 0167-8140 Google Scholar
P. Vaupel,
K. Schlenger,
C. Knoop, and
M. Hockel,
“Oxygenation of human tumors: evaluation of tissue oxygen distribution in breast cancers by computerized O2 tension measurements,”
Cancer Res., 51
(12), 3316
–3322
(1991). 0008-5472 Google Scholar
B. J. Tromberg,
N. Shah,
R. Lanning,
A. Cerussi,
J. Espinoza,
T. Pham,
L. Svaasand, and
J. Butler,
“Non-invasive in vivo characterization of breast tumors using photon migration spectroscopy,”
Aquacultural Eng., 2
(1–2), 26
–40
(2000). 0144-8609 Google Scholar
D. Grosenick,
K. T. Moesta,
H. Wabnitz,
J. Mucke,
C. Stroszczynski,
R. Macdonald,
P. M. Schlag, and
H. Rinneberg,
“Time-domain optical mammography: initial clinical results on detection and characterization of breast tumors,”
Appl. Opt., 42
(16), 3170
–3186
(2003). https://doi.org/10.1364/AO.42.003170 0003-6935 Google Scholar
N. Ramanujam,
“Fluorescence spectroscopy in vivo,”
Encyclopedia of Analytical Chemistry, 20
–56 John Wiley and Sons, Ltd., Chichester, UK (2000). Google Scholar
I. Georgakoudi,
B. C. Jacobson,
M. G. Muller,
E. E. Sheets,
K. Badizadegan,
D. L. Carr-Locke,
C. P. Crum,
C. W. Boone,
R. R. Dasari,
J. Van Dam, and
M. S. Feld,
“NAD(P)H and collagen as in vivo quantitative fluorescent biomarkers of epithelial precancerous changes,”
Cancer Res., 62
(3), 682
–687
(2002). 0008-5472 Google Scholar
S. Thomsen and
D. Tatman,
“Physiological and pathological factors of human breast disease that can influence optical diagnosis,”
Ann. N.Y. Acad. Sci., 838 171
–193
(1998). https://doi.org/10.1111/j.1749-6632.1998.tb08197.x 0077-8923 Google Scholar
P. Taroni,
D. Comelli,
A. Pifferi,
A. Torricelli, and
R. Cubeddu,
“Absorption of collagen: effects on the estimate of breast composition and related diagnostic implications,”
J. Biomed. Opt., 12
(1), 014021
(2007). https://doi.org/10.1117/1.2699170 1083-3668 Google Scholar
A. S. Haka,
K. E. Shafer-Peltier,
M. Fitzmaurice,
J. Crowe,
R. R. Dasari, and
M. S. Feld,
“Diagnosing breast cancer by using Raman spectroscopy,”
Proc. Natl. Acad. Sci. U.S.A., 102
(35), 12371
–12376
(2005). https://doi.org/10.1073/pnas.0501390102 0027-8424 Google Scholar
T. G. Scott,
R. D. Spencer,
N. J. Leonard, and
G. Weber,
“Synthetic spectroscopic models related to coenzymes and base pairs. V. Emission properties of NADH. Studies of fluorescence lifetimes and quantum efficiencies of NADH, AcPyADH, [reduced acetylpyridineadenine dinucleotide] and simplified synthetic models,”
J. Am. Chem. Soc., 92
(3), 687
–695
(1970). https://doi.org/10.1021/ja00706a043 0002-7863 Google Scholar
A. Uppal and
P. K. Gupta,
“Measurement of NADH concentration in normal and malignant human tissues from breast and oral cavity,”
Biotechnol. Appl. Biochem., 37
(Pt. 1), 45
–50
(2003). https://doi.org/10.1042/BA20020052 0885-4513 Google Scholar
Medline Plus Medical Encyclopedia online, http://www.nlm.nih.gov/medlineplus/ency/article/002400.htm Google Scholar
S. Srinivasan,
B. W. Pogue,
S. Jiang,
H. Dehghani,
C. Kogel,
S. Soho,
J. J. Gibson,
T. D. Tosteson,
S. P. Poplack, and
K. D. Paulsen,
“Interpreting hemoglobin and water concentration, oxygen saturation, and scattering measured in vivo by near-infrared breast tomography,”
Proc. Natl. Acad. Sci. U.S.A., 100
(21), 12349
–12354
(2003). https://doi.org/10.1073/pnas.2032822100 0027-8424 Google Scholar
|
||||||||||||||||||||||||||||||||||||||||||||||||||||||||||||||||||||||||||||||||||||||||||||||||||||||||||||||||||||||||||||||||||||||||||||||||||||||||||||||||||||||||||||||||||||||||||||||||||||||||||||||||||||||||||||||||||||||||||||||||||||||||||||||||||||||||||||||||||||||||||||||||||||||||||||||||||||||||||||||||||||||||||||||||||||||||||||||||||||||