|
|
1.IntroductionFor more than ,1 total internal reflection (TIR) of laser light has been used to study cell-substrate interfaces to get more detailed information on plasma membranes of living cells. When a light beam propagating through a medium of refractive index (e.g., glass) meets an interface with a second medium of refractive index (e.g., cytoplasm), TIR occurs at all angles of incidence that are greater than a critical angle . While being totally reflected, the incident beam establishes an evanescent electromagnetic field that penetrates into the second medium and decays exponentially with the distance from the interface. According to the relation penetration depths between about and more than are attained for its intensity ,2 depending on the wavelength and the angle of incidence . Therefore, fluorophores located within or close to the plasma membrane can be examined almost selectively in living cells. So far, total internal reflection fluorescence microscopy (TIRFM) has been applied for measuring the topography of cell-substrate contacts,1, 2, 3 membrane4 and protein5 dynamics, membrane-proximal ion fluxes,6, 7 as well as endocytosis and exocytosis.8, 9, 10With regard to potential diagnostic or pharmaceutical applications, TIR techniques appear rather promising for measurements of signal transduction, intracellular translocation of molecules, and membrane dynamics. Therefore, screening of a large number of samples is desirable. A first fluorescence reader based on simultaneous TIR of a laser beam on 96 samples of a microtiter plate (high throughput screening, or HTS) was recently described.11 However, in some cases, e.g., measurements of membrane stiffness and fluidity, additional data of individual samples are needed. Therefore, an optical setup to analyze fluorescence lifetime and fluorescence anisotropy (high content screening, or HCS) was developed and combined with the existing HTS reader system such that individual samples selected by HTS could be examined in detail by HCS. While fluorescence lifetime represents a general measure for the interaction of a marker molecule with its microenvironment, the rotational diffusion time corresponds to the time of rotation of a molecule from a position with a defined orientation into a position with an arbitrary orientation. This reflects directly the viscosity of the microenvironment, i.e., membrane fluidity in the case of living cells. For basic validation of the system, we used T47D breast cancer cells stably transfected with a plasmid encoding for a plasma membrane-associating yellow fluorescent protein (EYFP-Mem). Further validation of fluorescence lifetime and fluorescence anisotropy was accomplished with the membrane marker 22-(N-(7-nitrobenz-2-oxa-1,3-diazol-4-yl)amino)-23,24-bisnor-5-cholen- -ol (NBD-cholesterol) applied to the human glioblastoma cell line U373-MG. 2.Materials and MethodsU373-MG human glioblastoma cells obtained from the European Collection of Cell Cultures (ECACC No. 89081403) were routinely grown in an RPMI 1640 culture medium supplemented with 10% fetal calf serum (FCS), glutamine, and gentamycin at and 5% . After seeding within single cavities of a microtiter plate (96-well plate with well diameter; Greiner GmbH, Frickenhausen, Germany, with a custom-made glass bottom11) and a growth phase of (to obtain a subconfluent cell monolayer), the cells were incubated for with Earle’s Balanced Salt Solution (EBSS) containing NBD-cholesterol at a concentration of . At the end of the incubation time, the cells were washed with EBSS prior to fluorometric measurements. Solutions of NBD-cholesterol in EBSS were used for control measurements. T47D breast cancer cells obtained from the American Type Culture Collection (ATTC, Rockville, Maryland) and stably transfected with the Living colors™ subcellular localization vector pEYFP-Mem (Clontech, Palo Alto, California) were also cultivated in the RPMI 1640 medium supplemented with 10% FCS and antibiotics at and 5% . Again, were seeded in single cavities of a microtiter plate and grown for prior to fluorometric measurements. The experimental setup developed for fluorescence lifetime and fluorescence anisotropy screening is depicted in Fig. 1 . For a light source, we used a picosecond laser diode (LDH-P-C-470 with driver PDL 800-B, PicoQuant GmbH, Berlin, Germany; wavelength ; pulse width ; repetition rate ; average power ). Via a polarization maintaining single-mode fiber and a glass rod of rectangular shape, collimated laser light was coupled into the glass bottom of the microtiter plate for excitation of a preselected single row of cavities. In all cases the electric field vector was polarized perpendicular to the plane of incidence. Multiple TIRs occurred within this glass bottom if the angle of incidence was above the critical angle (resulting from the refractive indices for the glass bottom and for the cells). In the present setup, could be calculated from the distance between two cavities of the plate and the thickness of the glass bottom11 according to . Therefore, the condition of TIR was fulfilled for all cavities, and a penetration depth of the evanescent wave of about within the cells was calculated according to Eq. 1. Due to the Gaussian laser beam profile (beam diameter ), the illumination spot on each cavity of the microtiter plate was of elliptical shape with an area of about . The exciting laser light was coupled out of the glass bottom by a second glass rod to avoid uncontrolled reflections. Fig. 1Experimental setup for fluorescence lifetime and fluorescence anisotropy screening (integration into a HTS has been omitted). 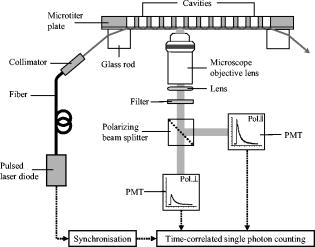 Fluorescence arising from about 2000 cells of each cavity was collected by a detection unit consisting of a microscope objective lens with magnification (numerical aperture ), an additional focusing lens , and a long-pass filter for . After passing a polarizing beamsplitter, fluorescence polarized parallel and perpendicular to the exciting laser light was detected by two photomultiplier tubes (H5783-01, Hamamatsu Photonics Deutschland GmbH, Herrsching, Germany). The signals from these photomultipliers were collected by a router (NRT 400, PicoQuant GmbH) synchronized with the laser pulses and fed to a time-correlated single photon counting device (TimeHarp 200, PicoQuant GmbH). In addition, unpolarized fluorescence was calculated and further evaluated. The whole equipment consisting of lenses, beamsplitter, and photomultipliers could be moved on a programmable scanning table and positioned below each cavity of the microtiter plate. The two photomultipliers were tuned for identical sensitivities in the two detection paths, i.e., deviations from 50:50 beamsplitting were been compensated electronically. A test experiment with polarized laser light showed that cross detection of the “wrong” polarization was below 4% for both photomultipliers. Unpolarized fluorescence decay curves were fitted as a sum of exponential terms with reconvolution by the instrumental response function (IRF) corresponding to with fluorescence lifetimes and pre-exponential factors representing the fractional contributions of the component . The decay parameters were iteratively recovered with a nonlinear least-squares error minimization based on the Levenberg-Marquardt algorithm.12 The reduced ratios and their autocorrelation functions were used to facilitate the assessment of the fit quality. In addition, the weighted residuals—corresponding to the deviations between measured and fitted values (divided by the square root of photon counts)—were calculated.Moreover, the anisotropy function was calculated from fluorescence intensities parallel and perpendicular to the exciting electric field vector according to was again fitted as a sum of exponential components according towhere corresponds to the rotational relaxation times (with respect to different molecular axes), and corresponds to the initial anisotropy of each component. Since in the present case multiexponential curve fitting did not improve the quality of the fit, the evaluation algorithm described by Eq. 4 was reduced to monoexponential curve fitting according to .For a comparison of fluorescence lifetimes and rotational diffusion times of whole cells (upon epiillumination) and plasma membranes (upon TIR illumination), a fluorescence microscope was used as described elsewhere.3, 4 3.Results3.1.Fluorescence Lifetime ScreeningFor validation of the HCS system, time-correlated fluorescence of individual samples with about 2000 cells each was registered in unpolarized and polarized mode. Unpolarized fluorescence decay kinetics are depicted in Fig. 2a for U373-MG glioblastoma cells incubated with NBD-cholesterol as well as for T47D-eYFP-Mem transfectants expressing a membrane-associating fluorescent protein. The IRF of a cavity without any cells (also depicted in Fig. 2a) served as a control and was used for reconvolution fitting. Fluorescence decay curves were fairly biexponential, and corresponding fitting curves as well as weighted residuals are included in Fig. 2a and 2b. Fig. 2Normalized fluorescence intensity of U373-MG glioblastoma cells incubated with NBD-cholesterol ( , ) and of stably transfected T47D-EYFP-Mem breast cancer cells including biexponential fitting curves and IRF (a) with weighted residuals (b). Excitation wavelength: ; detection range: .  The parameters obtained from biexponential curve fitting (with reconvolution) are summarized in Table 1 . Values represent medians and median absolute deviations (MADs) of 40 individual measurements from different samples of the microtiter plate. The amplitude of the short-lived component was similar (NBD-cholesterol) or about 3 times lower (EYFP-Mem) than that of the long-lived component. The low MAD values demonstrate that the fluorescence lifetimes of individual samples are highly reproducible. The longer fluorescence lifetime of NBD-cholesterol in U373-MG cells was about twice as high as that measured for NBD-cholesterol solutions (with versus ), whereas the shorter fluorescence lifetime was virtually the same ( in cells versus in solution). Additional measurements in a fluorescence microscope proved that fluorescence lifetimes of whole cells (upon epiillumination) and plasma membranes (upon TIR illumination) differed by less than 10%. Table 1Lifetimes τi and normalized amplitudes Ai of membrane-associated fluorescence of U373-MG glioblastoma cells incubated with NBD-cholesterol ( 4μM , 60min ), and of T47D-EYFP-Mem cells (excitation wavelength: 470nm ; detection range: λ⩾515nm .) Values represent medians and MADs of 40 individual samples of the microtiter plate in each case.
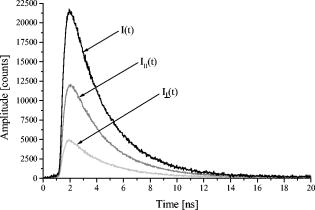
3.2.Fluorescence Anisotropy ScreeningFluorescence kinetics and (polarized) as well as (unpolarized) of T47D-EYFP-Mem cells are depicted in Fig. 3 . and result from both fluorescence decay and rotational diffusion. The anisotropy functions calculated from Eq. 3 for T47D-EYFP-Mem cells and U373-MG glioblastoma cells incubated with NBD-cholesterol are depicted in Fig. 4a . Both anisotropy curves decrease monotonously from an initial value and are fitted as monoexponential functions (also depicted in Fig. 4a), resulting in a rotational relaxation time , an initial anisotropy , and for U373-MG glioblastoma cells incubated with NBD-cholesterol as well as , , and for T47D-EYFP-Mem cells. Values represent of 20 individual samples in each case. values as well as the weighted residuals depicted in Fig. 4b indicate a rather good exponential fit for NBD-cholesterol and some deviations from the monoexponential behavior for EYFP-Mem. Rotational relaxation times of NBD-cholesterol in U373-MG cells exceeded those measured for NBD-cholesterol solutions by a factor of 2.3, and the initial anisotropy was considerably higher in glioblastoma cells (0.275) than in solution (0.17). Again, the values of rotational relaxation times of whole cells and plasma membranes differed by less than 10% when measured in the fluorescence microscope. 4.DiscussionA HCS system for the parameters fluorescence lifetime and fluorescence anisotropy was established with TIR excitation. The system was validated with cultivated cells either incubated with a fluorescent membrane marker or expressing a membrane-associating fluorescent protein. Highly reproducible fluorescence lifetimes and rotational diffusion times were measured for a large number of samples. Therefore, plasma membrane-associated parameters, e.g., membrane fluidity or protein dynamics, were measured reliably. In addition, the HCS system was combined with an existing TIR fluorescence reader11 so that a larger number of samples could be screened rapidly, whereas a smaller number of selected samples was examined in detail for fluorescence lifetime and anisotropy parameters. Fluorescence decay curves of NBD-cholesterol in U373-MG cells and T47D-EYFP-Mem cells showed biexponential behavior, indicating that different molecular conformations or locations of the fluorophores might coexist. This seems to be similar in the plasma membrane and in intracellular membranes, since fluorescence lifetimes were almost identical upon TIR and epiillumination. However, the longer fluorescence lifetime of NBD-cholesterol in solution is smaller by a factor 2 than cell measurements, which again demonstrates the important role of its microenvironment. For NBD-cholesterol and T47D-EYFP-Mem cells, the relative fluorescence intensity—corresponding to the normalized product of relative amplitude and fluorescence lifetime of the short-lived component—was comparably small. This may explain why only one rotational diffusion time could be resolved in each case. Rotational diffusion times of NBD-cholesterol in U373-MG cells and T47D-EYFP-Mem cells were similar, but it was only in the case of NBD-cholesterol that the clear monoexponential behavior of indicated rather free molecular rotation. In the case of EYFP-Mem, deviations from this monoexponential behavior may have resulted from some restriction in molecular rotation due to membrane binding. However, tentative fitting by a 2-D (in-plane) rotation model13 did not improve the quality of the fit and increased the values in comparison with the model of free (3-D) molecular rotation described by Eq. 3. So far, there is no experimental evidence that Förster resonance energy transfer between fluorophores of the same species (homo-FRET)14 might here affected fluorescence anisotropy in the cell cultures. However, due to the smaller value measured for NBD-cholesterol solutions, homo-FRET (occurring, e.g., in aggregated dye molecules) cannot be excluded. The initial anisotropy mainly reflects the angle between optical excitation and emission dipoles of the fluorophores, which according to the relation15 is about for EYFP-Mem and for intracellular NBD-cholesterol.TIR measurements of fluorescence anisotropy may contribute largely to studies of membrane dynamics of living cells. Presently, membrane stiffness and fluidity are investigated as a function of temperature, cell age, and intracellular amounts of cholesterol.4, 16 Changes in cholesterol amounts in cell membranes have been related to various diseases17, 18, 19 and may have some influence on the uptake of pharmaceutical agents. Therefore, in the future fluorescence anisotropy screening using TIR illumination may also have some potential for clinical studies. AcknowledgmentsThis project was supported by the Ministerium für Wissenschaft, Forschung und Kunst Baden-Württemberg, Germany. Technical assistance by Claudia Hintze is gratefully acknowledged. ReferencesD. Axelrod,
“Cell-substrate contacts illuminated by total internal reflection fluorescence,”
J. Cell Biol., 89 141
–145
(1981). https://doi.org/10.1083/jcb.89.1.141 0021-9525 Google Scholar
G. A. Truskey,
J. S. Burmeister,
E. Grapa, and
W. M. Reichert,
“Total internal reflection fluorescence microscopy (TIRFM) (II) topographical mapping of relative cell/substratum separation distances,”
J. Cell. Sci., 103 491
–499
(1992). 0021-9533 Google Scholar
K. Stock,
R. Sailer,
W. S. L. Strauss,
M. Lyttek,
R. Steiner, and
H. Schneckenburger,
“Variable-angle total internal reflection fluorescence microscopy (VA-TIRFM): realization and application of a compact illumination device,”
J. Microsc., 211 19
–29
(2003). https://doi.org/10.1046/j.1365-2818.2003.01200.x 0022-2720 Google Scholar
H. Schneckenburger,
M. Wagner,
M. Kretzschmar,
W. S. L. Strauss, and
R. Sailer,
“Laser-assisted fluorescence microscopy for measuring cell membrane dynamics,”
Photochem. Photobiol. Sci., 3 817
–822
(2004). https://doi.org/10.1039/b317047k 1474-905X Google Scholar
E. Sund and
D. Axelrod,
“Actin dynamics at the living cell submembrane imaged by total internal fluorescence photobleaching,”
Biophys. J., 79 1655
–1669
(2000). 0006-3495 Google Scholar
G. M. Omann and
D. Axelrod,
“Membrane-proximal calcium transients in stimulated neutrophils detected by total internal reflection fluorescence,”
Biophys. J., 71 2885
–2891
(1996). 0006-3495 Google Scholar
A. Demuro and
I. Parker,
“Imaging the activity and localization of single voltage-gated channels by total internal reflection fluorescence microscopy,”
Biophys. J., 86 3250
–3259
(2004). 0006-3495 Google Scholar
W. J. Betz,
F. Mao, and
C. B. Smith,
“Imaging exocytosis and endocytosis,”
Curr. Opin. Neurobiol., 6 365
–371
(1996). https://doi.org/10.1016/S0959-4388(96)80121-8 0959-4388 Google Scholar
M. Oheim,
D. Loerke,
W. Stuehmer, and
R. H. Chow,
“The last few milliseconds in the life of a secretory granule,”
Eur. Biophys. J., 27 83
–98
(1998). https://doi.org/10.1007/s002490050114 0175-7571 Google Scholar
V. Beaumont,
“Visualizing membrane trafficking using total internal reflection fluorescence microscopy,”
Biochem. Soc. Trans., 31 819
–823
(2003). https://doi.org/10.1042/BST0310819 0300-5127 Google Scholar
T. Bruns,
W. S. L. Strauss,
R. Sailer,
M. Wagner, and
H. Schneckenburger,
“Total internal reflectance fluorescence reader for selective investigations of cell membranes,”
J. Biomed. Opt., 11 034011
(2006). https://doi.org/10.1117/1.2208617 1083-3668 Google Scholar
D. V. O’Connor and
D. Philipps, Time-Correlated Single Photon Counting,
(1984) Google Scholar
M. L. Gee,
L. Lenson,
T. A. Smith, and
C. A. Scholes,
“Time-resolved evanescent wave induced fluorescence anisotropy for the determination of molecular conformational changes of proteins at an interface,”
Eur. Biophys. J., 33 130
–139
(2004). 0175-7571 Google Scholar
E. K. L. Yeow and
A. H. A. Clayton,
“Enumeration of oligomerization states of membrane proteins in living cells by homo-FRET spectroscopy and microscopy: theory and application,”
Biophys. J., 92 3098
–3104
(2007). 0006-3495 Google Scholar
J. R. Lakowicz, Principles of Fluorescence Spectroscopy, 3rd editionSpringer Science + Business, New York
(2006). Google Scholar
P. Weber,
M. Wagner, and
H. Schneckenburger,
“Microfluorometry of cell membrane dynamics,”
Cytometry, 69A 185
–188
(2006). 0196-4763 Google Scholar
G. P. Eckert,
N. J. Cairns,
A. Maras,
W. F. Gattaz, and
W. E. Muller,
“Cholesterol modulates the membrane-disordering effects of beta-amloyid peptides in the hippocampus: specific changes in Alzheimer’s disease,”
Dementia Geriatr. Cognit. Disord., 11 181
–186
(2000). https://doi.org/10.1159/000017234 1420-8008 Google Scholar
S. Aozaki,
“Decreased membrane fluidity in erythrocytes from patients with Crohn’s disease,”
Gastroenterol. Jpn., 24 246
–254
(1989). 0435-1339 Google Scholar
T. Koike,
G. Ishida,
M. Taniguchi,
K. Higaki,
Y. Ayaki,
M. Saito, Y. Sakakihara,
Y. Iwamori, and
K. Onno,
“Decreased membrane fluidity and unsaturated fatty acids in Niemann-Pick disease type C fibroblasts,”
Biochim. Biophys. Acta, 1406 327
–335
(1998). 0006-3002 Google Scholar
|