
|
|
1.IntroductionIn combination with microscopy, digital holography provides marker-free, quantitative phase contrast imaging for technical inspection and quantitative live cell analysis1, 2, 3, 4, 5, 6 that is also suitable for modular add-on integration into commercial microscopes.7 In this way, digital holographic microscopy (DHM) facilitates a combination with established techniques such as laser scanning microscopy, fluorescence imaging, and optical laser micromanipulation.7 The reconstruction of digitally captured holograms is performed numerically. Compared to other phase contrast methods,8, 9 interferometry-based techniques,10, 11, 12, 13, 14 and optical coherence tomography (OCT) or optical coherence microscopy15, 16, 17, 18, 19, 20 (OCM), DHM provides quantitative phase contrast with subsequent numerical focus correction (multifocus imaging) from a single recorded hologram. This feature is of particular advantage for measurements of cellular specimens with high-magnification optics for the detection of fast processes as well as for long-term measurements, where focus tracking is required due to mechanical instability or thermal effects.21, 22 The evaluation of the quantitative digital holographic phase contrast images provides data for thickness monitoring,7 the analysis of the cellular refractive index,23, 24, 25, 26 and the observation of cell swelling and shrinking kinetics due to osmotic stimulation.2, 25 In combination with a (subsequent) numerical automated focus adjustment,27 applications for microscopic long-term time-lapse investigations are opened up by avoiding mechanical focus tracking.21, 22 Furthermore, prospects for monitoring of fast dynamic processes such as shape variations of cells in suspension, e.g., due to interaction with artificial surfaces, are enabled.28 In this paper, data obtained by digital holography are utilized for the measurement of the 3-D dynamics of phase objects. With the known properties of the microscope imaging system, the subsequent quantification of axial sample movements is determined without mechanical focus adjustment from the numerically obtained digital holographic autofocus propagation distance21 following the “depth from focus” principle.29, 30 The required relation between propagation distance and axial displacements can be obtained either by determination of the imaging geometry or by calibration routines. The evaluation of quantitative DHM phase contrast images provides (in combination with a calibrated image scale) an efficient detection of lateral cell displacements by time-dependent determination of sample coordinates with maximum phase contrast. Thus, by combination of the laterally and axially obtained data, monitoring of 3-D displacements of phase objects without mechanical focus adjustment is available. Investigations of sedimenting red blood cells and HT-1080 fibrosarcoma cells in a collagen tissue model are carried out to demonstrate that DHM enables quantitative automated dynamic 3-D tracking of spherically and arbitrarily shaped cells without mechanical focus control. 2.Setup for Digital Holographic MicroscopyFigure 1 shows the schematic of the interferometer unit of an inverse digital holographic phase contrast microscopy setup (iMIC system, TILL photonics, Graefelfing, Germany, modified for DHM) for the investigation of phase objects such as living cells. The coherent light of a laser (frequency-doubled Nd:YAG laser, ) is divided into object wave (O) and reference wave (R). The magnification of O is performed by a microscope lens (MO) and a tube lens (TL). For the experiments that are described in Sec. 5.1 a Zeiss LD Plan-Neofluar microscope lens (Carl Zeiss, Jena, Germany) is applied. The investigation on the HT-1080 cell in collagen (Sec. 5.2) is carried out by using a Zeiss A-Plan (Carl Zeiss, Jena, Germany) objective. The superposition of O with the slightly tilted reference wave (R) generates digital off-axis holograms,31 which are recorded by a digital image sensor (CCD, , Imaging Source DMK 41BF02, Bremen, Germany) and transferred via an IEEE 1394 interface to an image-processing system for the numerical reconstruction. Fig. 1Inverse microscope setup for digital off-axis holography in transmission light arrangement: O, object wave; R, slightly tilted reference wave; C, condenser; OB, object; MO, microscope lens; BS, beamsplitter; TL, tube lens; CCD, image sensor; , propagation distance between hologram plane and image plane ; , distance between object plane corresponding to hologram plane and image plane . 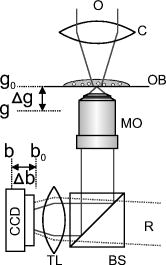 3.Reconstruction of Digitally Captured HologramsThe numerical reconstruction of the digital off-axis holograms is performed by nondiffractive spatial-phase-shifting-based reconstruction.2, 23 In a first step, the complex object wave is calculated within the hologram plane . In the case of unfocused imaging, in the second step is numerically propagated by a convolution-based algorithm31 from the hologram plane to the image plane (see Fig. 1): In Eq. 1, is the laser wavelength, and represents a Fourier transform. The lateral coordinates are denoted by and , while and represent the coordinates in the spectral domain. Equation 1 provides a constant image scale during propagation. This feature is of particular advantage for robust and reliable digital holographic autofocusing (see Sec. 4 and Ref. 22). From , in addition to the absolute amplitude that represents the bright-field image of the sample under coherent illumination, the phase information of the sample is simultaneously reconstructed. After phase unwrapping the obtained data is utilized for quantitative phase contrast microscopy.4.Tracking of 3-D Sample MovementsThe determination of the focal image plane is performed by an autofocus algorithm that quantifies the image sharpness for each plane within the image space by summing up the logarithmically weighted and bandpass-filtered power spectra of a reconstructed amplitude distribution21, 22 : In Eq. 2 denotes a bandpass-filtered Fourier transform, where the lower boundary of the applied bandpass filter is set to suppress the frequency parts in the origin of the spectrum that do not contain information about the focus degree. In focus, pure phase objects such as cells with negligible absorption show the least contrast in the amplitude distributions27 (autofocus criterion for phase objects). Thus, is minimal, whereas the corresponding quantitative phase contrast images are observed with optimized lateral and phase resolution.21, 22The propagation distance of a sharp image of the sample is used to determine the relative axial object displacements . The DHM setup in Fig. 1 can be approximated as a single-lens imaging system. Hence, the relation between the propagation distance and the corresponding focus displacement in the object space can be derived from the thin lens equation32 (see Fig. 2 ): The denotation of the variables is explained in Fig. 2. If insufficient data about the microscope’s optical components are available (as in the present case), the relation between and cannot be calculated directly from Eq. 3. Instead, a calibration via the digital holographic autofocus approach is applied to obtain the relation between and . The calibration procedure is performed by recording a set of stepwise defocused digital holograms of fixed pancreas tumor cells (PaTu 8988S, typical cell thickness23 ) on a glass carrier.22 Thus, for each utilized microscope lens the relative object displacement is varied in the direction in steps of with the piezodriven microscope stage, while is determined by subsequent application of the previously described digital holographic autofocus method. Figure 3 shows the obtained autofocus propagation distances in dependence of in comparison to fitted data corresponding to Eq. 3. Due to the relation the experimentally obtained data describe in good approximation a linear relation. The linearity coefficients between and are determined to be (Zeiss LD Plan-Neofluar ) and (Zeiss A-Plan ), respectively.Fig. 2Geometric relation between axial displacements in object space and image space for a thin lens approximated optical imaging system: , focal length; and , initial object and image distance; and , changed object and image distance; and , relative axial displacement in object and image space.  Fig. 3Calibration of the relation between the digital holographic autofocus position in dependence on the object position ; the lines represent linear fit functions; linearity coefficients: , . 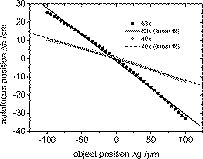 The lateral cell position is determined from the automatically refocused phase contrast images. In a preceding step, the unwrapped phase distributions are low-pass-filtered (box average filter, for the described experiments). In this way, substructures of the object in the phase distributions and noise, e.g., due to parasitic interferences and coherent noise are reduced. Afterward, within a region of interest (ROI) where the sample is located, the pixel coordinates of the phase maximum are determined [for illustration see dotted white boxes in Figs. 4e, 4f, 4g, 4h ]. The time-dependent tracking of dynamic cellular displacements from reconstructed phase data of time-lapse sequences is performed by successive recentering of the ROI to the coordinates of the preceding maximal phase value. A calibrated imaging scale [U.S. Air Force (USAF) 1951 calibration test chart] is applied to convert the resulting displacement trajectories of the sample in direction from pixel coordinates to metric units. The combination of both, autofocus propagation distance and displacement trajectories, allows for quantitative 3-D object tracking. Fig. 4Time-dependent 3-D tracking of a sedimenting human RBC (spherical spiky shaped echinocyte) by digital holographic microscopy. (a) to (d) unfocused phase distributions of the RBC during the sedimentation process at , , , and ; (e) to (h) quantitative phase distributions obtained of the same digital hologram as in (a) to (d) by application of digital holographic autofocus, the dotted box represents the ROI for the tracking in (j); (i) time dependence of the axial position of the sample obtained by digital holographic autofocusing; (j) trajectory of the RBC obtained by determination of the coordinates with maximum phase contrast; (k) 3-D trajectories obtained by combination of the data in (i) and (j). 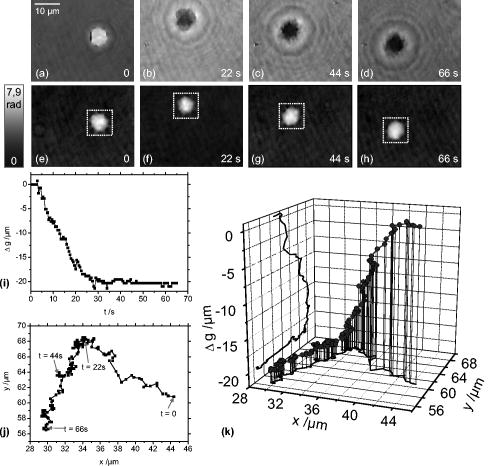 5.Results5.1.Sedimentation Monitoring of Red Blood CellsIn a first experiment, the applicability of automated digital holographic 3-D cell tracking was investigated by observation of the sedimentation process of a human red blood cell (RBC) in physiological solution onto a zwitterionic polymer-coated cover slip.28 For the preparation of the sample, blood from healthy human donors was used (obtained from the blood bank of the University Hospital of the Saarland University, Homburg, Germany). After the centrifugation of the RBCs ( , ) at room temperature, the cells were washed three times with a physiological solution containing (mM): NaCl 145, glucose 10, morpholinoethane sulfonic acid/Tris-(hydroxymethyl)aminomethane (MES/Tris) 10, pH 7.4 at room temperature. Plasma and buffy coat were aspirated. The cells were resuspended at a hematocrit of 0.01% on cover slips and immediately used for DHM measurements. Cover slips were coated with the zwitterion containing copolymer poly(N-vinil-2-pyrrolidone-co-N,N-dimethylmethacryloyloxy′-dimethacryloyloxy-ethylpropane-sulfonate) prepared in the Laboratory of Water-Soluble Polymers, Polyelectrolytes and Biopolymers, Faculty of Chemistry, Sofia University, with a 1:10 dilution in deionized water. Note that the suspension contained discocytes as well as echinocytes (two of three classical RBC shapes, the third—stomatocytes—was not observed). Figure 4 shows results from the application of the described method for digital holographic 3-D cell tracking on the sedimentation process of a spherical spiky echinocyte. During the observation, the cell undergoes fast dynamic motions that require a permanent and robust realignment of the focal position. A series of 132 digital holograms was recorded at fixed optical focus and evaluated for 3-D cell tracking. Figure 4a, 4b, 4c, 4d exemplarily show representative unfocused holographic phase contrast images of the RBC during the sedimentation process for , , , and . Here, corresponds to about after the addition of the RBC suspension onto the cover slip. Figures 4e, 4f, 4g, 4h depict the quantitative phase distributions reconstructed from of the same hologram data after application of the digital holographic autofocus procedure. In the sharply reconstructed phase distributions, the spherical spiky shape of the investigated echinocyte becomes clearly visible. The time dependence of the axial displacement obtained by digital holographic autofocusing and the corresponding trajectories of the RBC are plotted in Figs. 4i and 4j. Figure 4k presents the 3-D trajectory that results from the combination of the data in Figs. 4i and 4j. Figure 4k demonstrates the correct operation of the proposed 3-D tracking method. All phase contrast images were correctly reconstructed in focus without unwrapping errors. Furthermore, the effect of sedimentation of the RBC due to gravitation is illustrated. During the stage of free sedimentation in the interval the RBC constantly sinks due to the gravitational force. From the data in Fig. 4i, the sedimentation velocity is determined to , which is found within the typical range of for the sedimentation of RBCs in blood plasma.33 Furthermore, the obtained value for the sedimentation velocity shows that the axial displacement per second exceeds the depth of field of the applied imaging system. Thus, automated focus readjustment is necessary. The 3-D trajectory in Fig. 4k clearly identifies the effect of the polymer-coated surface on the sedimentation process of the specimen. When the cell approaches the bottom of the cover slip , the repellent coating prevents attachment. Instead, the cell first slightly overshoots the equilibrium of forces between gravitation and repellence and afterward swings into a constant position, which is indicated by for [see Fig. 4i]. In Fig. 4j, the levitation of the RBC in the equilibrium state is clearly visible as it remains in continuous lateral motion even after the sedimentation is finished . 5.2.Analysis of Cell Migration in CollagenThe analysis of cell migration processes is an important aspect for the understanding of morphogenesis and cancer metastasis. Thus, investigations of the applicability of digital holographic autofocus tracking for 3-D cell migration monitoring were performed. Therefore, human fibrosarcoma tumor cells (HT-1080) within nondenatured collagen fibers as a 3-D tissue model were observed in a Petri dish ( -Dish, ibidi GmbH, Munich, Germany). The preparation of the sample was carried out by following the approach of Friedl and Brocker.34 Different from Ref. 34, a slightly diluted collagen concentration of was used to decrease light-scattering effects. The temperature was stabilized to 37° using an incubation chamber (Solent Scientific Ltd., Segensworth, United Kingdom). A series of 61 holograms of three HT-1080 cells within the field of view that were identified as separated under white light illumination was recorded with fixed mechanical focus ( magnification microscope lens) for a period of . For each cell, digital holographic 3-D tracking was performed in analogy to the description in Sec. 5.1. Figure 5 depicts the obtained results for , , , and . Figures 5a, 5b, 5c, 5d show bright-field images of the sample under white light illumination. The corresponding digital holographic phase contrast images are depicted in Figs. 5e, 5f, 5g, 5h, 5i, 5j, 5k, 5l. The tracked cells are denoted as A, B, and C. The dotted white squares in the phase contrast images mark the applied ROIs that were used for holographic autofocusing and 2-D tracking. In the white light images, cells B and C are only slightly defocused during the experiment. Cell A is located in a different layer and thus appears only marginally visible due to a large defocus. Fig. 5Time-dependent digital holographic 3-D migration monitoring of human fibrosarcoma HT-1080 tumor cells in collagen: (a) to (d) bright-field images (white light illumination); (e) to (h) quantitative digital holographic phase contrast images with autofocus tracking ROI set to cell C, as marked with a dashed box; (i) to (l) quantitative digital holographic phase contrast images with autofocus tracking ROI set to cell A, as marked with a dashed box; (m) temporal dependency of the axial positions of cells A, B, and C; (n) time-resolved lateral tracking of cells A, B, and C; and (o) resulting 3-D trajectories. 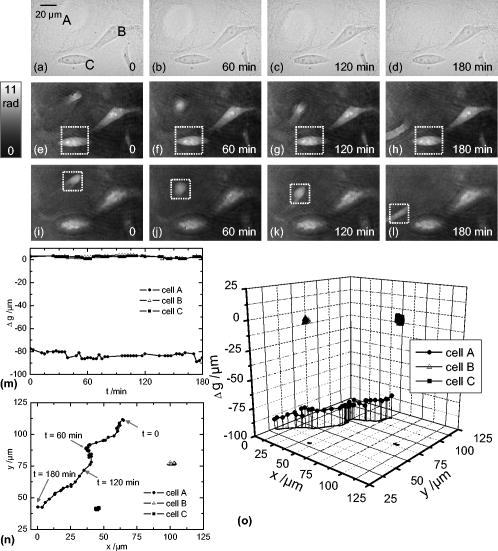 In Figs. 5e, 5f, 5g, 5h the ROI for digital holographic autofocusing tracking was set to cell C, which appears sharply focused in the reconstructed quantitative phase contrasts images and even subcellular structures such as the nucleoli are visible. As the axial position of cell B is close to the layer in which cell C is located, this cell is also displayed with comparable image sharpness. In contrast, cell A is far out of focus. In Figs. 5i, 5j, 5k, 5l the ROI was set to cell A. After digital holographic autofocusing, cell A is sharply resolved in each phase distribution and cellular motions as well as deformations and thickness changes during the process of migration become clearly visible. Figures 5m and 5n show the resulting temporal dependencies of the relative positions as well as the corresponding (lateral) coordinates for all three cells A, B, and C. The 3-D trajectories resulting from the combination of the data in Figs. 5m and 5n are plotted in Fig. 5o. In Figs. 5m, 5n, 5o data with phase unwrapping errors were not considered. For cells B and C, 74% (45 of 61 phase images) were faultlessly determined. For cell A, a percentage of 77% (47 of 61 images) was obtained. The reason for different percentages of phase distributions without unwrapping errors is the mutual influence by unfocused structures outside the ROI. Cells B and C are stationary in position and shape. In contrast, cell A is located in a layer approximately below cells B and C and migrates within the collagen. During the observed migration process through the network of collagen fibers, the cell performs permanent shape changes in a multistep cascade of coordinated adhesion and contraction,35 which are clearly observed in Figs. 5i, 5j, 5k, 5l. 6.Discussion and ConclusionsThe results described in Sec. 5 demonstrate the applicability of DHM for automated 3-D cell tracking of living cells. The measurement accuracy in the direction is restricted by the depth of field of the applied imaging system (approx. for the microscope lens and for the microscope lens) and the robustness of the holographic autofocus algorithm.22 The precision of the detected lateral displacements of the sample depends on the magnification of the applied optical system as well as the individual shape of the sample and its fluctuation. Thus, for sedimenting spherical cells in suspension, the algorithms results in a phase unwrapping efficiency of 100%, whereas for cells in collagen the performance is decreased to a mean value of 75% due to a higher phase noise level in the collagen-based tissue model. In conclusion, the presented 3-D tracking technique opens up new perspectives for digital holographic microscopy applications in live cell imaging. One important field of application is the automated localization, tracking, and shape analysis of sedimenting cells on coated surfaces. Here, the utilization of digital holographic autofocusing enables the precise identification of the specific time of surface contact and the differentiation between different types of motion with a temporal resolution that is mainly restricted by the data acquisition rate of the applied image recording device (here, ). The results from the automated tracking of HT-1080 cells in collagen tissue show that the method can be applied in the field of (marker-free and thus minimally invasive) dynamic 3-D tumor cell migration analysis (e.g., for the understanding of metastasis formation). In addition, it has been demonstrated that by application of DHM-based 3-D tracking quantitative imaging of arbitrarily shaped cells in different (3-D tissue model) layers is enabled, which are not even visible in the bright-field case. Further application prospects of the method are opened up for investigations of the dynamics of particles in viscous flow and the characterization of cell vitality states in toxicology. In summary, a method for marker-free automated microscopic digital holographic 3-D tracking without scanning and mechanical focus realignment was presented. The 3-D position of samples was determined subsequently from digital holograms by numerical autofocusing and evaluation of the quantitative phase contrast images. The applicability of the technique was demonstrated by the quantitative analysis of the sedimentation process of living human RBCs and 3-D tumor cell migration monitoring in 3-D tissue models. Thus, new application fields of DHM in particle flow analysis and quantitative 3-D tumor cell imaging are prospected. AcknowledgmentsFinancial support by the German Federal Ministry for Education and Research (BMBF) as part of the “Biophotonics” research program and mobility funding from the European Network of Excellence “Nano2Life” is gratefully acknowledged. Furthermore, the authors would like to thank the group of Prof. Friedl (Rudolf Virchow Center, DFG Research Center for Experimental Biomedicine and Department of Dermatology, University of Wuerzburg, Germany) for the support with the collagen-based 3-D tissue model and the HT-1080 fibrosarcoma cells. ReferencesE. Cuche, P. Marquet, and C. Depeursinge,
“Simultaneous amplitude-contrast and quantitative phase-contrast microscopy by numerical reconstruction of Fresnel off-axis holograms,”
Appl. Opt., 38 6994
–7001
(1999). https://doi.org/10.1364/AO.38.006994 0003-6935 Google Scholar
D. Carl, B. Kemper, G. Wernicke, and G. von Bally,
“Parameter-optimized digital holographic microscope for high-resolution living-cell analysis,”
Appl. Opt., 43 6536
–6544
(2004). https://doi.org/10.1364/AO.43.006536 0003-6935 Google Scholar
P. Marquet, B. Rappaz, P. J. Magistretti, E. Cuche, Y. Emery, T. Colomb, and C. Depeursinge,
“Digital holographic microscopy: a noninvasive contrast imaging technique allowing quantitative visualization of living cells with subwavelength,”
Opt. Lett., 30 468
–470
(2005). https://doi.org/10.1364/OL.30.000468 0146-9592 Google Scholar
C. Mann, L. Yu, C. Lo, and M. Kim,
“High-resolution quantitative phase-contrast microscopy by digital holography,”
Opt. Express, 13 8693
–8698
(2005). https://doi.org/10.1364/OPEX.13.008693 1094-4087 Google Scholar
F. Charrière, J. Kühn, T. Colomb, F. Montfort, E. Cuche, Y. Emery, K. Weible, P. Marquet, and C. Depeursinge,
“Characterization of microlenses by digital holographic microscopy,”
Appl. Opt., 45 829
–835
(2006). https://doi.org/10.1364/AO.45.000829 0003-6935 Google Scholar
B. Kemper and G. von Bally,
“Digital holographic microscopy for live cell applications and technical inspection,”
Appl. Opt., 47 A52
–A61
(2008). https://doi.org/10.1364/AO.47.000A52 0003-6935 Google Scholar
G. von Bally, B. Kemper, D. Carl, S. Knoche, M. Kempe, C. Dietrich, M. Stutz, R. Wolleschensky, K. Schütze, M. Stich, A. Buchstaller, K. Irion, J. Beuthan, I. Gersonde, and J. Schnekenburger,
“New methods for marker-free live cell and tumour analysis,”
Biophotonics: Visions for Better Health Care, 301
–360 VCH-Wiley, Weinheim
(2006). Google Scholar
L. G. Alexopoulos, G. R. Erickson, and F. Guilak,
“A method for quantifying cell size from differential interference contrast images: validation and application to osmotically stressed chondrocytes,”
J. Microsc., 205 125
–135
(2002). https://doi.org/10.1046/j.0022-2720.2001.00976.x 0022-2720 Google Scholar
A. Barty, K. A. Nugent, D. Paganin, and A. Roberts,
“Quantitative optical phase microscopy,”
Opt. Lett., 23 817
–819
(1998). https://doi.org/10.1364/OL.23.000817 0146-9592 Google Scholar
G. Popescu, L. P. Deflores, J. C. Vaughan, K. Badizadegan, H. Iwai, R. R. Dasari, and M. S. Feld,
“Fourier phase microscopy for investigation of biological structures and dynamics,”
Opt. Lett., 29 2503
–2505
(2004). https://doi.org/10.1364/OL.29.002503 0146-9592 Google Scholar
T. Ikeda, G. Popescu, R. R. Dasari, and M. S. Feld,
“Hilbert phase microscopy for investigating fast dynamics in transparent systems,”
Opt. Lett., 30 1165
–1167
(2005). https://doi.org/10.1364/OL.30.001165 0146-9592 Google Scholar
J. Farinas and A. S. Verkman,
“Cell volume and plasma membrane osmotic water permeability in epithelial cell layers measured by interferometry,”
Biophys. J., 71 3511
–3522
(1996). 0006-3495 Google Scholar
V. P. Tychinskii,
“Dynamic phase microscopy: is a dialogue with the cell possible?,”
Phys. Usp., 50 513
–528
(2007). 1063-7869 Google Scholar
V. P. Tychinskii,
“Coherent phase microscopy of intracellular processes,”
Phys. Usp., 44 617
–629
(2001). https://doi.org/10.1070/PU2001v044n06ABEH000841 1063-7869 Google Scholar
A. D. Aguirre, P. Hsiung, T. H. Ko, I. Hartl, and J. G. Fujimoto,
“High-resolution optical coherence microscopy for high-speed, in vivo cellular imaging,”
Opt. Lett., 28 2064
–2066
(2003). https://doi.org/10.1364/OL.28.002064 0146-9592 Google Scholar
E. A. Swanson, J. A. Izatt, M. R. Hee, D. Huang, C. P. Lin, J. S. Schuman, C. A. Puliafito, and J. G. Fujimoto,
“In vivo retinal imaging by optical coherence tomography,”
Opt. Lett., 18 1864
–1866
(1993). 0146-9592 Google Scholar
Y. Zhao, Z. Chen, Z. Ding, H. Ren, and J. S. Nelson,
“Real-time phase-resolved functional optical coherence tomography by use of optical Hilbert transformation,”
Opt. Lett., 27 98
–100
(2002). https://doi.org/10.1364/OL.27.000098 0146-9592 Google Scholar
C. G. Rylander, D. P. Dave, T. Akkin, T. E. Milner, K. R. Diller, and A. J. Welch,
“Quantitative phase-contrast imaging of cells with phase-sensitive optical coherence microscopy,”
Opt. Lett., 29 1509
–1511
(2004). https://doi.org/10.1364/OL.29.001509 0146-9592 Google Scholar
A. K. Ellerbee, T. L. Creazzo, and J. A. Izatt,
“Investigating nanoscale cellular dynamics with cross-sectional spectral domain phase microscopy,”
Opt. Express, 15 8115
–8124
(2007). https://doi.org/10.1364/OE.15.008115 1094-4087 Google Scholar
C. Joo, K. H. Kim, and J. F. d. Boer,
“Spectral-domain optical coherence phase and multiphoton microscopy,”
Opt. Lett., 32 623
–625
(2007). 0146-9592 Google Scholar
P. Langehanenberg, B. Kemper, and G. von Bally,
“Autofocus algorithms for digital-holographic microscopy,”
Proc. SPIE, 6633 66330E
(2007). 0277-786X Google Scholar
P. Langehanenberg, B. Kemper, D. Dirksen, and G. von Bally,
“Autofocusing in digital holographic phase contrast microscopy on pure phase objects for life cell imaging,”
Appl. Opt., 47 D176
–D182
(2008). https://doi.org/10.1364/AO.47.00D176 0003-6935 Google Scholar
B. Kemper, D. Carl, J. Schnekenburger, I. Bredebusch, M. Schäfer, W. Domschke, and G. von Bally,
“Investigation of living pancreas tumor cells by digital holographic microscopy,”
J. Biomed. Opt., 11 34005
(2006). 1083-3668 Google Scholar
B. Kemper, S. Kosmeier, P. Langehanenberg, G. von Bally, I. Bredebusch, W. Domschke, and J. Schnekenburger,
“Integral refractive index determination of living suspension cells by multifocus digital holographic phase contrast microscopy,”
J. Biomed. Opt., 12 054009
(2007). https://doi.org/10.1117/1.2798639 1083-3668 Google Scholar
B. Rappaz, P. Marquet, E. Cuche, Y. Emery, C. Depeursinge, and P. J. Magistretti,
“Measurement of the integral refractive index and dynamic cell morphometry of living cells with digital holographic microscopy,”
Opt. Express, 13 9361
–9373
(2005). https://doi.org/10.1364/OPEX.13.009361 1094-4087 Google Scholar
B. Rappaz, F. Charrière, C. Depeursinge, P. J. Magistretti, and P. Marquet,
“Simultaneous cell morphometry and refractive index measurement with dual-wavelength digital holographic microscopy and dye-enhanced dispersion of perfusion medium,”
Opt. Lett., 33 744
–746
(2008). https://doi.org/10.1364/OL.33.000744 0146-9592 Google Scholar
F. Dubois, C. Schockaert, N. Callens, and C. Yourassowsky,
“Focus plane detection criteria in digital holography microscopy by amplitude analysis,”
Opt. Express, 14 5895
–5908
(2006). https://doi.org/10.1364/OE.14.005895 1094-4087 Google Scholar
I. Bernhardt, L. Ivanova, P. Langehanenberg, B. Kemper, and G. von Bally,
“Application of digital holographic microscopy to investigate the sedimentation of intact red blood cells and their interaction with artificial surfaces,”
Bioelectrochemistry, 73 92
–96
(2008). 1567-5394 Google Scholar
S. K. Nayar and Y. Nakagawa,
“Shape from focus,”
IEEE Trans. Pattern Anal. Mach. Intell., 16 824
–831
(1994). https://doi.org/10.1109/34.308479 0162-8828 Google Scholar
P. Grossmann,
“Depth from focus,”
Pattern Recogn. Lett., 5 63
–69
(1987). https://doi.org/10.1016/0167-8655(87)90026-2 0167-8655 Google Scholar
U. Schnars and W. Jüptner,
“Digital recording and numerical reconstruction of holograms,”
Meas. Sci. Technol., 13 R85
–R101
(2002). https://doi.org/10.1088/0957-0233/13/9/201 0957-0233 Google Scholar
L. Bergmann and C. Schaefer, Optics of Waves and Particles, de Gruyter, Berlin
(1999). Google Scholar
M. B. Andresdottir, N. Sigfusson, H. Sigvaldason, and V. Gudnason,
“Erythrocyte sedimentation rate, an independent predictor of coronary heart disease in men and women: the Reykjavik study,”
Am. J. Epidemiol., 158 844
–851
(2003). 0002-9262 Google Scholar
P. Friedl and E. B. Brocker,
“Reconstructing leukocyte migration in 3D extracellular matrix by time-lapse videomicroscopy and computer-assisted tracking,”
Methods Mol. Biol., 239 77
–90
(2004). 1064-3745 Google Scholar
K. Wolf, Y. I. Wu, Y. Liu, J. Geiger, E. Tam, C. Overall, M. S. Stack, and P. Friedl,
“Multi-step pericellular proteolysis controls the transition from individual to collective cancer cell invasion,”
Nat. Cell Biol., 9 893
–904
(2007). 1465-7392 Google Scholar
|


