
|
|
1.IntroductionBrain tumors and intractable epilepsy are two severe brain disorders in the pediatric population.1, 2, 3, 4 Gross total surgical resection of the abnormal brain area, when feasible, can be an effective treatment option for both brain disorders.5, 6, 7 While neoplastic brain lesions can occur in any part of the brain and spinal cord, non-neoplastic, epileptogenic brain lesions usually are found in the cerebral cortex. The success of such a surgery requires complete removal of any abnormal brain while preserving normal surrounding tissue, thereby minimizing the potential loss of neurological function.5, 8, 9, 10, 11, 12, 13 To achieve this goal, accurate localization and delineation of the abnormal brain area is necessary. In current practice, localization of either a neoplastic or an epileptogenic brain lesion is conducted during the preoperative assessment phase using several neuroimaging modalities, including computed tomography (CT), magnetic resonance imaging (MRI), functional MRI (fMRI), single photon emission CT (SPECT), and positron emission tomography (PET).5, 6, 7, 14 For epileptogenic lesions, video electroencephalography (EEG) also is employed during the presurgical planning phase.15, 16, 17, 18, 19 However, the information derived from preoperative imaging studies, like the margins of the lesion, often loses its accuracy because the brain shifts and deforms during a craniotomy.15, 16, 17, 18, 19 Ultrasound may be used to detect brain tumor margins intraoperatively, but its sensitivity remains questionable.20, 21 For epileptogenic lesions, intraoperative electrocorticography (ECoG) does not distinguish between 1. a seizure focus originating from a lesion, and 2. normal brain tissue that is adjacent to the epileptogenic lesion but demonstrating EEG abnormalities due to electrical spreading.13, 22, 23 Therefore, removal of a neoplastic or epileptogenic brain lesion relies primarily on visual inspection during surgery. Identifying the margins of a brain lesion based solely on appearance and texture is a major, unresolved surgical problem. This often leads to incomplete removal of the offending brain lesion or, alternatively, excessive removal of surrounding normal brain tissue. Optical diagnosis is an emerging, nondestructive, in vivo, real-time technique that uses light absorption and scattering to quantify tissue biochemical composition and morphological characteristics, thereby allowing clinicians to detect disease and injury development.24, 25, 26, 27, 28 In recent years, the feasibility of using such a technique to demarcate brain tumors intraoperatively has been investigated, and successful results have been reported.29, 30, 31, 32, 33, 34, 35, 36, 37, 38 Several groups also have reported unique hemodynamic characteristics of epileptogenic brain, using a diffuse reflectance imaging modality.39, 40, 41, 42, 43, 44 The utility of an optical diagnosis technique in pediatric brain tumor and epilepsy surgery has not yet been evaluated, however. With this in mind, the primary objective of the current work was to determine the feasibility of using optical spectroscopy to differentiate normal brain from neoplastic and epileptogenic brain lesions, within the context of an in vitro tissue study. 2.Materials and MethodsThe in vitro brain tissue study described next was carried out at Miami Children’s Hospital. The study protocol was approved by a local Institutional Review Board. Brain specimens were collected both from brain tumor patients and epilepsy patients undergoing a craniotomy. After removal from the patient, specimens were transported and studied immediately at an adjoining research lab. The fluorescence and diffuse reflectance properties of the collected specimens were characterized using a table-top fiber optic optical spectroscopic system that had been built locally. The system consisted of two light sources. A nitrogen-dye laser (ORIEL-79111 Spectra-Physics, Irvine, California) was employed for fluorescence spectroscopy; it produced excitation light at three wavelengths: (native), (Exalite 360), and (Coumarin 440). A tungsten-halogen light was used for diffuse reflectance spectroscopy, it provided light emission between 360 and . Spectral recording was achieved using a portable spectrometer with a detection range (USB 2000, Ocean Optics, Dunedin, Florida). The spectrometer was equipped with a entrance slit, which yielded a spectral resolution of approximately . The spectrometer provided an adequate spectral signal-to-noise ratio and enough spectral resolution to depict the fluorescence and diffuse reflectance spectral features of interest. A filter wheel equipped with one and one long-pass filters (Omega Optical Inc, Brattleboro, Vermont) was mounted at the entrance port of the spectrometer, this was done so that the excitation light in the fluorescence spectra could be removed. A fiber optic probe was used to conduct both excitation and emission light between the target tissue and the spectroscopic system. The probe contained three -core fibers (excitation) and one -core fiber (emission). The arrangement of fibers provided an investigation volume of less than , which was determined theoretically using a Monte Carlo simulation model for photon migration. The small-investigation-volume characteristic of the fiber optic probe offered two advantages: 1. the influence of tissue nonhomogeneity to the recorded spectra was reduced; and 2. more importantly, smaller specimens could be evaluated. Prior to each experiment, the spectroscopy system was evaluated using fluorescence and diffuse reflectance standards to ensure the consistency of system performance. The brain specimen was rinsed, using buffered saline, to remove any residual blood on the tissue surface. The cleaned specimen was mounted on a quartz microscope with a black background. The fiber optic probe was placed on top of the specimen, its tip lightly in contact with the tissue surface. From each investigated site of a specimen, a baseline spectrum (i.e., no excitation), fluorescence spectra at all excitation wavelengths, and a diffuse reflectance spectrum were acquired sequentially. The spectral acquisition procedure was repeated five times to ensure the reproducibility of spectral recoding. A small sample was removed from the area of investigation and preserved in Formalin for pathological analysis. Recorded spectra were processed to eliminate any alterations induced by the instrumentation. Specifically, background subtraction was performed on each spectrum, with its corresponding baseline spectrum. Next, fluorescence and diffuse reflectance spectra were corrected for all instrumentation-induced artifacts, using a set of calibration factors. The calibration factors for fluorescence spectra compensated for the spectral alterations induced by the transmissitivities of the collection fiber and the laser light filter, as well as the responsivity of the spectrometer. Experimentally, was obtained by comparing the true emission spectrum of a calibrated tungsten light (LS-1-CAL, Ocean Optics, Dunedin, Florida) with the one measured by means of the table-top spectroscopic system. The calibration factors for diffuse reflectance spectra accounted for all the instrumentation-induced spectral alterations stated before, as well as for those caused by the emissivity of the white light source . Here, was obtained by measuring the emission spectrum of the white light source, using a calibrated spectrometer. Because of concerns regarding the signal-to-noise ratio, the spectral ranges for the fluorescence and diffuse reflectance spectra were limited to and , respectively. Processed spectral data were categorized in accordance with their corresponding pathological records. For study purposes, the spectral data were divided into four primary categories: normal white matter, normal gray matter, neoplastic brain, and epileptogenic brain. From each spectral data subset, the mean fluorescence and diffuse reflectance spectra and their standard deviations were calculated. In addition, raw spectral intensities at all wavelengths from any two selected groups were compared, using a two-tailed, unequal-variance t-test with the significance level set at . p values from the t-test were plotted in accordance with the wavelength in each comparison to identify all spectral regions that differentiated the two tissue categories (i.e., spectral features). In addition to comparing the absolute intensities of the raw calibrated spectra, normalized spectra were used during the spectral analysis to enhance the detection of unique spectral profile features representing a given tissue category. The normalization method used here was peak-intensity normalization; each spectrum was normalized to its maximum intensity. It should be noted that the fluorescence spectra measured at all three excitation wavelengths from a single investigated site were treated as a single spectral set, and that they were normalized to the maximum intensity among them. Using the representative spectral features of fluorescence , diffuse reflectance , or both features combined, tissue classification algorithms were established by means of linear discriminant analysis. This analysis procedure was conducted using the statistical program SPSS, with the “leave-one-out” classification (cross-validation) option activated. For comparison of two given tissue categories, three representative spectral features were selected as inputs. The sensitivity and specificity of the classification algorithms, using either one versus multiple spectral features, were calculated and compared. 3.ResultsDuring the study period, brain specimens were collected from 17 brain tumor patients and from 26 epilepsy patients. Pilocytic astrocytoma was the most common tumor type among the tumor specimens collected. Of the 26 epileptogenic specimens collected, 13 possessed the histological characteristics of cortical dysplasia. Since some specimens were large enough for multiple investigations, the total number of investigated sites in each category were greater than the numbers of patients studied (Tables 1, 2 ). Table 1Age distribution of the studied patients.
Table 2Number of investigated sites in each tissue category.
3.1.Normal White Matter Versus Normal Gray MatterThree prominent differences were observed between the spectra recorded from normal white matter and those observed from normal gray matter. First, raw diffuse reflectance intensities from white matter were significantly greater than those from gray matter over the entire spectral region evaluated. Second, fluorescence emission from white matter at excitation was significantly stronger than that from gray matter. Third, the maximum in the average diffuse reflectance spectrum for gray matter was identified at , while the maximum for white matter was at . 3.2.White Matter Versus Neoplastic BrainWithout spectral normalization, it was noticed that the raw diffuse reflectance and fluorescence signals from normal white matter were significantly greater than those from tumor over the entire spectral region evaluated. When the spectral normalized method was employed, the spectral regions effectively separating normal white matter from brain tumor tissue were reduced to in diffuse reflectance spectra, and to in fluorescence spectra at excitation (Fig. 1 ). Because there was not a consistent peak location in the diffuse reflectance spectra from tumors, the maximum value of the average normalized diffuse reflectance spectrum from neoplastic brain was found to be less than one [Fig. 1a]. Fig. 1Comparisons of (a) normalized diffuse reflectance spectra, (b) normalized fluorescence emission spectra at excitation, (c) normalized fluorescence emission spectra at excitation, and (d) normalized fluorescence emission spectra at excitation between normal white matter and neoplastic brain . standard deviation spectra are plotted. 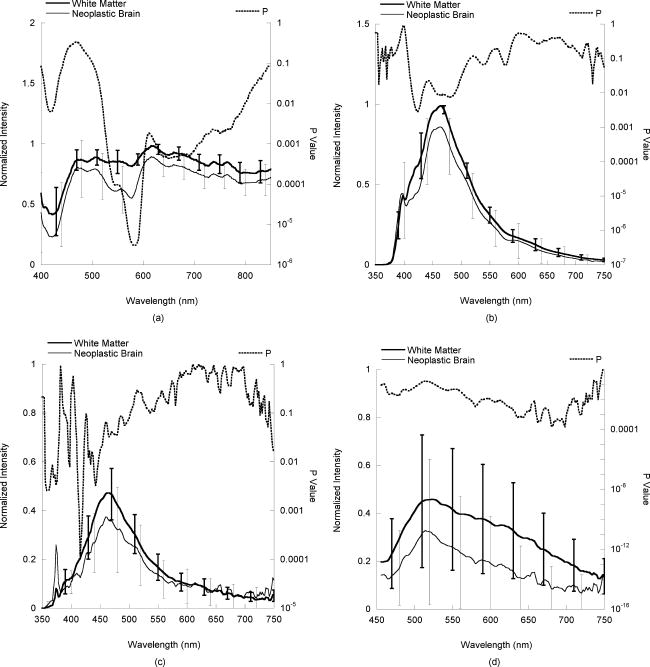 3.3.Normal Gray Matter Versus Neoplastic BrainBoth fluorescence and diffuse reflectance spectroscopy were highly effective at differentiating normal gray matter from neoplastic brain. The normalized diffuse reflectance spectra between 400 and , as shown in Fig. 2a, effectively separated normal gray matter from neoplastic brain [ , Fig. 2a]. Significant differences also were apparent in the normalized fluorescence spectra between normal gray matter and neoplastic brain; the difference was especially prominent in those at 360- and excitation [Figs. 2b, 2c, 2d]. Fig. 2Comparisons of (a) normalized diffuse reflectance spectra, (b) normalized fluorescence emission spectra at excitation, (c) normalized fluorescence emission spectra at excitation, and (d) normalized fluorescence emission spectra at excitation between normal gray matter and neoplastic brain . standard deviation spectra are plotted.  3.4.Normal White Matter Versus Epileptogenic BrainNeither raw nor normalized fluorescence spectroscopy provided effective separation between normal white matter and epileptogenic brain lesions at any excitation wavelengths. Raw diffuse reflectance signals from normal white matter were stronger than those from epileptogenic brain, especially between 450 and . However, this feature disappeared at normalization. 3.5.Normal Gray Matter Versus Epileptogenic BrainIn contrast, fluorescence and diffuse reflectance spectroscopy were found to be effective at separating gray matter from epileptogenic brain. Differences with statistical significance were identified in all normalized fluorescence and diffuse reflectance spectra (Fig. 3 ). While not shown, raw diffuse reflectance signals from epileptogenic brain were significantly higher than those from normal gray matter. Within the normalized diffuse reflectance spectra, the spectral maximum for normal gray matter was identified at , and the maximum for epileptogenic brain was close to . Raw fluorescence signals from epileptogenic brain specimens were noticeably weaker at excitation than those from gray matter. An opposite trend, however, was observed in the fluorescence spectra at excitation. At excitation, normalized fluorescence signals from epileptogenic lesions were significantly stronger than those from gray matter [Fig. 3d]. Fig. 3Comparisons of (a) normalized diffuse reflectance spectra, (b) normalized fluorescence emission spectra at excitation, (c) normalized fluorescence emission spectra at excitation, and (d) normalized fluorescence emission spectra at excitation between normal gray matter and epileptogenic brain . standard deviation spectra are plotted.  Table 4Accuracy of the classification algorithms derived using the spectral features identified through t-tests. The discrimination algorithms were developed using linear discriminant analysis in Statistical Package for the Social Sciences, with either fluorescence F(λx,λm) , diffuse reflectance Rd(λm) , or both features combined as the inputs, indicated by the x symbols in the columns labeled Spectral Feature Used. The bold numbers in the Sensitivity and Specificity columns indicate the best performance of all the discrimination algorithms produced. The Total Correct Classification column provides the percentages of samples that were classified correctly by the corresponding algorithms.
3.6.Classification Algorithms and Their PerformanceTissue classification algorithms developed using the representative spectral features described before (Table 3 ) generally performed very well (Table 4 ). The algorithms that incorporated both fluorescence and diffuse reflectance spectral features produced the best combination of sensitivity and specificity; more than 80% of the samples were classified correctly. Table 3Summary of the effectiveness of raw and normalized fluorescence and diffuse reflectance spectroscopy at separating normal brain from diseased brain. XX indicates that the comparison produced a statistically significant difference at a level of p<10−5 . X indicates a statistically significant difference at a level of p<0.01 .
4.DiscussionThe results of this in vitro tissue study demonstrate that both fluorescence and diffuse reflectance spectroscopy are effective at differentiating neoplastic brain from normal brain in the pediatric population. These findings are similar to those that have been reported for the adult brain tumor population.29, 30, 33, 35 All in vitro diffuse reflectance spectra measured from pediatric brain specimens possess the spectral profile characteristics induced by hemoglobin absorption, as hemoglobin is the dominant chromophore in brain tissue within the visible spectral region. For example, the double-valley feature seen in the diffuse reflectance spectra between 500 and , especially from neoplastic brain, is a direct result of the twin absorption peaks (540 and ) of oxyhemoglobin. However, the average diffuse reflectance spectra from normal gray matter, normal white matter, and epileptogenic brain exhibit a single valley profile in the same wavelength region. This profile discrepancy may be attributed to a certain level of hemoglobin deoxygenation in the normal and epileptogenic brain samples, because deoxyhemoglobin has a monopeak feature between 500 and . Since normal brain, and presumably, epileptogenic brain, use the aerobic metabolic pathway to produce ATP, they continuously consume all oxygen available and eventually create a condition of hypoxia (i.e., producing deoxyhemoglobin) in an in vitro condition. Conversely, neoplastic tissue often utilizes the anaerobic metabolic pathway to produce ATP and hence the hemoglobin oxygenation is maintained in neoplastic brain in vitro. The relative level of drop-off between 400 and in the normalized diffuse reflectance spectrum of brain tissue also may be used as an indicator of its hemoglobin content. In comparisons between the various normalized diffuse reflectance spectra, it was noticed that the diffuse reflectance intensities from neoplastic brain between 400 and consistently were lower than those from normal gray and white matter, which suggests higher blood content in these samples. This finding is in agreement with a common physiological characteristic of tumors: increased vascularity. In addition to the intensity variations, several spectral profile variations were revealed in the comparisons of average normalized diffuse reflectance. One identified feature is particularly intriguing: the peak location of the normalized diffuse reflectance spectra from in vitro normal cortex is located around , a significant red shift relative to those from in vivo gray matter, as well as many other tissue types.45, 46 This spectral profile characteristic may be attributed to the low blood volume in the gray matter specimens collected. It is not clear, however, if this feature is unique to the pediatric population, or if it could be reproduced in an in vivo setup, wherein blood perfusion exists. While not shown in the Results in Sec. 3, the outcomes of this study indicate that diffuse reflectance intensities between 650 and usually are the highest in white matter and the lowest in gray matter. Again, this observation is in agreement with previous reports.45, 47, 48, 49 Since there are no strong biological chromophores in this particular spectral region, the differences in diffuse reflectance intensities among all four tissue categories must reflect variations in their microscopic structural characteristics. Tissue components, like nuclei, create spatial variations in the dielectric constant (i.e., reflective indices), and hence, cause light to scatter. To simplify the description of the light propagation, biological tissue often is treated as a conglomeration of various-sized scatterers. The contribution of these scatterers to the overall scattering properties, and hence the diffuse reflectance intensity, are determined by their scattering cross sections, as well as their volume fractions. In liver tissue, mitochondria are considered to be the primary contributor to tissue scattering, because of the high volume fraction of mitochondria.50 This condition may not be applicable here, because the volume fraction of mitochondria in brain is much lower.51, 52 While not yet elucidated, the high scattering nature of white matter may be linked to its structural characteristics, which include axonal myelination, as well as the small radial dimension of the axons.45, 48, 49 The volume fractions of cells and nuclei are high in gray matter because of the high density of neuron bodies and astrocytes, which translate to low scattering properties.50, 53 Furthermore, each pediatric brain tumor type has its own unique morphological characteristics. For example, pilocytic astrocytoma is characterized by low cellularity, small nuclear size, and microcystic stroma; meanwhile, both medulloblastoma and ependymoma have high cellularity and cells containing minimal cytoplasm. These significant variations in the microscopic structural characteristics explain the large standard deviations existing in the measurements of the diffuse reflectance signals within the neoplastic brain group. The hallmark pathological features of epileptogenic brain lesions observed in this study included balloon cells, increased cell density, a reduction of pyramidal neurons and granule cells, clusters of misplaced, immature, giant neurons, and disorganization of the cortical lamination. These features apparently enhanced the scattering properties, which led to a statistically significant increase in the average diffuse reflectance signals from epileptogenic brain lesions versus those from gray matter. In this in vitro study, the raw fluorescence intensities observed at excitation in normal brain tissue were significantly greater than those observed in neoplastic brain. This observation is in agreement with data published previously.29, 30, 32, 33 At 337- and excitation, tissue fluorescence primarily originates from three biological fluorophores: NADH/NADPH, FAD, and collagen, with NADH/NADPH predominant.54 While excitation equally evokes fluorescence emission from both free and bound NADH/NADPH, excitation favors bound NADH/NADPH over free NADH/NADPH. The low fluorescence emission of neoplastic brain may be attributed to its low NADH/NADPH quantity and/or a high free-to-bound NADH ratio.32, 33 Since the intensity of fluorescence emission also is governed by tissue optical properties, especially by absorption, the high blood content of neoplastic brain also could produce a negative impact to its fluorescence emission (i.e., blood absorption of both excitation and emission light). To truly differentiate the contribution of these mechanisms, a sophisticated analytical model would be required to interpret the fluorescence spectral data.55, 56 This, however, was beyond the scope of the current study. At emission, white matter exhibited the greatest degree of fluorescence emission, whereas gray matter was lowest among the four tissue categories examined. At this particular excitation wavelength, tissue fluorescence emission originates typically from FAD, lipids, and cholesterol.54 Since myelin in white matter possesses a high lipid and cholesterol content,57, 58, 59, 60 strong fluorescence emission at excitation is expected from white matter. An increase in the quantity of lipids and macromolecules also has been reported in brain tumors,61 which may explain why fluorescence emission is elevated in tumors versus normal gray matter. Several distinctive fluorescence spectral features also can be identified in epileptogenic brain when compared to normal gray matter. For example, the average full width half maximum of the fluorescence spectrum at excitation appears to be slightly greater in epileptogenic brain versus normal gray matter. At 360- and excitation, the fluorescence spectra from epileptogenic lesions are significantly different from those from cortex. This may be attributed to the unique metabolic characteristics of epileptogenic brain lesions, which alter the balance of free and bounded NADH, or possibly other protein components yet identified. To correctly connect the fluorescence features of epileptogenic brain lesions with their physiological features, further studies examining the molecular and microscopic structural characteristics of epileptogenic brain must be undertaken. While neither fluorescence nor diffuse reflectance spectroscopy is effective at separating white matter from epileptogenic lesions, this poses less of a concern, because epileptogenic lesions generally are found in gray matter. 5.ConclusionsAn in vitro tissue study is conducted to explore the feasibility of using diffuse reflectance and fluorescence spectroscopy to differentiate normal brain from neoplastic and epileptogenic brain within the pediatric population. Significant variations in both absolute intensities and profiles are observed in both raw and normalized diffuse reflectance and fluorescence spectra from normal white and gray matter, neoplastic brain, and epileptogenic brain. These variations are associated with the unique compositional and structural characteristics of each brain tissue type. AcknowledgmentsThis work was supported by the Thrasher Research Fund and the Ware Foundation Research Endowment. References, Cancer Facts and Figures 2005,
(2005) Google Scholar
R. T. Baldwin and S. Preston-Martin,
“Epidemiology of brain tumors in childhood—a review,”
Toxicol. Appl. Pharmacol., 199
(2), 118
–131
(2004). 0041-008X Google Scholar
S. Shinnar and J. M. Pellock,
“Update on the epidemiology and prognosis of pediatric epilepsy,”
J. Child Neurol., 17 S4
–17
(2002). 0883-0738 Google Scholar
M. D. Ris and R. B. Noll,
“Long-term neurobehavioral outcome in pediatric brain-tumor patients: review and methodological critique,”
J. Clin. Exp. Neuropsychol, 16
(1), 21
–42
(1994). 0168-8634 Google Scholar
J. T. Rutka and J. S. Kuo,
“Pediatric surgical neuro-oncology: current best care practices and strategies,”
J. Neuro-Oncol., 69
(1–3), 139
–150
(2004). 0167-594X Google Scholar
O. C. Snead 3rd,
“Surgical treatment of medically refractory epilepsy in childhood,”
Brain Dev., 23
(4), 199
–207
(2001). 0387-7604 Google Scholar
R. J. Hudgins, J. R. Flamini, S. Palasis, R. Cheng, T. G. Burns, and C. L. Gilreath,
“Surgical treatment of epilepsy in children caused by focal cortical dysplasia,”
Pediatr. Neurosurg., 41
(2), 70
–76
(2005). 1016-2291 Google Scholar
I. F. Pollack, D. Claassen, Q. al-Shboul, J. E. Janosky, and M. Deutsch,
“Low-grade gliomas of the cerebral hemispheres in children: an analysis of 71 cases,”
J. Neurosurg., 82
(4), 536
–547
(1995). 0022-3085 Google Scholar
K. N. Fountas, D. W. King, K. J. Meador, G. P. Lee, and J. R. Smith,
“Epilepsy in cortical dysplasia: factors affecting surgical outcome,”
Stereotact. Funct. Neurosurg., 82
(1), 26
–30
(2004). 1011-6125 Google Scholar
E. R. Laws Jr., W. F. Taylor, M. B. Clifton, and H. Okazaki,
“Neurosurgical management of low-grade astrocytoma of the cerebral hemispheres,”
J. Neurosurg., 61
(4), 665
–673
(1984). 0022-3085 Google Scholar
T. Kral, S. Kuczaty, I. Blumcke, H. Urbach, H. Clusmann, O. D. Wiestler, C. Elger, and J. Schramm,
“Postsurgical outcome of children and adolescents with medically refractory frontal lobe epilepsies,”
Childs Nerv. Syst., 17
(10), 595
–601
(2001). 0256-7040 Google Scholar
J. M. Paolicchi, P. Jayakar, P. Dean, I. Yaylali, G. Morrison, A. Prats, T. Resnik, L. Alvarez, and M. Duchowny,
“Predictors of outcome in pediatric epilepsy surgery,”
Neurology, 54
(3), 642
–647
(2000). 0028-3878 Google Scholar
L. Tassi, N. Colombo, R. Garbelli, S. Francione, G. Lo Russo, R. Mai, F. Cardinale, M. Cossu, A. Ferrario, C. Galli, M. Bramerio, A. Citterio, and R. Spreafico,
“Focal cortical dysplasia: neuropathological subtypes, EEG, neuroimaging and surgical outcome,”
Brain, 125 1719
–1732
(2002). 0006-8950 Google Scholar
S. Patil, L. Biassoni, and L. Borgwardt,
“Nuclear medicine in pediatric neurology and neurosurgery: epilepsy and brain tumors,”
Semin Nucl. Med., 37
(5), 357
–381
(2007). 0001-2998 Google Scholar
G. H. Barnett, C. P. Steiner, and D. W. Roberts,
“Surgical navigation system technologies,”
Image-Guided Neurosurgery: Clinical Applications of Surgical Navigation, 17
–32 Quality Medical Publishing, Inc., St. Louis, MO
(1998). Google Scholar
N. Dorward, O. Alberti, B. Velani, F. Gerritsen, W. Harkness, N. Kitchen, and D. Thomas,
“Postimaging brain distortion: magnitude, correlates, and impact on neuronavigation,”
J. Neurosurg., 88
(4), 656
–662
(1998). 0022-3085 Google Scholar
D. Hill, C. J. Maurer, R. Maciunas, J. Barwise, J. Fitzpatrick, and M. Wang,
“Measurement of intraoperative brain surface deformation under a craniotomy,”
Neurosurgery, 43
(3), 514
–526
(1998). 0148-396X Google Scholar
P. LeRoux, T. Winter, M. Berger, L. Mack, K. Wang, and J. Elliott,
“A comparison between preoperative magnetic resonance and intraoperative ultrasound tumor volumes and margins,”
J. Clin. Ultrasound, 22
(1), 29
–36
(1994). 0091-2751 Google Scholar
R. J. Maciunas,
“Pitfalls,”
Image-Guided Neurosurgery: Clinical Applications of Surgical Navigation, 43
–60 Quality Medical Publishing, Inc., St. Louis, MO
(1998). Google Scholar
D. S. Babcock, L. L. Barr, and K. R. Crone,
“Intraoperative uses of ultrasound in the pediatric neurosurgical patient,”
Pediatr. Neurosurg., 18
(2), 84
–91
(1992). 1016-2291 Google Scholar
J. Roth, L. Beni-Adani, N. Biyani, and S. Constantini,
“Classical and real-time neuronavigation in pediatric neurosurgery,”
Childs Nerv. Syst., 22
(9), 1065
–1071
(2006). 0256-7040 Google Scholar
L. Tassi, B. Pasquier, L. Minotti, R. Garbelli, P. Kahane, A. L. Benabid, G. Battaglia, C. Munari, and R. Spreafico,
“Cortical dysplasia: electroclinical, imaging, and neuropathologic study of 13 patients,”
Epilepsia, 42
(9), 1112
–1123
(2001). 0013-9580 Google Scholar
F. Chassoux, B. Devaux, E. Landre, B. Turak, F. Nataf, P. Varlet, J. P. Chodkiewicz, and C. Daumas-Duport,
“Stereoelectroencephalography in focal cortical dysplasia: a 3D approach to delineating the dysplastic cortex,”
Brain, 123 1733
–1751
(2000). 0006-8950 Google Scholar
I. J. Bigio and S. G. Bown,
“Spectroscopic sensing of cancer and cancer therapy: current status of translational research,”
Cancer Biol. Ther., 3
(3), 259
–267
(2004). Google Scholar
N. Ramanujam,
“Fluorescence spectroscopy of neoplastic and non-neoplastic tissues,”
Neoplasia, 2
(1–2), 89
–117
(2000). https://doi.org/10.1038/sj.neo.7900077 1522-8002 Google Scholar
R. Richards-Kortum and E. Sevick-Muraca,
“Quantitative optical spectroscopy for tissue diagnosis,”
Annu. Rev. Phys. Chem., 47 555
–606
(1996). https://doi.org/10.1146/annurev.physchem.47.1.555 0066-426X Google Scholar
K. Sokolov, M. Follen, and R. Richards-Kortum,
“Optical spectroscopy for detection of neoplasia,”
Curr. Opin. Chem. Biol., 6
(5), 651
–658
(2002). https://doi.org/10.1016/S1367-5931(02)00381-2 1367-5931 Google Scholar
R. X. Xu and S. P. Povoski,
“Diffuse optical imaging and spectroscopy for cancer,”
Expert Rev. Med. Dev., 4
(1), 83
–95
(2007). Google Scholar
S. A. Toms, W.-C. Lin, R. J. Weil, M. D. Johnson, E. D. Jansen, and A. Mahadevan-Jansen,
“Intraoperative optical spectroscopy identifies infiltrating glioma margins with high sensitivity,”
Neurosurgery, 57 382
–391
(2005). 0148-396X Google Scholar
W. C. Lin, S. A. Toms, M. Johnson, E. D. Jansen, and A. Mahadevan-Jansen,
“In vivo brain tumor demarcation using optical spectroscopy,”
Photochem. Photobiol., 73
(4), 396
–402
(2001). https://doi.org/10.1562/0031-8655(2001)073<0396:IVBTDU>2.0.CO;2 0031-8655 Google Scholar
R. Andrews, R. Mah, A. Aghevli, K. Freitas, A. Galvagni, M. Guerrero, R. Papsin, C. Reed, and D. Stassinopoulos,
“Multimodality stereotactic brain tissue identification: the NASA smart probe project,”
Stereotact. Funct. Neurosurg., 73
(1–4), 1
–8
(1999). 1011-6125 Google Scholar
G. Bottiroli, A. C. Croce, D. Locatelli, R. Nano, E. Giombelli, A. Messina, and E. Benericetti,
“Brain tissue autofluorescence: an aid for intraoperative delineation of tumor resection margins,”
Cancer Detect. Prev., 22
(4), 330
–339
(1998). https://doi.org/10.1046/j.1525-1500.1998.CDOA34.x 0361-090X Google Scholar
A. C. Croce, S. Fiorani, D. Locatelli, R. Nano, M. Ceroni, F. Tancioni, E. Giombelli, E. Benericetti, and G. Bottiroli,
“Diagnostic potential of autofluorescence for an assisted intraoperative delineation of glioblastoma resection margins,”
Photochem. Photobiol., 77
(3), 309
–318
(2003). https://doi.org/10.1562/0031-8655(2003)077<0309:DPOAFA>2.0.CO;2 0031-8655 Google Scholar
L. Marcu, J. A. Jo, P. V. Butte, W. H. Yong, B. K. Pikul, K. L. Black, and R. C. Thompson,
“Fluorescence lifetime spectroscopy of glioblastoma multiforme,”
Photochem. Photobiol., 80 98
–103
(2004). https://doi.org/10.1562/2003-12-09-RA-023.1 0031-8655 Google Scholar
M. M. Haglund, M. S. Berger, and D. W. Hochman,
“Enhanced optical imaging of human gliomas and tumor margins,”
Neurosurgery, 38
(2), 308
–317
(1996). 0148-396X Google Scholar
S. Koljenovic, T. C. Schut, R. Wolthuis, A. J. Vincent, G. Hendriks-Hagevi, L. Santos, J. M. Kros, and G. J. Puppels,
“Raman spectroscopic characterization of porcine brain tissue using a single fiber-optic probe,”
Anal. Chem., 79
(2), 557
–564
(2007). 0003-2700 Google Scholar
S. Utsuki, H. Oka, S. Sato, S. Suzuki, S. Shimizu, S. Tanaka, and K. Fujii,
“Possibility of using laser spectroscopy for the intraoperative detection of nonfluorescing brain tumors and the boundaries of brain tumor infiltrates. Technical note,”
J. Neurosurg., 104
(4), 618
–620
(2006). 0022-3085 Google Scholar
W. H. Yong, P. V. Butte, B. K. Pikul, J. A. Jo, Q. Fang, T. Papaioannou, K. Black, and L. Marcu,
“Distinction of brain tissue, low grade and high grade glioma with time-resolved fluorescence spectroscopy,”
Front. Biosci., 11 1255
–1263
(2006). https://doi.org/10.2741/1878 1093-4715 Google Scholar
S. Bahar, M. Suh, M. Zhao, and T. H. Schwartz,
“Intrinsic optical signal imaging of neocortical seizures: the ‘epileptic dip’,”
NeuroReport, 17
(5), 499
–503
(2006). https://doi.org/10.1097/01.wnr.0000209010.78599.f5 0959-4965 Google Scholar
M. M. Haglund,
“Intraoperative optical imaging of epileptiform and functional activity,”
Neurosurg. Clin. N. Am., 8
(3), 413
–420
(1997). 1042-3680 Google Scholar
M. M. Haglund and D. W. Hochman,
“Optical imaging of epileptiform activity in human neocortex,”
Epilepsia, 45 43
–47
(2004). 0013-9580 Google Scholar
M. M. Haglund, G. A. Ojemann, and D. W. Hochman,
“Optical imaging of epileptiform and functional activity in human cerebral cortex,”
Nature (London), 358
(6388), 668
–671
(1992). https://doi.org/10.1038/358668a0 0028-0836 Google Scholar
T. H. Schwartz,
“The application of optical recording of intrinsic signals to simultaneously acquire functional, pathological and localizing information and its potential role in neurosurgery,”
Stereotact. Funct. Neurosurg., 83
(1), 36
–44
(2005). 1011-6125 Google Scholar
M. Zhao, M. Suh, H. Ma, C. Perry, A. Geneslaw, and T. H. Schwartz,
“Focal increases in perfusion and decreases in hemoglobin oxygenation precede seizure onset in spontaneous human epilepsy,”
Epilepsia, 48
(11), 2059
–2067
(2007). https://doi.org/10.1111/j.1528-1167.2007.01229.x 0013-9580 Google Scholar
S. C. Gebhart, W. C. Lin, and A. Mahadevan-Jansen,
“In vitro determination of normal and neoplastic human brain tissue optical properties using inverse adding-doubling,”
Phys. Med. Biol., 51
(8), 2011
–2027
(2006). https://doi.org/10.1088/0031-9155/51/8/004 0031-9155 Google Scholar
W.-C. Lin, S. A. Toms, M. Motamedi, E. D. Jansen, and A. Mahadevan-Jansen,
“Brain tumor demarcation using optical spectroscopy; an in vitro study,”
J. Biomed. Opt., 5
(2), 214
–220
(2000). https://doi.org/10.1117/1.429989 1083-3668 Google Scholar
H. R. Eggert and V. Blazek,
“Optical properties of human brain tissue, meninges, and brain tumors in the spectral range of ,”
Neurosurgery, 21
(4), 459
–464
(1987). 0148-396X Google Scholar
H. R. Eggert and V. Blazek,
“Optical properties of normal human intracranial tissues in the spectral range of ,”
Adv. Exp. Med. Biol., 333 47
–55
(1993). 0065-2598 Google Scholar
L. O. Svaasand and R. Ellingsen,
“Optical properties of human brain,”
Photochem. Photobiol., 38
(3), 293
–299
(1983). https://doi.org/10.1111/j.1751-1097.1983.tb02674.x 0031-8655 Google Scholar
B. Beauvoit, T. Kitai, and B. Chance,
“Contribution of the mitochondrial compartment to the optical properties of the rat liver: a theoretical and practical approach,”
Biophys. J., 67
(6), 2501
–2510
(1994). https://doi.org/10.1016/S0006-3495(94)80740-4 0006-3495 Google Scholar
K. L. Veltri, M. Espiritu, and G. Singh,
“Distinct genomic copy number in mitochondria of different mammalian organs,”
J. Cell Physiol., 143
(1), 160
–164
(1990). 0021-9541 Google Scholar
P. S. Coburn-Litvak, D. A. Tata, H. E. Gorby, D. P. McCloskey, G. Richardson, and B. J. Anderson,
“Chronic corticosterone affects brain weight, and mitochondrial, but not glial volume fraction in hippocampal area CA3,”
Neuroscience, 124
(2), 429
–438
(2004). 0306-4522 Google Scholar
A. Ishimaru, Wave Propagation and Scattering in Random Media,
(1978) Google Scholar
R. S. DaCosta, H. Andersson, and B. C. Wilson,
“Molecular fluorescence excitation-emission matrices relevant to tissue spectroscopy,”
Photochem. Photobiol., 78
(4), 384
–392
(2003). https://doi.org/10.1562/0031-8655(2003)078<0384:MFEMRT>2.0.CO;2 0031-8655 Google Scholar
Y. Wu and J. Y. Qu,
“Autofluorescence spectroscopy of epithelial tissues,”
J. Biomed. Opt., 11
(5), 054023
(2006). https://doi.org/10.1117/1.2362741 1083-3668 Google Scholar
Q. Zhang, M. G. Miller, J. Wu, and M. S. Feld,
“Turbidity-free fluorescence spectroscopy of biological tissue,”
Opt. Lett., 25
(19), 1451
–1453
(2000). https://doi.org/10.1364/OL.25.001451 0146-9592 Google Scholar
A. J. Jones and M. G. Rumsby,
“The intrinsic fluorescence characteristics of the myelin basic protein,”
J. Neurochem., 25
(5), 565
–572
(1975). 0022-3042 Google Scholar
C. Krafft, L. Neudert, T. Simat, and R. Salzer,
“Near infrared Raman spectra of human brain lipids,”
Spectrochim. Acta, Part A, 61
(7), 1529
–1535
(2005). 0584-8539 Google Scholar
C. Krafft, S. B. Sobottka, G. Schackert, and R. Salzer,
“Near infrared Raman spectroscopic mapping of native brain tissue and intracranial tumors,”
Analyst (Cambridge, U.K.), 130
(7), 1070
–1077
(2005). https://doi.org/10.1039/b419232j 0003-2654 Google Scholar
J. S. O’Brien and E. L. Sampson,
“Lipid composition of the normal human brain: gray matter, white matter, and myelin,”
J. Lipid Res., 6
(4), 537
–544
(1965). 0022-2275 Google Scholar
D. O. Slosman and F. Lazeyras,
“Metabolic imaging in the diagnosis of brain tumors,”
Curr. Opin. Neurol., 9
(6), 429
–435
(1996). 1350-7540 Google Scholar
|
||||||||||||||||||||||||||||||||||||||||||||||||||||||||||||||||||||||||||||||||||||||||||||||||||||||||||||||||||||||||||||||||||||||||||||||||||||||||||||||||||||||||||||||||||||


