

|
|
1.IntroductionDrosophila, one of the most valuable model animals in genetics and developmental biology, has been exploited in studies of carbohydrate, sterol, and lipid metabolism in recent years.1 Most of the basic metabolic functions in human are found in Drosophila, and many enzymes and metabolic pathways are conserved between men and flies. The vast majority of disease-related genes in humans has Drosophila homologs. 1, 2 Experimentally, they are relatively easy to manipulate, are cost-effective, and have a short life cycle. Many genomic tools have been developed for Drosophila, which allow the study of the molecular function of a given gene. 1, 2 The studies in Drosophila can provide new insights into the regulatory mechanisms and pathways of metabolism, and improve the understanding of metabolic disorders in humans, such as diabetes and obesity. 1, 2 The Drosophila fat body is analogous to the liver and adipose tissue in mammals. It is an organ that stores lipids and feeds the developing animal during its larval stages. It is also involved in lipid metabolism and hormone production. 3, 4 The study of lipid droplets in Drosophila fat cells also shows that the proteins on these storage structures are similar in form and function to those in mammal adipose tissue. 3, 4 At the early stages of metamorphosis, the fat body transforms from an organized tissue to individual fat cells. This process is called fat body remodeling.5 However, little is known about the physiological importance or the regulation of this process.6 Fluorescence microscopy is one of the most popular imaging methods used in biological researches. However, it requires fluorophore-labeling by using either biochemical probes for staining with fixation5 or genetic mutant fluorescent proteins for in vivo imaging.6 On the other hand, the nonlinear optical microscopy including two-photon excitation autofluorescence (TPE-F), second-harmonic generation (SHG), and third-harmonic generation (THG) have shown their ability to achieve label-free imaging. 7, 8, 9 The development of Drosophila embryo was investigated in vivo by TPE-F and THG microscopy,7 and the internal organs and developing muscles were visualized in vivo in Drosophila larva by TPE-F and SHG microscopy.9 Moreover, the trafficking dynamics of non-autofluorescent lipid bodies were observed in vivo in the developing embryo by THG microscopy.8 In the studies of the Drosophila fat body, however, no adequate label-free imaging technique has been presented, especially at the larval and pupal stages. The coherent anti-Stokes Raman scattering (CARS) microscopy provides a useful tool for this need. 10, 11, 12, 13, 14, 15, 16, 17, 18, 19, 20, 21, 22, 23, 24, 25, 26, 27, 28, 29, 30 CARS signal is based on Raman vibrational modes of molecules. When two laser beams, one for pump/probe beam and the other for Stokes beam, are temporarily and spatially overlapped in the sample with their wavelengths tuned at the wavenumber difference matching the Raman vibrational mode of the sample, the enhanced signal of coherent anti-Stokes Raman scattering (CARS) is produced. Although the first CARS microscopy was reported in 1982,11 it did not become widely used until 199912 because of the Ti-sapphire laser and the modern design. Currently, CARS microscopy is widely applied to image the lipid molecules due to the strong CARS signal from high density of C–H bonds stretching mode at ~2845 cm−1. 10, 13 CARS microscopy has been employed not only in the cellular system, but also in ex vivo/in vivo biomedical researches.13 Such works on lipids include myelin sheath in nerve tissues, 14, 15, 16 atherosclerosis in arteries, 17, 18, 19, 20 and mouse hepatic tissues.21 CARS imaging has been proved to be a useful tool for in vivo study of model animals like the mouse 15, 16, 22, 23 and Caenorhabditis elegans. 24, 25, 26, 27 In the light of this, we attempt to apply CARS microscopy to in vivo imaging of Drosophila. Together with TPE-F microscopy, we have successfully obtained depth-resolved images of a second instar larva, which yielded the structural information of internal organs including trachea, gut, and fat body. At the subcellular level, we also monitored the fat body remodeling at the pupal stage during metamorphosis. Without labeling, CARS/TPE-F microscopy allows us to achieve long-term observation of this process with minimal damage and perturbation. From time-lapse images, the degradation of lipid droplets and the increase in autofluorescence were observed in individual fat cells. We further quantitatively analyzed this process by measuring the size of lipid droplets and the intensity ratio of autofluorescence to CARS in each cell. 2.Materials and Methods2.1.DrosophilaDrosophila melanogasters (w1118) were raised at 25 °C using a standard agar diet (1% autolysed yeast, 5.8% cornmeal, 5% glucose, 0.6% agar) unless stated otherwise. Before observation, the larvae were anesthetized by exposure to ether fume for 5 min. During observation, the carbon dioxide (CO2) gas was purged onto larvae to keep them anesthetized. Temperature was kept in 22 °C during observation. 2.2.Oil Red O StainingThe procedure for staining Drosophila larval fat body is as follows: larvae were partially dissected in phosphate buffered saline (PBS) and fixed in 4% paraformaldehyde for 10 min, rinsed with distilled water, and then incubated in Oil Red O stain containing Oil Red O (Sigma-Aldrich, UK) dissolved in isopropanol/water (1:1) for 20 min. After staining, the specimens were rinsed with distilled water and ready for imaging, by bright field microscopy incorporated with a CCD camera or by CARS microscopy. 2.3.CARS/TPE-F MicroscopyIn the setup, one Ti-sapphire laser (Mira-900P, Coherent, CA, USA) with 2.5-ps pulse width serves as pump/probe beam, and the other Ti-sapphire laser (Mira-900F) with 200-fs pulse width serves as Stokes beam in CARS, both are at 76 MHz repetition rate (Fig. 1). Here the 200-fs pulsed Ti-sapphire laser can provide better efficiency of nonlinear excitation such as TPE-F. Both lasers are pumped by a Nd:YVO4 laser (Verdi-10W, Coherent, Santa Clara, CA). An additional synchronization system (Synchro-Lock, Coherent, Santa Clara, CA) is applied to synchronize the two laser pulses. The laser beams are collinearly combined and directed into a laser scanning microscope (FV300 and IX-71, Olympus, Tokyo, Japan), and focused onto the sample by a 40X N.A. = 0.9 objective (UPLSAPO 40X, Olympus, Tokyo, Japan) or a 60X N.A. = 1.2 water immersion objective (UPLSAPO 60XW, Olympus, Tokyo, Japan). To obtain CARS imaging of lipid C–H stretching mode at ~2845 cm−1, the pump/probe beam is tuned at ~706 nm and the Stocks beam is tuned at ~883 nm, with 25 and 20 mW at the sample, respectively. The forward CARS (F-CARS) signal (at ~588 nm) is collected by an air condenser (N.A. = 0.55), passing through a set of band-pass filters (FF01-630/92 and FF01-590/10, Semrock, Rochester, NY) and detected by a PMT (R7400U-02, Hamamatsu, Iwata-City, Japan). The TPE-F imaging is obtained simultaneously with CARS. The fluorescence is collected by the same objective (epi-detection), passing through a short-pass dichroic mirror (685SPXR, Chroma, Bellows Falls, VT) and a band-pass filter (FF01-510/84, Semrock, NY), detected by a PMT (R3896, Hamamatsu, Japan). The scan speed is 3.26 s for all images. A total of 22 images were collaected for each “whole larva” image in Figs. 3b, 3c, 3d, 3e by operating the manual stage in the XY-plane and the PZT-objective in the Z-depth. The acquisition time for each whole larva image was ~120 sec including stage operation time. The intensity ratio of autofluorescence to CARS signal in fat cells was analyzed by Image-J. 3.Results and DiscussionThe capability of the CARS microscopy was evaluated on imaging of Drosophila fat body by comparing with conventional biochemical staining. Fig. 2a shows the bright field image of dissected larval tissues (the fat body attached to the salivary gland) stained with Oil Red O, and Fig. 2b shows the corresponding CARS image obtained at ~2845 cm−1 for lipid imaging. Oil Red O is a dye for triglycerides and lipids, thus only the fat body of the larval tissues is stained [Fig. 2a]. Similarly, the CARS image clearly shows the lipid droplets in the fat body [Fig. 2b]. The CARS spectrum of lipid droplets in the fat body was recorded and shown in Fig. 2c. Although it is broad and looses fine structures due to excitation of broadband femtosecond laser and nonresonant background, this spectrum still resembles that of lipids with aliphatic C–H vibration at ~2845 cm−1, at which we set our pump/probe and Stokes beam wavelengths for imaging. This demonstrates that CARS microscopy is able to image fat body and fat tissues specifically. Fig. 2Larval tissues stained by Oil Red O: (a) bright-field image and (b) CARS image at ~2845 cm−1. (c) The CARS spectrum of lipid droplets in the fat body. 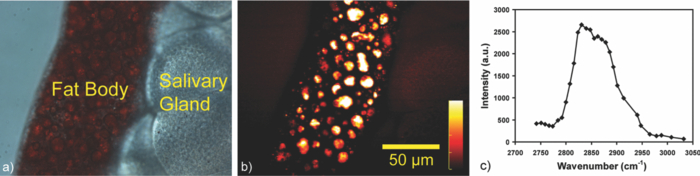 CARS/TPE-F microscopy was also applied to the label-free imaging of Drosophila second-instar larva in vivo (Fig. 3). We have first tested the toxicity of excitation lasers to larva. It is found that 14 out of 16 larvae (~88%) survived and developed into living pupae under the same laser irradiation, while 10 out of 11 (~91%) survived without any irradiation for the control. Thus, we believe that the laser irradiation causes little toxicity to Drosophila larva. In Fig. 3, the second-instar larva was chosen because their internal organs have started developing at this stage but their thickness is still small enough (~200–300 μm) which allows the forward-detection of CARS and epi-detection of autofluorescence. A schematic drawing in Fig. 3a shows internal organs such as trachea, gut, and fat body of a larva.31 Taking advantage of nonlinear optics, sectioning images were obtained by focusing at different depths (from 5 to 40 μm) in an anesthetized larva, as shown in Figs. 3b, 3c, 3d, 3e. Here a 60X NA = 1.2 water immersion objective was used. The fat body and fat tissues are resolved from the CARS signal (pseudo-colored in red), and the outer surface and other internal organs including trachea and gut are resolved from the TPE-F signal (pseudo-colored in green). The detailed images are shown in Figs. 3f, 3g, 3h, 3i. These images show that the fat body has many thin lobes which distribute throughout the larva body, and extends from the anterior to the posterior region. It surrounds other organs and intimately associates with the gut [Figs. 3c and 3h], which can facilitate the uptake and release of metabolites and nutrients. 4, 32 One can also observe some fat tissues around the trachea at the posterior end [Fig. 3g]. With careful examination of the gut, many lipid droplets distributed around the lumen and the interspaces between the fat body and gut are observed [Fig. 3i, in the red box]. The midgut cells hydrolyze the dietary fat into fatty acids, absorb and convert them into diacylglycerol (DAG) or triacylglycerol (TAG), and store them in the fat body.33 These lipid droplets may play a role in delivering nutrients and fats [Fig. 3i]. The structure and distribution of these observed organs are consistent with previous reports. 4, 31, 32, 34 To the best of our knowledge, this is the first demonstration of the fat body and other organs in living Drosophila without any labeling. Fig. 3(a) A schematic drawing shows internal organs of a Drosophila larva. (b)–(i) Label-free imaging of Drosophila second-instar larva in vivo by CARS/TPE-F microscopy, at depths 5(b), 20(c), 30(d), and 40 μm(e). Detailed images in (c) (red boxes) are shown in (f) to (i). (Red: CARS, Green: autofluorescence) (Color online only.) 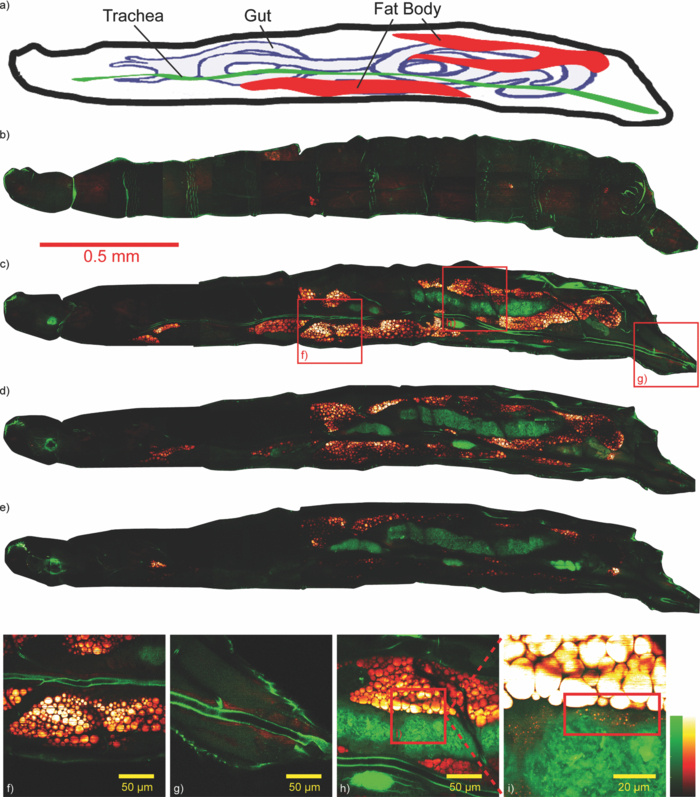 We further investigated the fat body remodeling at the early stages of metamorphosis. At the stage of late third-instar, the pupariation is triggered by a large rise in ecdysteroid hormone titer in the hemolymph, and the larva becomes immobile and forms a “white prepupa,” followed by the hardening and tanning of the larval cuticle and the formation of the “puparium.”5 After the puparium formation (APF), the fat body remodeling occurs during the apolysis and the retraction of the fat body, followed by the head eversion and the pupation, and finally into the pupal stage.5 In order to observe this process, we started at the time of the puparium formation (APF ~0 h) and took time-lapse images, as shown in Figs. 4(a) (bright field image) and 4(b)–4(f) (CARS/TPE-F image). Since the pupa has brownish cuticles and is more opaque than the larva, the image quality is not as good as the larva in Fig. 3. Here a 40X objective was used for the larger field of view. After imaging, the pupa was carefully kept until eclosion, which normally takes about 4–5 days to guarantee that the developmental process was not perturbed by the imaging method. At APF = 0 h, the fat body had the same morphology as in the larva and distributed all over the space [Fig. 4b]. At APF ~5 h, apolysis occurred and some of the individual fat cells were recognized [Fig. 4c], indicating the dissociation of the fat body. At APF ~10 h, the fat body became looser and more fat cells were dissociated with each other [Fig. 4d]. After APF ~18 h, most parts of the fat body dissociated [Figs. 4e and 4f] and many fat cells were released, which were spherical in shape and distributed throughout the space inside the pupa. Fig. 4Label-free imaging of Drosophila pupa in vivo by CARS/TPE-F microscopy. Bright field image (a) and the field of view in the red square at APF = 0(b), 5(c), 10(d), 18(e), 28 h(f) during metamorphosis, respectively. (Red: CARS, Green: autofluorescence) (Color online only.)  Interestingly, in addition to the lipid droplets, one can also see some autofluorescence in fat cells. The autofluorescence in the fat cells was previously found during the fat body remodeling.6 We further characterized this phenomenon in detail from the subcellular images [Figs. 5a, 5b, 5c, 5d, 5e, 5f, 5g, 5h, 5i, 5j]. Here a 60X NA = 1.2 water immersion objective was used. In the beginning, there was only slight autofluorescence shown in the fat cells [Figs. 5a, 5b, 5c, 5d, 5e]. During the fat body remodeling, more and more fat cells exhibited increase in the autofluorescent globules accompanied with decrease in the lipid droplets [Figs. 5f, 5g, 5h, 5i, 5j]. According to the earlier studies of the evolution time, the cell pattern, and the emission wavelength, 34, 35, 36 the origin of this autofluorescence is assigned to kynurenine. Kynurenine is a metabolite of the amino acid tryptophan, which can be utilized as a precursor of brown eye pigments in Drosophila.35 The light blue fluorescence starts to appear in the anterior region of the fat body shortly before pupation, and the fluorescence becomes much stronger when kynurenine is adsorbed on protein globules.34 At the subcellular level, these fluorescent globules and lipid droplets were clearly resolved in CARS/TPE-F images [Figs. 5a, 5b, 5c, 5d, 5e, 5f, 5g, 5h, 5i, 5j]. Moreover, we measured the size (diameter) of each lipid droplet and the intensity ratio of autofluorescence to CARS signal in fat cells. The lipid droplets as an energy source were consumed in metamorphosis, and this was revealed by the decrease in large ones during pupation. We counted the numbers of all lipid droplets and the “large” ones (>5 μm) shown in the images of each pupa, and the percentage of large lipid droplets is shown in Fig. 5(k). The total amount of large lipid droplets (>5 μm) declined to nearly 50% of that in the beginning (percentage from ~13% down to ~7%) [Fig. 5(k)]. On the other hand, the intensity ratio of autofluorescence to CARS signal increases with time and reached the highest around 18 h APF [Fig. 5f], which is consistent with the previous report about kynurenine content during metamorphosis.34 This finding suggests that the fat cells play a role not only in the storage of fat as the energy source, but also as a site for protein recruitment, which both are required during metamorphosis. Compared with traditional methods, this label-free and in vivo imaging allows direct monitoring and offers more information of the developing process in Drosophila. Fig. 5(a)–(j) Detailed images of fat cells in Drosophila pupa during metamorphosis at APF = 0, 5, 10, 12, 14, 16, 18, 22, 25, 28 h, respectively. (Red: CARS, Green: autofluorescence.) (k) The percentage of large lipid droplets (>5 μm) in each pupa and (l) the average intensity ratio of autofluorescence to CARS, at different APF time. [Three colors in (k) and (l) represent the data collected from three Drosophila pupae. Error bars in (k) represent the estimated counting error, and in (l) represent the standard deviation in the average value of 15–20 fat cells.] (Color online only.)  4.ConclusionIn this work, CARS/TPE-F microscopy was applied to achieve label-free imaging of Drosophila in vivo both at larval and pupal stages at the subcellular level. The fat body and internal organs such as the trachea and gut were clearly resolved at different depths in the second-instar larva, giving the structural information and distribution of these organs. Careful examination allowed us to observe many lipid droplets in the interspaces between the fat body and the gut, which may play a role in the regulation and storage of absorbed nutrients. We further investigated the fat body remodeling at the early stages of metamorphosis and monitored the dissociation of the fat body into individual fat cells. During the fat body remodeling, we found an increase in autofluorescence associated with a degradation of lipid droplets in each fat cell. Further measurement of the size of lipid droplets and intensity ratio of autofluorescence to CARS signal may improve our understanding of metamorphosis and lipid metabolism in Drosophila. This work demonstrates the feasibility of CARS/TPE-F microscopy to the in vivo study of Drosophila. AcknowledgmentsThis work was supported by Academia Sinica and the National Science Council of the Republic of China (Grant NSC-98-2113-M001-025). We would like to acknowledge fly core facility in College of Medicine, National Taiwan University for experimental materials and technique supports. ReferencesK. D. Baker and
C. S. Thummel,
“Diabetic larvae and obese flies – emerging studies of metabolism in Drosophila,”
Cell Metabolism, 6
(4), 257
–266
(2007). https://doi.org/10.1016/j.cmet.2007.09.002 Google Scholar
K. N. Bharucha,
“The epicurean fly: using Drosophila melanogaster to study metabolism,”
Pediatric Research, 65
(2), 132
–137
(2009). https://doi.org/10.1203/PDR.0b013e318191fc68 Google Scholar
A. Schlegel and
D. Y. R. Stainier,
“Lessons from “lower” organisms: what worms, flies, and zebrafish can teach us about human energy metabolism,”
PLoS Genetics, 3
(11), 2037
–2048
(2007). https://doi.org/10.1371/journal.pgen.0030199 Google Scholar
E. L. Arrese and
J. L. Soulages,
“Insect fat body: energy, metabolism, and regulation,”
Annu. Rev. Entomol., 55 207
–225
(2010). https://doi.org/10.1146/annurev-ento-112408-085356 Google Scholar
D. K. Hoshizaki,
“Fat-cell development,”
Comprehensive Molecular Insect Science, 315
–345 Elsevier, New York(2005). https://doi.org/10.1016/B0-44-451924-6/00025-9 Google Scholar
A. Nelliot, N. Bond, and
D. K. Hoshizaki,
“Fat-body remodeling in Drosophila melanogaster,”
genesis, 44 396
–400
(2006). https://doi.org/10.1002/dvg.20229 Google Scholar
W. Supatto, D. Debarre, B. Moulia, E. Brouzes, J. L. Martin, E. Farge, and
E. Beaurepaire,
“In vivo modulation of morphogenetic movements in Drosophila embryos with femtosecond laser pulses,”
Proc. Natl. Acad. Sci. U.S.A., 102
(4), 1047
–1052
(2005). https://doi.org/10.1073/pnas.0405316102 Google Scholar
D. Debarre, W. Supatto, A. M. Pena, A. Fabre, T. Tordjmann, L. Combettes, M. C. Schanne-Klein, and
E. Beaurepaire,
“Imaging lipid bodies in cells and tissues using third-harmonic generation microscopy,”
Nature Method, 3
(1), 47
–53
(2006). https://doi.org/10.1038/nmeth813 Google Scholar
C. Y. Lin, V. Hoyhannisyan, J. T. Wu, C. W. Lin, J. H. Chen, S. J. Lin, and
C. Y. Dong,
“Label-free imaging of Drosophila larva by multiphoton autofluorescence and second harmonic generation microscopy,”
J. Biomed. Opt., 13
(5), 050502
(2008). https://doi.org/10.1117/1.2981817 Google Scholar
C. L. Evans and
X. S. Xie,
“Coherent anti-Stokes Raman scattering microscopy: chemical imaging for biology and medicine,”
Ann. Rev. Anal. Chem., 1 883
–909
(2008). https://doi.org/10.1146/annurev.anchem.1.031207.112754 Google Scholar
M. D. Duncan, J. Reintjes, and
T. J. Manuccia,
“Scanning coherent anti-Stokes Raman microscope,”
Opt. Lett., 7 350
–352
(1982). https://doi.org/10.1364/OL.7.000350 Google Scholar
A. Zumbusch, G. R. Holtom, and
X. S. Xie,
“Three-dimensional vibrational imaging by coherent anti-Stokes Raman scattering,”
Phys. Rev. Lett., 82 4142
–4145
(1999). https://doi.org/10.1103/PhysRevLett.82.4142 Google Scholar
H. W. Wang, Y. Fu, T. B. Huff, T. T. Le, H. F. Wang, and
J. X. Cheng,
“Chasing lipids in health and diseases by coherent anti-Stokes Raman scattering microscopy,”
Vibrational Spectroscopy, 50
(1), 160
–167
(2009). https://doi.org/10.1016/j.vibspec.2008.11.007 Google Scholar
H. F. Wang, Y. Fu, P. Zickmund, R. Y. Shi, and
J. X. Cheng,
“Coherent anti-Stokes Raman scattering imaging of axonal myelin in live spinal tissues,”
Biophys. J., 89
(1), 581
–591
(2005). https://doi.org/10.1529/biophysj.105.061911 Google Scholar
T. B. Huff and
J. X. Cheng,
“In vivo coherent anti-Stokes Raman scattering imaging of sciatic nerve tissue,”
J. of Microscopy-Oxford, 225
(2), 175
–182
(2007). https://doi.org/10.1111/j.1365-2818.2007.01729.x Google Scholar
F. P. Henry, D. Cote, M. A. Randolph, E. A. Z. Rust, R. W. Redmond, I. E. Kochevar, C. P. Lin, and
J. M. Winograd,
“Real-time in vivo assessment of the nerve microenvironment with coherent anti-Stokes Raman scattering microscopy,”
Plast. Reconstr. Surg., 123
(2), 123S
–130S
(2009). https://doi.org/10.1097/PRS.0b013e318191c5b8 Google Scholar
T. T. Le, I. M. Langohr, M. J. Locker, M. Sturek, and
J. X. Cheng,
“Label-free molecular imaging of atherosclerotic lesions using multimodal nonlinear optical microscopy,”
J. Biomed. Opt., 12
(5), 054007
(2007). https://doi.org/10.1117/1.2795437 Google Scholar
H. W. Wang, I. M. Langohr, M. Sturek, and
J. X. Cheng,
“Imaging and quantitative analysis of atherosclerotic lesions by CARS-based multimodal nonlinear optical microscopy,”
Arterioscler. Thromb. Vasc. Biol., 29
(9), 1342
–1348
(2009). https://doi.org/10.1161/ATVBAHA.109.189316 Google Scholar
A. C. T. Ko, A. Ridsdale, M. S. D. Smith, L. B. Mostaco-Guidolin, M. D. Hewko, A. F. Pegoraro, E. K. Kohlenberg, B. Schattka, M. Shiomi, A. Stolow, and
M. G. Sowa,
“Multimodal nonlinear optical imaging of atherosclerotic plaque development in myocardial infarction-prone rabbits,”
J. Biomed. Opt., 15
(2), 020501
(2010). https://doi.org/10.1117/1.3353960 Google Scholar
R. S. Lim, A. Kratzer, N. P. Barry, S. Miyazaki-Anzai, M. Miyazaki, W. W. Mantulin, M. Levi, E. O. Potma, and
B. J. Tromberg,
“Multimodal CARS microscopy determination of the impact of diet on macrophage infiltration and lipid accumulation on plaque formation in ApoE-deficient mice,”
J. Lipid Res., 51
(7), 1729
–1737
(2010). https://doi.org/10.1194/jlr.M003616 Google Scholar
Y. M. Wu, H. C. Chen, W. T. Chang, J. W. Jhan, H. L. Lin, and
I. Liau,
“Quantitative assessment of hepatic fat of intact liver tissues with coherent anti-Stokes Raman scattering Microscopy,”
Anal. Chem., 81
(4), 1496
–1504
(2009). https://doi.org/10.1021/ac8026838 Google Scholar
C. L. Evans, E. O. Potma, M. Pourishaag, D. Cote, C. P. Lin, and
X. S. Xie,
“Chemical imaging of tissue in vivo with video-rate coherent anti-Stokes Raman scattering microscopy,”
Proc. Natl. Acad. Sci. U.S.A., 102
(46), 16807
–16812
(2005). https://doi.org/10.1073/pnas.0508282102 Google Scholar
J. B. Zhu, B. G. Lee, K. K. Buhman, and
J. X. Cheng,
“A dynamic, cytoplasmic triacylglycerol pool in enterocytes revealed by ex vivo and in vivo coherent anti-Stokes Raman scattering imaging,”
J. Lipid Res., 50
(6), 1080
–1089
(2009). https://doi.org/10.1194/jlr.M800555-JLR200 Google Scholar
T. Hellerer, C. Axang, C. Brackmann, P. Hillertz, M. Pilon, and
A. Enejder,
“Monitoring of lipid storage in Caenorhabditis elegans using coherent anti-Stokes Raman scattering (CARS) microscopy,”
Proc. Natl. Acad. Sci. U.S.A., 104
(37), 14658
–14663
(2007). https://doi.org/10.1073/pnas.0703594104 Google Scholar
C. Morck, L. Olsen, C. Kurth, A. Persson, N. J. Storm, E. Svensson, J. O. Jansson, M. Hellqvist, A. Enejder, N. J. Faergeman, and
M. Pilon,
“Statins inhibit protein lipidation and induce the unfolded protein response in the non-sterol producing nematode Caenorhabditis elegans,”
Proc. Natl. Acad. Sci. U.S.A., 106
(43), 18285
–18290
(2009). https://doi.org/10.1073/pnas.0907117106 Google Scholar
T. T. Le, H. M. Duren, M. N. Slipchenko, C. D. Hu, and
J. X. Cheng,
“Label-free quantitative analysis of lipid metabolism in living Caenorhabditis elegans,”
J. Lipid Res., 51
(3), 672
–677
(2010). https://doi.org/10.1194/jlr.D000638 Google Scholar
I. C. Elle, L. C. B. Olsen, D. Pultz, S. V. Rodkaer, and
N. J. Faergeman,
“Something worth dyeing for: Molecular tools for the dissection of lipid metabolism in Caenorhabditis elegans,”
FEBS Lett., 584
(11), 2183
–2193
(2010). https://doi.org/10.1016/j.febslet.2010.03.046 Google Scholar
G. I. Petrov, R. Arora, V. V. Yakovlev, X. Wang, A. V. Sokolov, and
M. O. Scully,
“Comparison of coherent and spontaneous Raman microspectroscopies for noninvasive detection of single bacterial endospores,”
Proc. Natl. Acad. Sci. U.S.A., 104
(19), 7776
–7779
(2007). https://doi.org/10.1073/pnas.0702107104 Google Scholar
R. Arora, G. I. Petrov, and
V. V. Yakovlev,
“Analytical capabilities of coherent anti-Stokes Raman scattering microspectroscopy,”
J. Modern Opt., 55 3237
–3254
(2008). https://doi.org/10.1080/09500340802168639 Google Scholar
M. Cui, B. R. Bachler, and
J. P. Ogilvie,
“Comparing coherent and spontaneous Raman scattering under biological imaging conditions,”
Opt. Lett., 34
(6), 773
–775
(2009). https://doi.org/10.1364/OL.34.000773 Google Scholar
B. Shorrocks, Drosophila, 32 Ginn & Company Limited, London
(1972). Google Scholar
L. L. Keeley,
“Endocrine regulation of fat-body development and function,”
Annu. Rev. Entomol., 23 329
–352
(1978). https://doi.org/10.1146/annurev.en.23.010178.001553 Google Scholar
L. E. Canavoso, Z. E. Jouni, K. J. Kamas, J. E. Pennington, and
M. A. Wells,
“Fat metabolism in insects,”
Annu. Rev. Nutr., 21 23
–46
(2001). https://doi.org/10.1146/annurev.nutr.21.1.23 Google Scholar
T. M. Rizki,
“Fat body,”
The Genetics and Biology of Drosophila, 2b 561 Academic, New York
(1978). Google Scholar
M. T. Rizki,
“Intracellular localization of kynurenine in fatbody of Drosophila,”
J. Biophys. Biochem. Cytol., 9
(3), 567
–572
(1961). https://doi.org/10.1083/jcb.9.3.567 Google Scholar
W. Lohmann, C. Lohmann, and
M. Ibrahim,
“Fluorescence spectra of NADH/NAD, kynurenine, tryptophan, and tyrosine,”
Naturwissenschaften, 75
(3), 141
–142
(1988). https://doi.org/10.1007/BF00405305 Google Scholar
|


