|
|
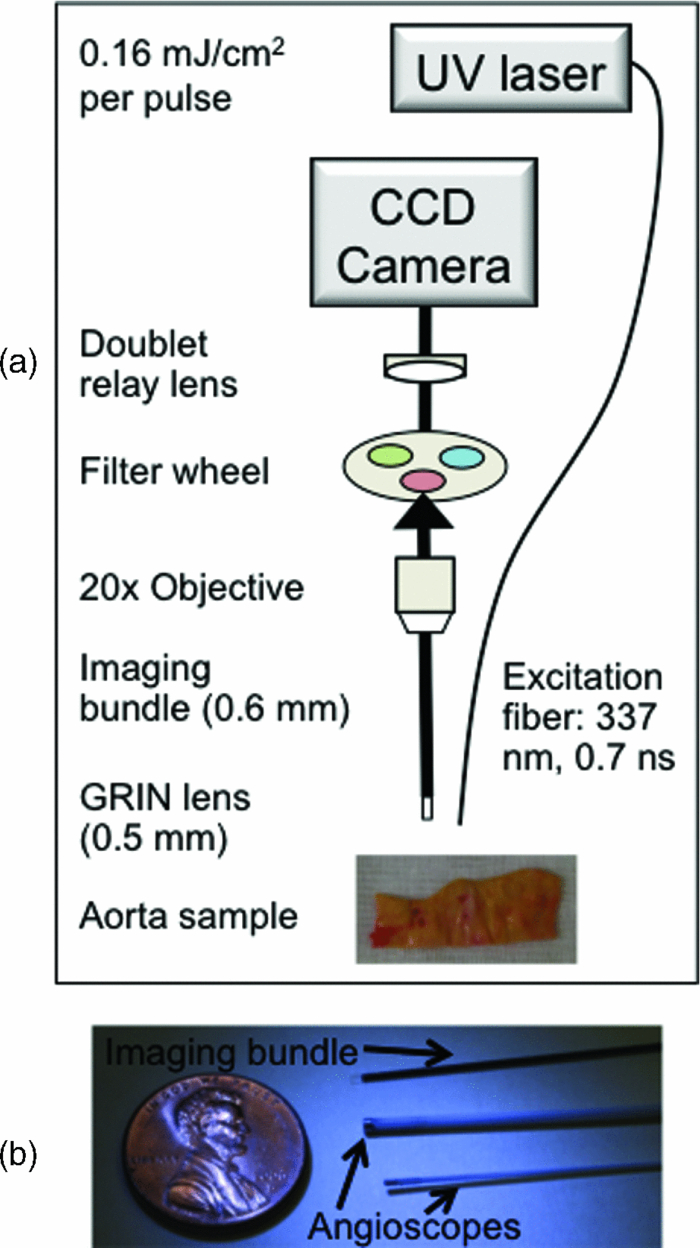
1.IntroductionCardiovascular disease remains the number one cause of death in developed nations and myocardial infarction caused by the rupture of vulnerable atherosclerotic plaques in the coronary arteries is a major contributor to the cardiovascular death toll every year.1 New techniques are being investigated to detect markers of plaque vulnerability in patients,2, 3 in particular the thin-cap fibroatheroma that consists of a thin fibrous cap (<65 μm) covering a large lipid core.4 In addition to structural features, chemical and functional compositions such as endothelial activation, inflammation, and matrix metalloproteinase (MMP) activity have been identified as sensitive indicators of risk of plaque rupture.5 Plaque imaging techniques can be categorized based on whether they are intravascular or noninvasive and whether they require the use of contrast agents or not. For a technique to be most simply translated to the clinic, it is preferred to be noninvasive and without the need for contrast agents. Both intravascular and noninvasive molecular imaging techniques that require the use of contrast agents are capable of characterizing biochemical and functional features of plaque vulnerability with high specificity ex vivo, and in animal models, but have yet to be approved for human use.6, 7 Intravascular techniques that do not use contrast agents are useful for identifying structural features (e.g., fibrotic cap, lipid core), but cannot currently provide functional or biochemical details. Intravascular, nonlabeling techniques such as optical coherence tomography (OCT) and intravascular ultrasound virtual histology have been shown to be capable of providing high-resolution information regarding structural components of plaque (lipid core, fibrous cap) in humans, but have limited potential for identifying the biochemical components of plaque that are identified with techniques that use contrast agents.2, 8, 9 OCT has been shown to be able to visualize macrophages in vivo without the use of contrast agents,10 but there is some controversy regarding this claim because the OCT features that identify the macrophages could also be caused by calcium or other plaque constituents.11 A few other techniques are being developed with the aim of providing the functional imaging capabilities of molecular imaging without the use of contrast agents: thermography is a nonlabeling intravascular technique that has been shown to be capable of recognizing temperature heterogeneity in regions of plaque with high inflammation and MMP activity12 and intravascular catheters for near infrared and Raman spectroscopy are being developed that would allow for measurements of the biochemical composition of plaque.2 Recent studies also demonstrated that autofluorescence features of atherosclerotic plaques could be used to intravascularly characterize plaque composition without the use of contrast agents. Moreover, the use of time-resolved fluorescence spectroscopy (TRFS), a technique designed to measure the fluorescence intensity decay dynamics (excited state lifetimes), was recently found to be capable of identifying markers of plaque vulnerability (inflammatory cell infiltration and collagen degradation in the fibrotic cap, presence of a necrotic core under a thin fibrotic cap) in both human carotid and aortic ex vivo plaque samples.13, 14 However, to date, TRFS has been limited to a large extent to providing single point measurements and is therefore lacking the imaging capability necessary for an extensive (surface) assessment of biochemical features of the arterial wall. A fluorescence lifetime imaging microscopy (FLIM) technique can address this limitation. FLIM can be implemented as either whole-field where a fast-gated camera is used to resolve the fluorescence decay at each pixel within the image15 or scanning-TRFS where each point in the image is separately collected.16, 17 FLIM can provide the same information as the TRFS system but with the added benefit of spatial resolution with each pixel describing the fluorescence dynamics at one location within the imaged region.15, 18, 19 Additionally, the FLIM technique can be used to specifically analyze spectral bands that have the greatest discriminatory powers between markers of vulnerability, therefore streamlining data acquisition. A FLIM technique is particularly suitable for atherosclerosis studies because: 1. FLIM investigates ∼250 μm deep into the intimal layer of the artery, corresponding to a thick fibrotic cap or a thin cap and lipid core. Specifically, a fibrotic cap thinner than 65 μm is deemed vulnerable to rupture.9 2. Fluorescence signal is averaged throughout the ∼250 μm depth, thus, each pixel (∼35 μm) in the image represents a ratio of collagen and lipid content. A higher lipid component in the ratio indicates a lipid-rich chemical composition from a thinner and weaker fibrotic cap.7 3. The distribution and surface area of lipid-rich regions within the plaque can be mapped in a FLIM image. A vulnerable plaque is specified to have a necrotic core that covers 25% of the plaque area, 33% of the artery circumference, and is 2 to 22 mm long;9 features that can be measured with a FLIM technique. This work aims to show that FLIM images acquired through a flexible fiber-optic system can be used to map the biochemical composition of the fibrotic caps of human atherosclerotic plaques and to resolve lipid-rich areas from collagen-rich areas without the use of exogenous contrast agents. This work is unique and distinct from a few recently reported FLIM studies of atherosclerotic tissue18, 20 because our study demonstrates that by relying only on fluorescence time decays without the use of fluorescence intensity information, it is possible to identify the lipid-rich regions of plaque composition. This feature is particularly important for the intended intravascular implementation of a FLIM technique, since fluorescence intensity can be affected by changes in both fluorescence excitation-collection geometry and the amount of blood within the optical field of view. Such changes are expected to inherently occur during intraluminal in vivo measurements, but do not effect the time-resolved parameters as demonstrated by our previous reports.21, 22 2.Methods2.1.SpecimensA total of 11 human aorta samples were harvested post-mortem. Within two hours of autopsy the tissue was snap-frozen and stored at −80°C. The samples were defrosted at 2 to 3°C overnight before being imaged. FLIM images were acquired from several locations per specimen for a total of 48 locations. Each image was acquired in approximately two minutes and the tissue was kept moist during this process with saline. The imaged locations were marked with India ink, fixed in formalin, embedded in paraffin, and routinely processed. 2.2.Fluorescence Lifetime Imaging Microscopy InstrumentationThe custom designed flexible fiber bundle-based FLIM system used for this study allowed in one measurement the mapping of the chemical composition within a volume of 4 mm diameter × 250 μm depth with ∼35 μm spatial resolution. Tissue autofluorescence was induced with a pulsed laser (337 nm, 700 ps, MNL 205 Nitrogen, LTB Lasertechnik) and collected through a gradient index (GRIN) lens (NA: 0.5, diameter: 0.5 mm, field of view: 4 mm, GRINTECH GT-IFRL-050–005-50-NC, GmbH, Jena) cemented with no air gap to a fiber-imaging bundle (0.6 mm in diameter, 2 m in length, 10,000 fibers).15, 19 The fluorescence was first focused at the surface of the GRIN lens before being transferred through the imaging bundle, emitted from the proximal end of the fiber, and projected onto a compact gated intensified CCD camera (4 Picos SR, Stanford Computer Optics) that could achieve a gating time as fast as 200 ps. This system is depicted in Fig. 1 and was further detailed in an earlier publication.19 Based on previous TRFS results from human atherosclerotic plaque,14 two filters were used: F377: 377/50 nm and F460: 460/60 nm (center wavelength/bandwidth) that together provide discrimination between intrinsic fluorophores related to plaque vulnerability. Collagen and elastin have peak fluorescence emission in the F377 band and are associated with normal artery and collagen-rich/stable plaques, respectively, and lipid fluorescence has peak emission at longer wavelengths captured by the F460 band and is associated with plaques with large lipid cores and thin fibrotic caps. 2.3.Fluorescence Lifetime Imaging Microscopy MeasurementsA series of fluorescence intensity images was recorded with 0.5 ns gating time at 0.5 ns intervals for 15 ns at F377 and F460. A total of 128 images were averaged at each time point before advancing to the next. Thus, 128 pulses are delivered to the sample 30 times per filter. The energy per pulse was 0.16 mJ/cm2. The fluorescence decay from each pixel in the images was retrieved through deconvolving the instrument response function23 (0.7 ns in width) with a Laguerre expansion technique24, 25 implemented by a graphical user interface written in MATLAB. The reason for using this particular type of deconvolution is: 1. it simultaneously estimates the fluorescence intensity decay for all pixels in the image, without a priori assumption of the functional form of the decay; 2. it performs at least two orders of magnitude faster than other common deconvolution algorithms; and 3. parameters calculated in the deconvolution process (LEC-0, 1, 2, and 3) have been shown to be associated with the chemical composition of the sample.24, 25 Following Laguerre deconvolution, the average fluorescence lifetime image (τ) was formed by calculating the time at which fluorescence intensity at each pixel location decayed to 1/e of its maximum value.26 All FLIM-derived images are false-color with the color of each pixel representing fluorescence lifetime, intensity, or LEC values. 2.4.Fluorescence Lifetime Imaging Microscopy-Derived ParametersEach imaged location is described by 15 FLIM-derived parameters: τF377, τF460, LEC-0, 1, 2, and 3 at F377 and F460, and a ratio between the two filters (F377/F460) of average fluorescence lifetime and all Laguerre coefficients (τR, LEC-0R, 1R, 2R, and 3R). The ratios allowed for the relationship between the fluorescence decay dynamics in each filter to be assessed in one variable. Histograms of the pixel values were used to quantify the information in each set of images. 2.5.Histopathological AnalysisFour-μm thick tissue segments were cut from paraffin blocks, placed on slides, stained for hematoxylin and eosin and elastic/trichrome (trichrome), and analyzed for percentages (0 to 100) of collagen, elastin, calcification, necrosis/lipid core, and lipid-rich macrophages within the imaged volume marked by the India ink. Based on histopathology, four distinct regions of interest (ROIs) were defined: 1. lipid-rich (LR: >5 macrophages and/or necrosis/lipid core present), 2. collagen-rich (CR: 0% necrosis/lipid core, 0 macrophages, <10% elastin), 3. elastin-rich (ER: 0% necrosis/lipid core, 0 macrophages, >10% elastin), and 4. elastin and macrophage-rich (E+M: >10% elastin, >5 macrophages or >5% lipids, and no necrosis/lipid core). Each histologic section was used to determine ROIs for the entire 4-mm image; the method of inking the tissue prior to histopathological analysis allowed for an estimation of the location of the tissue section within the 4-mm region. Parameters from features found in the region of the FLIM images corresponding to the histopathology sections could then be used to recognize similar features elsewhere in the image. 2.6.Data Analysis and ClassificationTo determine which parameters were useful for discriminating each type of ROI (ER, CR, LR and E+M), FLIM-derived parameters from each group of ROIs were correlated with the corresponding parameters from every other group. Thus, six correlations were computed for each different set of ROIs: ER-CR, ER-LR, ER-E+M, CR-LR, CR-E+M, and LR-E+M. Pearson R values are reported with 95% confidence intervals, P < 0.05 in all cases. Additionally, linear discriminant analysis (LDA) was implemented with a leave-one-out cross-validation technique to classify each ROI into one of four groups (ER, E+M, CR, or LR) based on FLIM-derived parameters. Sensitivity and specificity values are reported. 3.ResultsEighty-one ROIs were identified in the 48 FLIM-imaged locations. Based on an inking scheme prior to histopathological analysis, each tissue cross section was localized with 2 mm accuracy to the en face FLIM images. Features in the FLIM images that did not directly correspond to this cross section were identified by similarity and proximity to features directly corresponding to the tissue cross sections. 3.1.Fluorescence Lifetime Imaging Microscopy-Derived ParametersAll pixels from the 81 ROIs were categorized into one of four respective groups and the average and standard error of each group is given in Table 1. Certain characteristics were found to identify each group based on these averaged values. For example, ER regions had similar values for τF377 and τF460 (1.8 and 2.0 ns, respectively); E+M and ER samples had similar τF377 values but E+M samples had significantly longer τF460 values (2.3 ns). LR samples had slightly longer τF377 values than ER and E+M samples (2.0 ns) but slightly shorter τF460 values (1.9 ns). CR samples had the longest τF377 values (2.7 ns) and relatively shorter τF460 values. The temporal resolution of the FLIM system is 0.5 ns and, thus, some variation from the mean parameters of each group is expected. However, the trends between the parameters clearly identify each group. For example, CR has consistently longer τF377 than the other groups. E+M is identified by τF460 values at least 0.3 ns longer than τF377. The differences between ER and LR at τF377 and τF460 are slight, but LEC-0R and τR clearly distinguish the two ROI types. Fig. 4Pearson R values [mod(R) > 0.5 and P < 0.05] for correlations between groups of ROIs on the x axis and FLIM parameters.  Table 1Mean FLIM parameters ± SE for all ROIs in each group. Statistical significance (P < 0.05) between ER-CR: *, ER-LR: +, ER-E+M: o, CR-LR: ^, CR-E+M: #, and LR-E+M: ! is marked in the superscript of the band of each parameter.
Figure 2 demonstrates representative micrographs of the four plaque compositions described in this study (ER, E+M, CR, and LR). The ER image is characterized by black wavy elastin fibers and a very thin layer of collagen caused by slight intimal thickening. The E+M image has many smooth muscle cells and macrophages (stained red), some lipid content (holes in the blue collagen-rich segments), and elastin fibers. The CR image is dense with blue-stained collagen and some red smooth muscle cells. The LR image exhibits lipid pools, a thin collagen cap, and many macrophages and smooth muscle cells. Alongside the micrographs are the corresponding raw pulses and deconvolved decays from 1-mm diameter regions of interest from the ROIs: in Fig. 2a an ER and E+M region are compared and in Fig. 2b a CR and LR region are compared. Fig. 2Representative micrographs (elastic trichrome stain) of the four compositional groups identified in this study, the raw (measured) fluorescence pulses, and the corresponding deconvolved decays. (a) ER and E+M samples. (b) CR and LR samples. Signals are shown as normalized intensity and are averaged from 1 mm diameter regions of interest within the ROIs.  An example of how three FLIM-derived parameters (τF377, τF460, and LEC-1F377) can visually (with images) and quantitatively (with histograms) distinguish between different types of ROIs is shown in Fig. 3. Histograms in Fig. 3a show the long τF377, shorter τF460, and negative LEC-1F377 characteristic of CR and the short τF377 and τF460, and large LEC-1F377 characteristic of ER. In this case, both τF377 and τF460 for the ER ROI are shorter than the average ER lifetime values in this study, but the uniformity of the lifetimes across the two filters and the large LEC-1F377 still allow for the distinction of elastin. The LR region also has uniform τF377 and τF460, but the small values of LEC-1F377 identify this region as LR as opposed to ER. In Fig. 3b, the CR region has long τF377 but longer than expected τF460 based on the average values in Table 1; however, the ROI is still identified as collagen by the negative LEC-1F377 values. The ER region has consistent τF377 and τF460 around 2 ns and the characteristic long values of LEC-1F377. The E+M ROI has shorter τF377 than τF460. Fig. 3FLIM-derived parameters: τF377, τF460, and LEC-1F377 from two aorta samples depicted in (a) and (b), respectively. ROIs are outlined (white dashed line) for ER, E+M, CR, and LR groups. Beneath each image are corresponding histograms, the y axis represents number of pixels. The diameter of the field of view of the FLIM images is 4 mm in all cases.  3.2.Pearson CorrelationsAll FLIM-derived parameters except LEC-1R, LEC-2F377, and LEC-2F460 had significant R-values in at least one of the six correlations performed between the four ROI types. Interestingly, LEC-2R was one of the variables that significantly correlated between ER and E+M samples despite the individual values at each filter providing no discrimination. The ratio represents the difference in the decay dynamics between the two filters as opposed to the specific values at each filter. It was also of note that the Laguerre parameters (LEC-1 and -3, in particular) had comparable or greater discriminatory powers between biochemical compositions than average lifetime alone. Figure 4 depicts R-values [mod(R) > 0. 5 and P < 0.05] for each of the correlations between the parameters and the four ROIs. Several correlations were statistically significant (P < 0.05), but with mod(R) < 0.5; these correlations are not displayed. This plot provides a method of determining the discriminatory power of each of the FLIM-derived parameters that varied with statistical significance between groups: the closer the Pearson R value to ±1 (the top or bottom of the horizontal axis), the higher the correlation and the stronger the discriminatory power. The closer the Pearson R value to 0, the weaker the correlation. For example, τR is a strong discriminator between ER and CR (R = 0.78) and a weaker discriminator between ER and LR (R = 0.55). 3.3.ClassificationFLIM-derived parameters with significant correlations between groups were used for the classification: average lifetime, LEC-0, LEC-1, LEC-3 at F377 and F460 and LEC-2R. Despite the ratios for τ and LEC-0 also being significant, they were not used in the classification to ensure independence of the dataset. Results for classification of all four groups are depicted in Table 2. Despite the limited size of the database, specificity is very high for all groups (89 to 92%), however sensitivity needs to be improved upon (50 to 86%). The classification algorithm often accurately classifies the ROIs, but is not proficient at identifying all ROIs (particularly LR ROIs). Table 2Sensitivity (SE) and specificity (SP) percentages for each type of ROI.
4.DiscussionThis study demonstrated that FLIM-derived parameters are correlated with biochemical composition of the fibrotic cap region of atherosclerotic aorta and the elastin-rich media or thickened intima of nonatherosclerotic aorta. In particular, this resolution is accomplished based on endogenous contrast and solely based on parameters derived from fluorescence decay dynamics, a unique advantage to this technique. While it has become standard in the literature for imaging studies to categorize plaque composition based on the American Heart Association (AHA) classification scheme modified by Virmani,27 the current FLIM technique assesses only the fibrotic cap region of arteries, so we refrain from making such classifications. This study assumed that within the imaged volume, the higher the lipid to collagen/elastin ratio, the thinner the fibrotic cap and, thus, the less stable the plaque. Hence, ER could be classified as intimal thickening, E+M may signify pathologic intimal thickening or intimal xanthoma,27, 28 CR indicates either fibrous plaque or fibroatheroma and LR may denote a thin-cap fibroatheroma. In future studies, FLIM could be used in conjunction with another intravascular imaging technique such as OCT or intravascular ultrasound (Ref. 21) as a means to acquire both information regarding the chemical composition of the fibrotic cap as well as the structural features of the entire plaque that would allow for accurate AHA-modified classifications to be made. 4.1.Fluorescence Lifetime Imaging Microscopy versus Plaque CompositionThe average lifetime of each ROI is dominated by the average lifetime of their main fluorophores (ER: elastin, CR: collagen, LR: lipids); thus, different percentages of each component in the ROI will affect the overall lifetime measurement. Elastin is reported to have an average fluorescence lifetime of 1.9 ns at 380 nm (Ref. 29) and constant time-resolved properties across its emission spectrum and, thus, at both F377 and F460 emission wavelength bands;30 collagen I is the predominant collagen molecule in atherosclerosis and is reported to have longer lifetimes at F377 (5.2 ns at its emission peak, 390 nm) than at F460 (4.5 ns at 460 nm).30 The time-resolved fluorescence properties of lipids are less well studied than collagen and elastin, but are found to have short lifetimes (<1.8 ns) across the emission spectrum.30, 31 Macrophages alone do not fluoresce, but lipid-laden macrophages (foam cells) exhibit short average fluorescence lifetimes according to their lipid content. Insignificant differences from these expected values can often be explained by the 0.5 ns temporal resolution of the FLIM system. The slightly increased lifetimes found for ER ROIs compared to literature values (2.0 ns at F460) could also be attributed to a possible accumulation of collagen in normal regions of adult artery that occurs with aging. CR ROIs demonstrate slightly shorter τF377 (2.65 ns) and τF460 (2.14 ns) than literature-reported values, this is likely caused by a small amount of elastin in the samples allowed for in the definition of the CR ROIs (<10% elastin) or a few lipids undetected in the histopathological analysis. Shortening of lifetimes can also be caused by photobleaching, possible with this technique. Using lifetime measurements alone, it is hard to distinguish lipids from elastin because both have short average lifetimes (1.8 ns and less). But, often the LR ROIs also contain collagen in the form of a fibrotic cap covering the lipid core and, thus, the average lifetimes of the LR ROIs are lengthened at F377 (2.03 ns) and at F460 (1.88 ns). A larger sample size, more quantitative lipid analysis, and additional tissue sections analyzed per sample could improve the ability of this technique to identify varying percentages of lipid content in the LR group. This wide variety of lipid percentages in the LR group contributed to the lower sensitivity of the classification algorithm to the LR samples. An advantage of FLIM is the additional information provided by the Laguerre coefficients. ER and LR ROIs can be distinguished by LEC-0R in particular (see Fig. 4). Average fluorescence lifetime describes the single point at which fluorescence decays to 1/e of its maximum value, whereas Laguerre coefficients are used to describe fluorescence decay in more detail: a fourth order Laguerre deconvolution generates four Laguerre coefficients that are multiplied by four Laguerre functions and the sum of these four products becomes the deconvolved fluorescence response. Thus, the Laguerre coefficients that describe the magnitude of each Laguerre function used in the deconvolution represent distinct aspects of the average fluorescence decay compared to average lifetime alone. Therefore, the Laguerre coefficients specifically look at slower versus faster decay components and so are more sensitive to changes in the decays between differing tissue types than average lifetime alone. For instance, Fig. 4 shows that some Laguerre coefficients, particularly LEC-1F377 and -3F377, have the highest R-values for providing discrimination between the four groups analyzed in this study. LEC-3 represents the faster decay component and LEC-1 the slower decay component; since lipid and elastin fluorescence decays faster than collagen fluorescence, it makes sense that these two Laguerre coefficients provide good discrimination. The LEC values reported here are in agreement with earlier reported time-resolved fluorescence spectroscopy measurements that have also reported Laguerre coefficient values from atherosclerotic plaque including lipid-rich specimens.14, 32 Ratios of FLIM-derived parameters are robust for assessing plaque composition because they describe in one variable the variation in fluorescence decay dynamics at both F377 and F460. Most obviously, CR samples have the highest τR because of long τF377 values. But also, E+M samples have the lowest τR due to long τF460 values. The lifetime ratio τR is a robust parameter for distinguishing between ER and LR samples given that their lifetime values are similar, but the LR ratio is just over 1 (1.09) due to the collagen-lengthened τF377 that distinguishes it from the ER ratio of just under 1 (0.90). 4.2.Study Limitations and ChallengesTwo limitations to be overcome in future studies are identified here. First, we note that despite significant Pearson correlations between FLIM-derived parameters and each histopathological group, classification results showed only high specificity, but lower sensitivity, particularly for LR ROIs (50%). This was expected based on the small sample size of the data set and the lack of a strong parameter to distinguish between the similar range of lifetimes for LR and ER ROIs. As previously stated, clear correlations between τR and LEC-0R and these two groups existed, but alone they were not strong enough to allow for robust classification results. There are many types of autofluorescent lipids, lipoproteins, and lipopigments present in plaque. Some fluoresce at emission wavelengths similar to collagen and elastin, such as low-density lipoprotein (LDL) and very low-density lipoprotein (VLDL), shortening the average fluorescence lifetime at these wavelength bands, but others, such as ceroid, have a fluorescence emission peak at longer wavelengths.30 The addition of a filter at 510 nm will allow further discrimination between LR and ER ROIs because of the shorter lifetimes of the lipid content compared with the weak fluorescence of elastin at this wavelength. Second, only a few samples with E+M composition were available for this study, thus, we cannot extensively comment on this group. It is reported here that FLIM images identified a few samples composed of elastin, macrophages, lipids, and smooth muscle cells, but without the presence of a necrotic core; these samples were classified as E+M. Interestingly, E+M ROIs were classified with high sensitivity and specificity despite their small sample size. As previously stated, this group could potentially be considered pathologic intimal thickening, which is the first sign of atherosclerosis, different from nonatherosclerotic plaque formation that occurs in the form of fatty streaks in humans as early as childhood.21 It could also be considered intimal xanthoma.33 This discrimination allows for the idea that fluorescence lifetime could be a useful tool in studying preclinical atherosclerosis to aid in the research being done to identify what causes a plaque to become atherosclerotic, and in particular, what causes a plaque to become vulnerable to rupture. The seven ROIs classified as E+M were statistically different in several FLIM parameters from the other groups, but more of these samples need to be studied to determine the difference in fluorophores that caused the increased τF460 seen in this group and to determine whether this characteristic is truly unique to pathologic intimal thickening or intimal xanthoma. 4.3.Clinical Translational PotentialRecent publications have demonstrated that FLIM can be adapted to endoscopic-like applications via a fiberoptic imaging bundle and have high potential for clinical application.19, 23 This study has employed such flexible imaging-bundle configuration. However, the main goal of this study was to demonstrate that FLIM images of human atherosclerotic plaque could be used to characterize plaque composition. These results are being used to develop a more clinically robust system that employs a TRFS system in a scanning mode to create intravascular FLIM images.17 In previous studies,16, 21, 22 we showed that such a TRFS technique allows for faster data acquisition, a 10-fold increase in temporal resolution, and a lower energy delivery level compared to the whole-field FLIM technique described here. Moreover, we demonstrated the luminal application of TRFS via a side-viewing fiber in phantoms and porcine models.21, 22 Although, in this study the ROIs were hand-selected based on histopathology, which would not be ideal for a clinical diagnostic tool. We envision that the future availability of a larger dataset can enable development of an algorithm designed to automatically segment FLIM images into ER, E+M, CR, and LR ROIs as can be deduced by the preliminary linear discriminant classification results presented here. Then, surface areas of each ROI could be calculated providing further information for tasks such as measuring the diameter of lipid pools or the percentage of the artery circumference a lipid-rich region encompasses. Last, the current FLIM technique relies only on time-resolved fluorescence parameters to make distinctions between biochemical compositions. This is important because in an intravascular implementation, the fluorescence intensity is affected by the presence of blood and likely changes of optical excitation-collection geometry, whereas time-resolved parameters are relatively independent of such factors.21, 22 All of these attributes suggest the potential of an intravascular implementation of this FLIM system for the study and diagnosis of atherosclerosis in a clinical setting. 5.ConclusionThis study has shown, for the first time, that FLIM images of human atherosclerotic plaque can be used to derive parameters that discriminate between luminal areas that are elastin-rich, elastin and macrophage-rich, collagen-rich, and lipid-rich only using intrinsic fluorescence decay dynamics without the need for fluorescence intensity information. This is critical for near-future clinical intravascular interrogation of arterial pathologies as at one end, it obviates the need for contrast agents and at the other end, it enables the development of simplified catheter systems. Also, this study demonstrates that FLIM can be used to measure the extent of areas dominated by lipid components (number of pixels characterized as lipid-rich in composition) and areas dominated by thick versus thin fibrotic cap (corresponding to collagen-rich versus lipid-rich pathologies). This is important because a fibrous or collagen-rich plaque is expected to be more stable while a lipid-rich plaque with a thin, inflamed fibrous cap covering a lipid/necrotic core is more likely to be unstable. Moreover, a normal artery or early/nonpathological lesion is elastin-rich, while a lesion that has become atherosclerotic but is still in an early stage exhibits intimal thickening and macrophage infiltration indicating the onset of atherosclerosis. Consequently, FLIM has the potential to enhance the sensitivity of current clinical methods of detecting critical plaque features, including markers of plaque vulnerability. AcknowledgmentsThis study was supported by the National Institute of Health Grant No. R01 HL 67377 (to L.M.) and the Howard Hughes Medical Institute Med-Into-Grad Fellowship at UC Davis (to J.P.). ReferencesH. S. Weintraub,
“Identifying the vulnerable patient with rupture-prone plaque,”
Am. J. Cardiol., 101
(12A), 3F
–10F
(2008). https://doi.org/10.1016/j.amjcard.2008.04.013 Google Scholar
F. Sharif and
R. T. Murphy,
“Current status of vulnerable plaque detection,”
Catheter Cardiovasc Interv, 75
(1), 135
–144
(2010). https://doi.org/10.1002/ccd.22164 Google Scholar
J. Sanz and
Z. A. Fayad,
“Imaging of atherosclerotic cardiovascular disease,”
Nature, 451
(7181), 953
–957
(2008). https://doi.org/10.1038/nature06803 Google Scholar
R. Virmani, A. P. Burke, A. Farb, and
F. D. Kolodgie,
“Pathology of the vulnerable plaque,”
J. Am. Coll. Cardiol., 47
(8), C13
–C18
(2006). https://doi.org/10.1016/j.jacc.2005.10.065 Google Scholar
M. J. Davies,
“The pathophysiology of acute coronary syndromes,”
Heart, 83
(3), 361
–366
(2000). https://doi.org/10.1136/heart.83.3.361 Google Scholar
K. Douma, L. Prinzen, D. W. Slaaf, C. P. Reutelingsperger, E. A. Biessen, T. M. Hackeng, M. J. Post, and
M. A. van Zandvoort,
“Nanoparticles for optical molecular imaging of atherosclerosis,”
Small, 5
(5), 544
–557
(2009). https://doi.org/10.1002/smll.200801079 Google Scholar
P. Libby, M. DiCarli, and
R. Weissleder,
“The vascular biology of atherosclerosis and imaging targets,”
J. Nucl. Med., 51 Suppl 1 33S
–37S
(2010). https://doi.org/10.2967/jnumed.109.069633 Google Scholar
G. J. Tearney, S. Waxman, M. Shishkov, B. J. Vakoc, M. J. Suter, M. I. Freilich, A. E. Desjardins, W. Y. Oh, L. A. Bartlett, M. Rosenberg, and
B. E. Bouma,
“Three-dimensional coronary artery microscopy by intracoronary optical frequency domain imaging,”
JACC Cardiovasc Imaging, 1
(6), 752
–761
(2008). https://doi.org/10.1016/j.jcmg.2008.06.007 Google Scholar
J. Narula, P. Garg, S. Achenbach, S. Motoyama, R. Virmani, and
H. W. Strauss,
“Arithmetic of vulnerable plaques for noninvasive imaging,”
Nat. Clin. Pract. Cardiovasc. Med., 5 Suppl 2 S2
–S10
(2008). https://doi.org/10.1038/ncpcardio1247 Google Scholar
G. J. Tearney, H. Yabushita, S. L. Houser, H. T. Aretz, I. K. Jang, K. H. Schlendorf, C. R. Kauffman, M. Shishkov, E. F. Halpern, and
B. E. Bouma,
“Quantification of macrophage content in atherosclerotic plaques by optical coherence tomography,”
Circulation, 107
(1), 113
–119
(2003). https://doi.org/10.1161/01.CIR.0000044384.41037.43 Google Scholar
J. Oh, M. D. Feldman, J. Kim, P. Sanghi, D. Do, J. J. Mancuso, N. Kemp, M. Cilingiroglu, and
T. E. Milner,
“Detection of macrophages in atherosclerotic tissue using magnetic nanoparticles and differential phase optical coherence tomography,”
J. Biomed. Opt., 13
(5), 054006
(2008). https://doi.org/10.1117/1.2985762 Google Scholar
R. Krams, S. Verheye, L. C. van Damme, D. Tempel, B. Mousavi Gourabi, E. Boersma, M. M. Kockx, M. W. Knaapen, C. Strijder, G. van Langenhove, G. Pasterkamp, A. F. van der Steen, and
P. W. Serruys,
“In vivo temperature heterogeneity is associated with plaque regions of increased MMP-9 activity,”
Eur. Heart J., 26
(20), 2200
–2205
(2005). https://doi.org/10.1093/eurheartj/ehi461 Google Scholar
L. Marcu, M. C. Fishbein, J. M. I. Maarek, and
W. S. Grundfest,
“Discrimination of human coronary artery atherosclerotic lipid-rich lesions by time-resolved laser-induced fluorescence spectroscopy,”
Arterioscler., Thromb., Vasc. Biol., 21
(7), 1244
–1250
(2001). https://doi.org/10.1161/hq0701.092091 Google Scholar
L. Marcu, J. A. Jo, Q. Fang, T. Papaioannou, T. Reil, J. H. Qiao, J. D. Baker, J. A. Freischlag, and
M. C. Fishbein,
“Detection of rupture-prone atherosclerotic plaques by time-resolved laser-induced fluorescence spectroscopy,”
Atherosclerosis, 204
(1), 156
–164
(2009). https://doi.org/10.1016/j.atherosclerosis.2008.08.035 Google Scholar
D. S. Elson, J. A. Jo, and
L. Marcu,
“Miniaturized side-viewing imaging probe for fluorescence lifetime imaging (FLIM): validation with fluorescence dyes, tissue structural proteins and tissue specimens,”
New J. Phys., 127
(2007). https://doi.org/10.1088/1367-2630/9/5/127 Google Scholar
Y. Sun, R. Liu, D. S. Elson, C. W. Hollars, J. A. Jo, J. Park, and
L. Marcu,
“Simultaneous time- and wavelength-resolved fluorescence spectroscopy for near real-time tissue diagnosis,”
Opt. Lett., 33
(6), 630
–632
(2008). https://doi.org/10.1364/OL.33.000630 Google Scholar
Y. Sun, A. J. Chaudhari, M. Lam, H. Xie, D. R. Yankelevich, J. Phipps, J. Liu, M. C. Fishbein, J. M. Cannata, K. K. Shung, and
L. Marcu,
“Multimodal characterization of compositional, structural and functional features of human atherosclerotic plaques,”
Biomedical Opt. Express, 2
(8), 2288
–2298
(2011). https://doi.org/10.1364/BOE.2.002288 Google Scholar
J. Phipps, Y. Sun, R. Saroufeem, N. Hatami, and
L. Marcu,
“Fluorescence lifetime imaging microscopy for the characterization of atherosclerotic plaques,”
Proc. Soc. Photo-Opt. Instrum. Eng., 7161 71612G
(2009). Google Scholar
Y. Sun, J. Phipps, D. S. Elson, H. Stoy, S. Tinling, J. Meier, B. Poirier, F. S. Chuang, D. G. Farwell, and
L. Marcu,
“Fluorescence lifetime imaging microscopy: in vivo application to diagnosis of oral carcinoma,”
Opt. Lett., 34
(13), 2081
–2083
(2009). https://doi.org/10.1364/OL.34.002081 Google Scholar
P. Thomas, P. Pande, F. Clubb, J. Adame, and
J. A. Jo,
“Biochemical imaging of human atherosclerotic plaques with fluorescence lifetime angioscopy,”
Photochem. Photobiol., 86
(3), 727
–731
(2010). https://doi.org/10.1111/j.1751-1097.2010.00707.x Google Scholar
D. N. Stephens, J. Park, Y. Sun, T. Papaioannou, and
L. Marcu,
“Intraluminal fluorescence spectroscopy catheter with ultrasound guidance,”
J. Biomed. Opt., 14
(3), 030505
(2009). https://doi.org/10.1117/1.3146813 Google Scholar
Y. Sun, D. Stephens, H. Xie, J. Phipps, R. Saroufeem, J. Southard, D. S. Elson, and
L. Marcu,
“Dynamic tissue analysis using time- and wavelength-resolved fluorescence spectroscopy for atherosclerosis diagnosis,”
Opt. Express, 19
(5), 3890
–3901
(2011). https://doi.org/10.1364/OE.19.003890 Google Scholar
Y. Sun, N. Hatami, M. Yee, J. Phipps, D. S. Elson, F. Gorin, R. J. Schrot, and
L. Marcu,
“Fluorescence lifetime imaging microscopy for brain tumor image-guided surgery,”
J. Biomed. Opt., 15
(5), 056022
(2010). https://doi.org/10.1117/1.3486612 Google Scholar
J. A. Jo, Q. Fang, and
L. Marcu,
“Ultrafast method for the analysis of fluorescence lifetime imaging microscopy data based on the Laguerre expansion technique,”
IEEE J. Quantum. Electron., 11
(4), 835
–845
(2005). https://doi.org/10.1109/JSTQE.2005.857685 Google Scholar
J. A. Jo, Q. Y. Fang, T. Papaioannou, and
L. Marcu,
“Fast model-free deconvolution of fluorescence decay for analysis of biological systems,”
J. Biomed. Opt., 9
(4), 743
–752
(2004). https://doi.org/10.1117/1.1752919 Google Scholar
J. R. Lakowicz, Principles of Fluorescence Spectroscopy, Springer, New York
(1999). Google Scholar
R. Virmani, F. D. Kolodgie, A. P. Burke, A. Farb, and
S. M. Schwartz,
“Lessons from sudden coronary death – A comprehensive morphological classification scheme for atherosclerotic lesions,”
Arterioscler., Thromb., Vasc. Biol., 20
(5), 1262
–1275
(2000). https://doi.org/10.1161/01.ATV.20.5.1262 Google Scholar
F. D. Kolodgie, A. P. Burke, G. Nakazawa, and
R. Virmani,
“Is pathologic intimal thickening the key to understanding early plaque progression in human atherosclerotic disease,”
Arterioscler., Thromb., Vasc. Biol., 27
(5), 986
–989
(2007). https://doi.org/10.1161/ATVBAHA.0000258865.44774.41 Google Scholar
S. Andersson-Engels, J. Johansson, K. Svanberg, and
S. Svanberg,
“Fluorescence imaging and point measurements of tissue: applications to the demarcation of malignant tumors and atherosclerotic lesions from normal tissue,”
Photochem. Photobiol., 53
(6), 807
–814
(1991). Google Scholar
L. Marcu, W. S. Grundfest, and
M. Fishbein,
“Time-resolved laser-induced fluorescence spectroscopy for staging atherosclerotic lesions,”
Handbook of Biomedical Fluorescence, 397
–430 Marcel Dekker, New York
(2003). Google Scholar
L. Marcu, Q. Y. Fang, J. A. Jo, T. Papaioannou, A. Dorafshar, T. Reil, J. H. Qiao, J. D. Baker, J. A. Freischlag, and
M. C. Fishbein,
“In vivo detection of macrophages in a rabbit atherosclerotic model by time-resolved laser-induced fluorescence spectroscopy,”
Atherosclerosis, 181
(2), 295
–303
(2005). https://doi.org/10.1016/j.atherosclerosis.2005.02.010 Google Scholar
R. M. Senior, G. L. Griffin, C. J. Fliszar, S. D. Shapiro, G. I. Goldberg, and
H. G. Welgus,
“Human 92- and 72-kilodalton type IV collagenases are elastases,”
J. Biol. Chem., 266
(12), 7870
–7875
(1991). Google Scholar
P. K. Cheruvu, A. V. Finn, C. Gardner, J. Caplan, J. Goldstein, G. W. Stone, R. Virmani, and
J. E. Muller,
“Frequency and distribution of thin-cap fibroatheroma and ruptured plaques in human coronary arteries: a pathologic study,”
J. Am. Coll. Cardiol., 50
(10), 940
–949
(2007). https://doi.org/10.1016/j.jacc.2007.04.086 Google Scholar
|