|
|
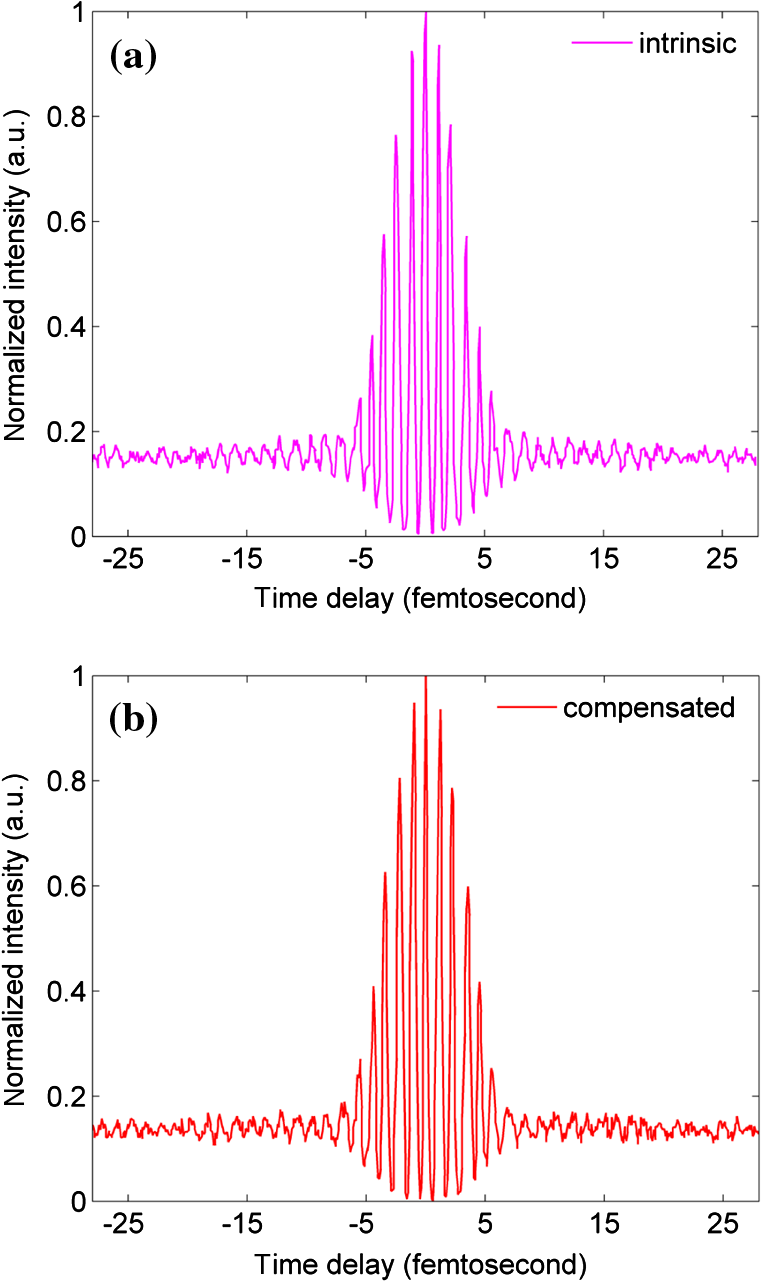
1.IntroductionTwo-photon microscopy (TPM), based on ultrafast laser pulse scanning technique, generates nonlinear optical signals from biosamples for rendering high resolution images. TPM is noninvasive and capable of imaging live cells within their extracellular microenvironment deep inside thick tissues. Nonlinear light-matter interactions between near-infrared femtosecond () laser pulse and tissue constituents enable intrinsic optical sectioning,1–3 high signal-to-background ratio2 and large depth imaging.4 The dependence of two-photon signal generation, e.g., two-photon excited fluorescence (TPEF) and second harmonic generation (SHG), on -pulse properties, such as pulse shape5,6 and temporal duration7–11 suggests that TPM performance may be improved by utilizing shorter pulse durations. However, as the -pulse decreases in duration, its spectrum necessarily broadens such that for a sub-10 pulse its spectral bandwidth can extend more than 100 nm (if centered at ) and its central wavelength is no longer tunable. Given endogenous and exogenous fluorophores with two-photon excitation (TPE) maxima throughout the Ti:Sapphire laser-tuning range, a question arises whether the inability to tune the central wavelength of broadband -pulses compromises its utility for TPM compared with tunable narrowband -pulses. Assuming frequency invariant response of dye-molecules to TPE, TPEF yield varies inversely with -pulse duration,7 given identical pulse shapes. A number of studies have characterized this relationship experimentally albeit with subtle but important differences in how the -pulse duration was varied. In two of those studies, the -pulse duration was varied by introducing dispersion, leading to broadened duration while maintaining the pulse spectrum.7,8 Results nearly consistent with the inverse proportionality relationship between TPEF yield and -pulse duration were reported, but interpretation of these results remains controversial. It can be shown that, for these studies, TPEF yield was actually related to the dispersion effect on -pulse rather than the effects of pulse duration on two-photon processes.10 In other words, the results did not reflect photophysics of two-photon absorption (and subsequent fluorescence) but that of pulse peak-power degradation by group velocity dispersion. This inverse proportionality relationship between TPEF and pulse duration has also been studied using transform-limited -pulses. By using transform-limited pulses, both duration and spectrum change, and thus, for instances of frequency dependent molecular two-photon absorption, TPEF yield was shown to depend on the overlap integral with -pulse SH power spectrum.10 Using a tunable narrowband -pulse laser, shorter pulse durations could be obtained by compression of spectrally broadened pulses through optical fibers. With grating compressor and highly nonlinear photonic crystal fibers, TPEF was enhanced when using compressed compared to narrowband -pulse,9,11 and imaging depth with TPM was also extended by using the compressed -pulse.9 For pulses as short as sub-10 , its spectrum encompasses the effective gain bandwidth of Ti:Sapphire,12 thus making its central wavelength untunable. This study was designed to investigate whether gains in TPE utilizing ultrashort pulses were mitigated by its fixed central wavelength compared with tunable narrowband pulses. In this research, TPEF yields are measured with three organic dye phantoms excited by nearly transform-limited sub-10 (sub-10 TLP for simplicity hereafter) and tunable 140 pulses. To conduct this proof-of-principle study without loss of generality, Indo-1, FITC, and TRITC were selected for their distinct TPEF characteristics, i.e., TPE spectral peak positions, respectively, located to high-frequency (Indo-1), on spectral peak (FITC), and to low-frequency wing (TRITC) of the sub-10 TLP spectrum. By direct comparison and calculation, the physics behind the differentiated TPEF enhancements among the three dye-phantoms is discussed, which evokes further studies on multicolor TPEF enhancements with a mixture of the dye-phantoms, mutual quenching via one-photon absorption (OPA), and associated solvent effect. This paper is organized as follows: a description of methodology detailed in Sec. 2 includes experimental setup, systematic calibrations, and dye-phantom preparation. Section 3 is devoted to experimental protocol, results presentation, analysis on measured and calculated TPEF enhancements, a semi-quantitative discussion on the differentiated TPEF enhancements, and phantom studies as well as simulations on multicolor TPEF enhancement under environmental influences. Finally, Sec. 4 concludes this paper. 2.Materials and MethodsThe integrated experimental setup is shown in Fig. 1(a) and consists of three units: 1. two excitation schemes with group delay dispersion (GDD) compensation, previously optimized with the setup shown in Fig. 1(b) for delivering sub-10 TLP in situ (i.e., at the focal spot of the phantom center), 2. dispersion-less laser beam expanding and focusing with parabolic mirrors, and 3. TPEF collection with a custom-designed compound lens well-coupled to a spectrograph. This experimental design ensures delivery of sub-10 TLP in situ, high-efficiency fluorescence collection, and good spectral resolution for accurate quantification of TPEF yields. The three dye-phantoms were prepared at 100 μM concentration7 with Indo-1 (SKU#1-1202, Invitrogen) and FITC (F3651, Sigma-Aldrich) dissolved in deionized water and TRITC (87918, Sigma-Aldrich) in methanol. 2.1.Two Excitation SchemesA software-controlled tunable Ti:Sapphire laser (pulse duration 140 , repetition rate 80 MHz, horizontal linearly-polarized, Chameleon Ultra II, Coherent) is used for TPEF measurements over the tuning range from 700 to 900 nm at 10 nm increments. This tuning range approximates the spectral full-width at tenth-maximum (FWTM: ) of sub-10 mode-locked pulse from the untuned Ti:Sapphire laser (central-wavelength 792 nm, FWHM , repetition rate 75 MHz, horizontal linearly-polarized, Synergy PRO, Femtolasers). A variable neutral density (ND) filter (spectral window 380 to 1200 nm, Thorlabs) is used for laser power adjustment. The accumulative GDD of cuvette (1.25 mm-thick optical-glass-window, 10.0 mm path-length, 23/G/10, Starna Cells), dye-phantom, and ND filter is assumed negligible for the 140 pulse of spectral FWTM less than 9 nm.7,10 However, for sub-10 pulses with more than one order of magnitude broader bandwidth, GDD compensation is essential. Fig. 1(a) Experimental configuration for TPEF measurements: PM (parabolic-mirror), ND (neutral density) filter and (b) experimental set up for testing the optimal GDD compensation. 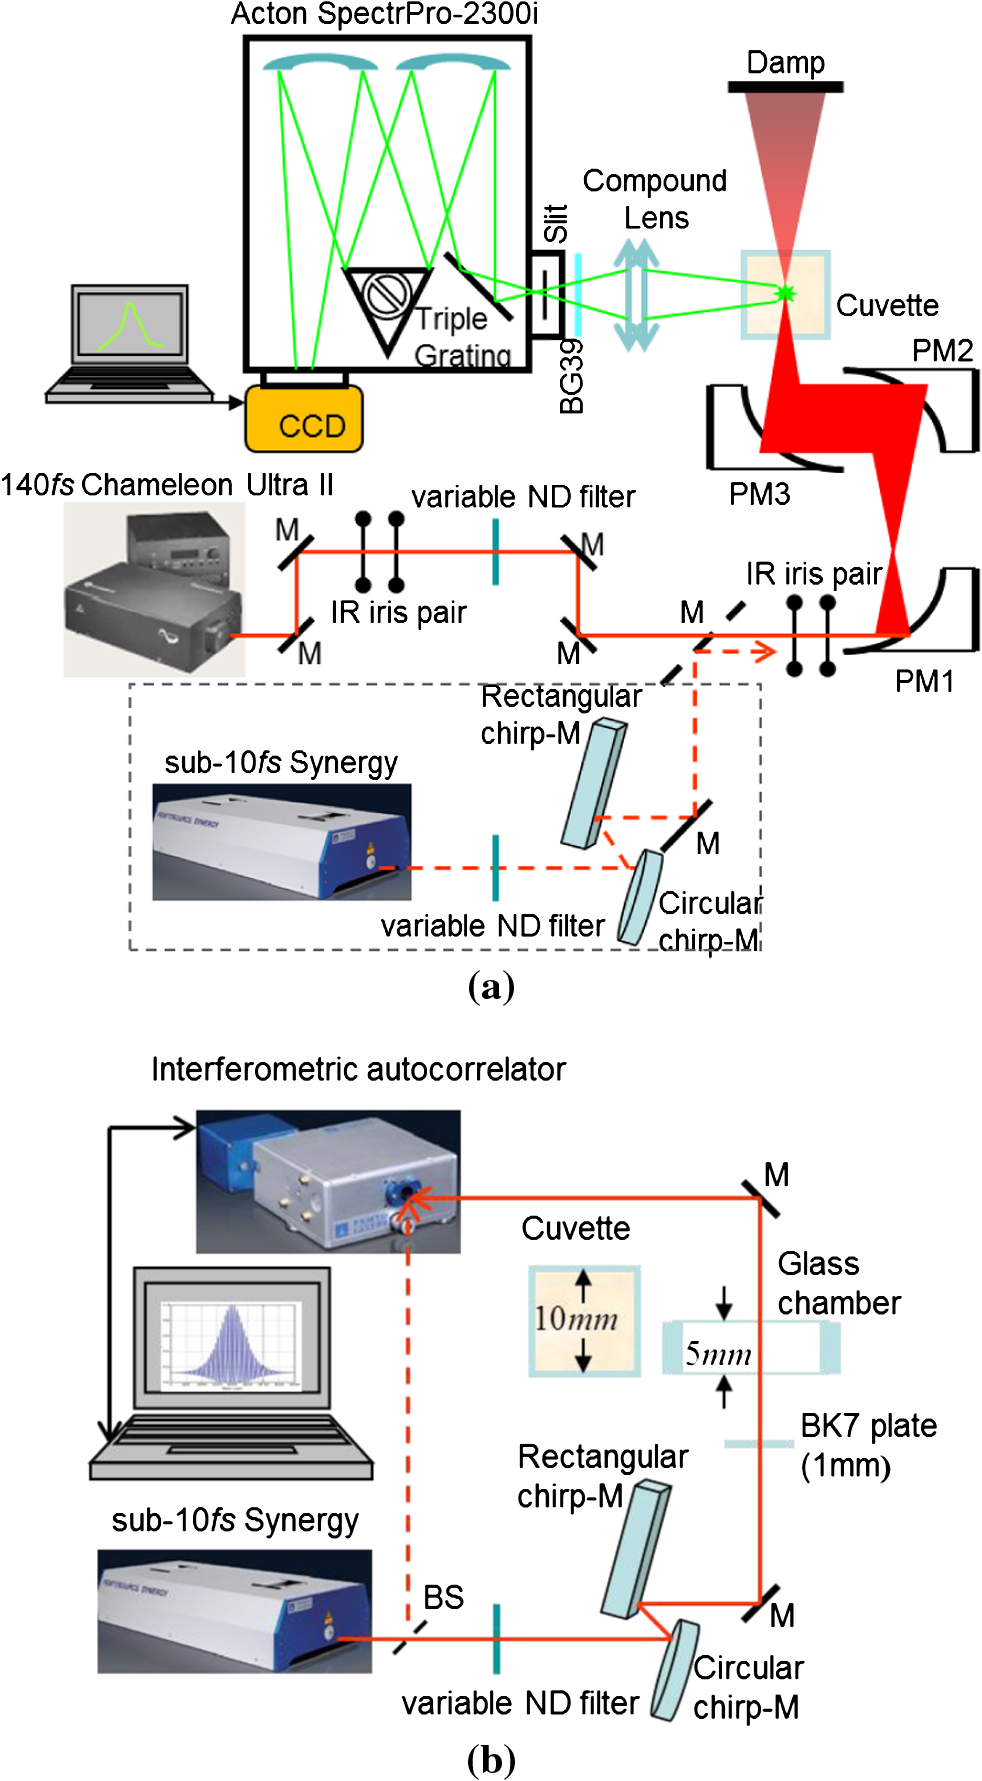 Intrinsic sub-10 mode-locked pulse from the untuned laser is characterized by its interferometric autocorrelation (IA) trace measured with an autocorrelator (Femtometer, Femtolasers). IA measurement is capable of better resolving -pulses because the interferometric fringes contained in IA trace reveal some phase and coherence information about the -pulses.13 GDD compensation for delivery of sub-10 TLP in situ was tested with the setup shown in Fig. 1(b), where the ND filter, 1.0 mm BK7 plate, and a home-built 5.0-mm-path-length glass chamber containing dye solution (two 150-μm-thick microscopic cover-glass slices as windows) were added to the beam path upstream of the autocorrelator. The optimal GDD compensation was confirmed by IA trace measurement, i.e., IA trace of the GDD-compensated sub-10 TLP in situ shown in Fig. 2(b) agrees well with that of the intrinsic sub-10 mode-locked pulse in Fig. 2(a). The optimal GDD compensation was achieved by one pair of light bounces off a rectangular chirp-mirror (GDD/bounce , GSM201, Femtolasers) and a circular chirp-mirror (GDD/bounce , GSM001, Femtolasers). 2.2.Dispersionless Laser Beam Expanding and FocusingDispersionless beam expanding and focusing [recall Fig. 1(a)] is accomplished with three gold-coated 90 deg off-axis parabolic mirrors, i.e., PM1 (effective focal length/EFL, 20.32 mm, 50328AU, Newport), PM2 (EFL 50.8 mm, NT47-098, Edmund Optics), and PM3 (EFL 25.4 mm, NT47-096, Edmund Optics), each of which has a 2-D tilt-adjustment and 3-D linear-translation for accurate alignment. This PM-combination is located at a distance from both laser exit apertures such that the beam size of the tunable 140 and untuned sub-10 laser beam is . The effective numerical aperture (NA) for beam focusing is , corresponding to an estimated14,15 axial intensity point spread function (IPSF) of by width. This estimated IPSF size in situ is much smaller than cuvette path-length and assumed to be a “point-like source” of fluorescence. Thus, the solid-angle of fluorescence con-beam collection is fixed, which makes TPEF measurements insensitive to slight variations in laser beam size.7 2.3.TPEF Collection with a Custom-Designed Compound Lens Coupled to the SpectrographA custom-designed compound lens16,17 was assembled, which consists of two bi-convex lenses in contact (KBX043 with focal-length 19 mm, KBX046 with focal-length 25.4 mm, LKIT-1, Newport); this was to achieve high NA for efficient fluorescence collection and small IPSF projected image onto the entrance-slit of the spectrograph for high spectral resolution. The resultant compound lens has an EFL of 13.75 mm, effective NA , and IPSF projected image size , with the object-distance (51.0 mm from the IPSF in situ to the effective front-principle-point) and image-distance (18.82 mm from the effective back-principle-point to the slit) designed for convenient phantom placement and compound lens adjustment. The lens-tube holder mounted on a triple-stage allowed compound-lens tilt-adjustment and linear-translation. The cuvette-holder was fixed on the optical table to ensure unchanged IPSF position with dye-phantom replacement. The 300 grooves/mm (BLZ 500 nm) grating was selected in the spectrograph (focal length 300 mm, Acton SpectrPro-2300i, Princeton Instruments), which was well focused onto the CCD camera (, pixel size 20 μm, PIXIS100, Princeton Instruments). A bandpass filter (spectral window 325 to 620 nm, 3.0-mm-thick, Schott BG39) was attached to the entrance slit to block scattered laser light. With the slit width set at 200 μm (greater than the IPSF projected image size), the achieved spectral resolution was . 3.Results and DiscussionTPE and OPA spectra are shown for Indo-1 [Fig. 3(a)], FITC [Fig. 3(b)], and TRITC [Fig. 3(c)]. TPE spectra are acquired by measuring TPEF intensities with 140 pulse central wavelength tuned from 700 to 900 nm at 10 nm increments. Indo-1, FITC, and TRITC exhibit TPE maxima at 730, 800, and 840 nm, respectively, which reside to high-frequency, on spectral peak, and to low-frequency of the sub-10 TLP spectrum shown in Fig. 3(d). Also shown in Fig. 3(d) are representative 140--pulse spectra centered at 730, 800, and 840 nm, which aptly illustrates differences in spectral bandwidth with the sub-10 pulse. By comparing TPE and OPA spectra, it is readily seen that the 140--tuning range, mirroring the FWTM bandwidth of sub-10 pulse, excites the dye molecules to TPA-associated final states degenerate with [Indo-1; Fig. 3(a)] and higher in energy [FITC and TRITC; Figs. 3(b) and 3(c)] than OPA-associated 1st-excited singlet state.18–21 With sub-10 TLP of broad FWTM bandwidth, these dye molecule excited states can be simultaneously accessed by degenerate and nondegenerate mixing of the untuned sub-10 pulse spectral components, beyond the capability of the narrowband 140 pulse. Thus, TPEF enhancement could be expected from greater population of two-photon excited dye-molecules owing to the simultaneous accessibility to TPA-associated final states promoted more readily by sub-10 TLP. Fig. 3TPE and OPA spectra of Indo-1 with TPE maximum at 730 nm (a), of FITC with maximum at 800 nm (b), and of TRITC with maximum at 840 nm (c). Laser spectra of the untuned sub-10 pulse at 792 nm and 140 pulse tuned to 730, 800, and 840 nm (d). 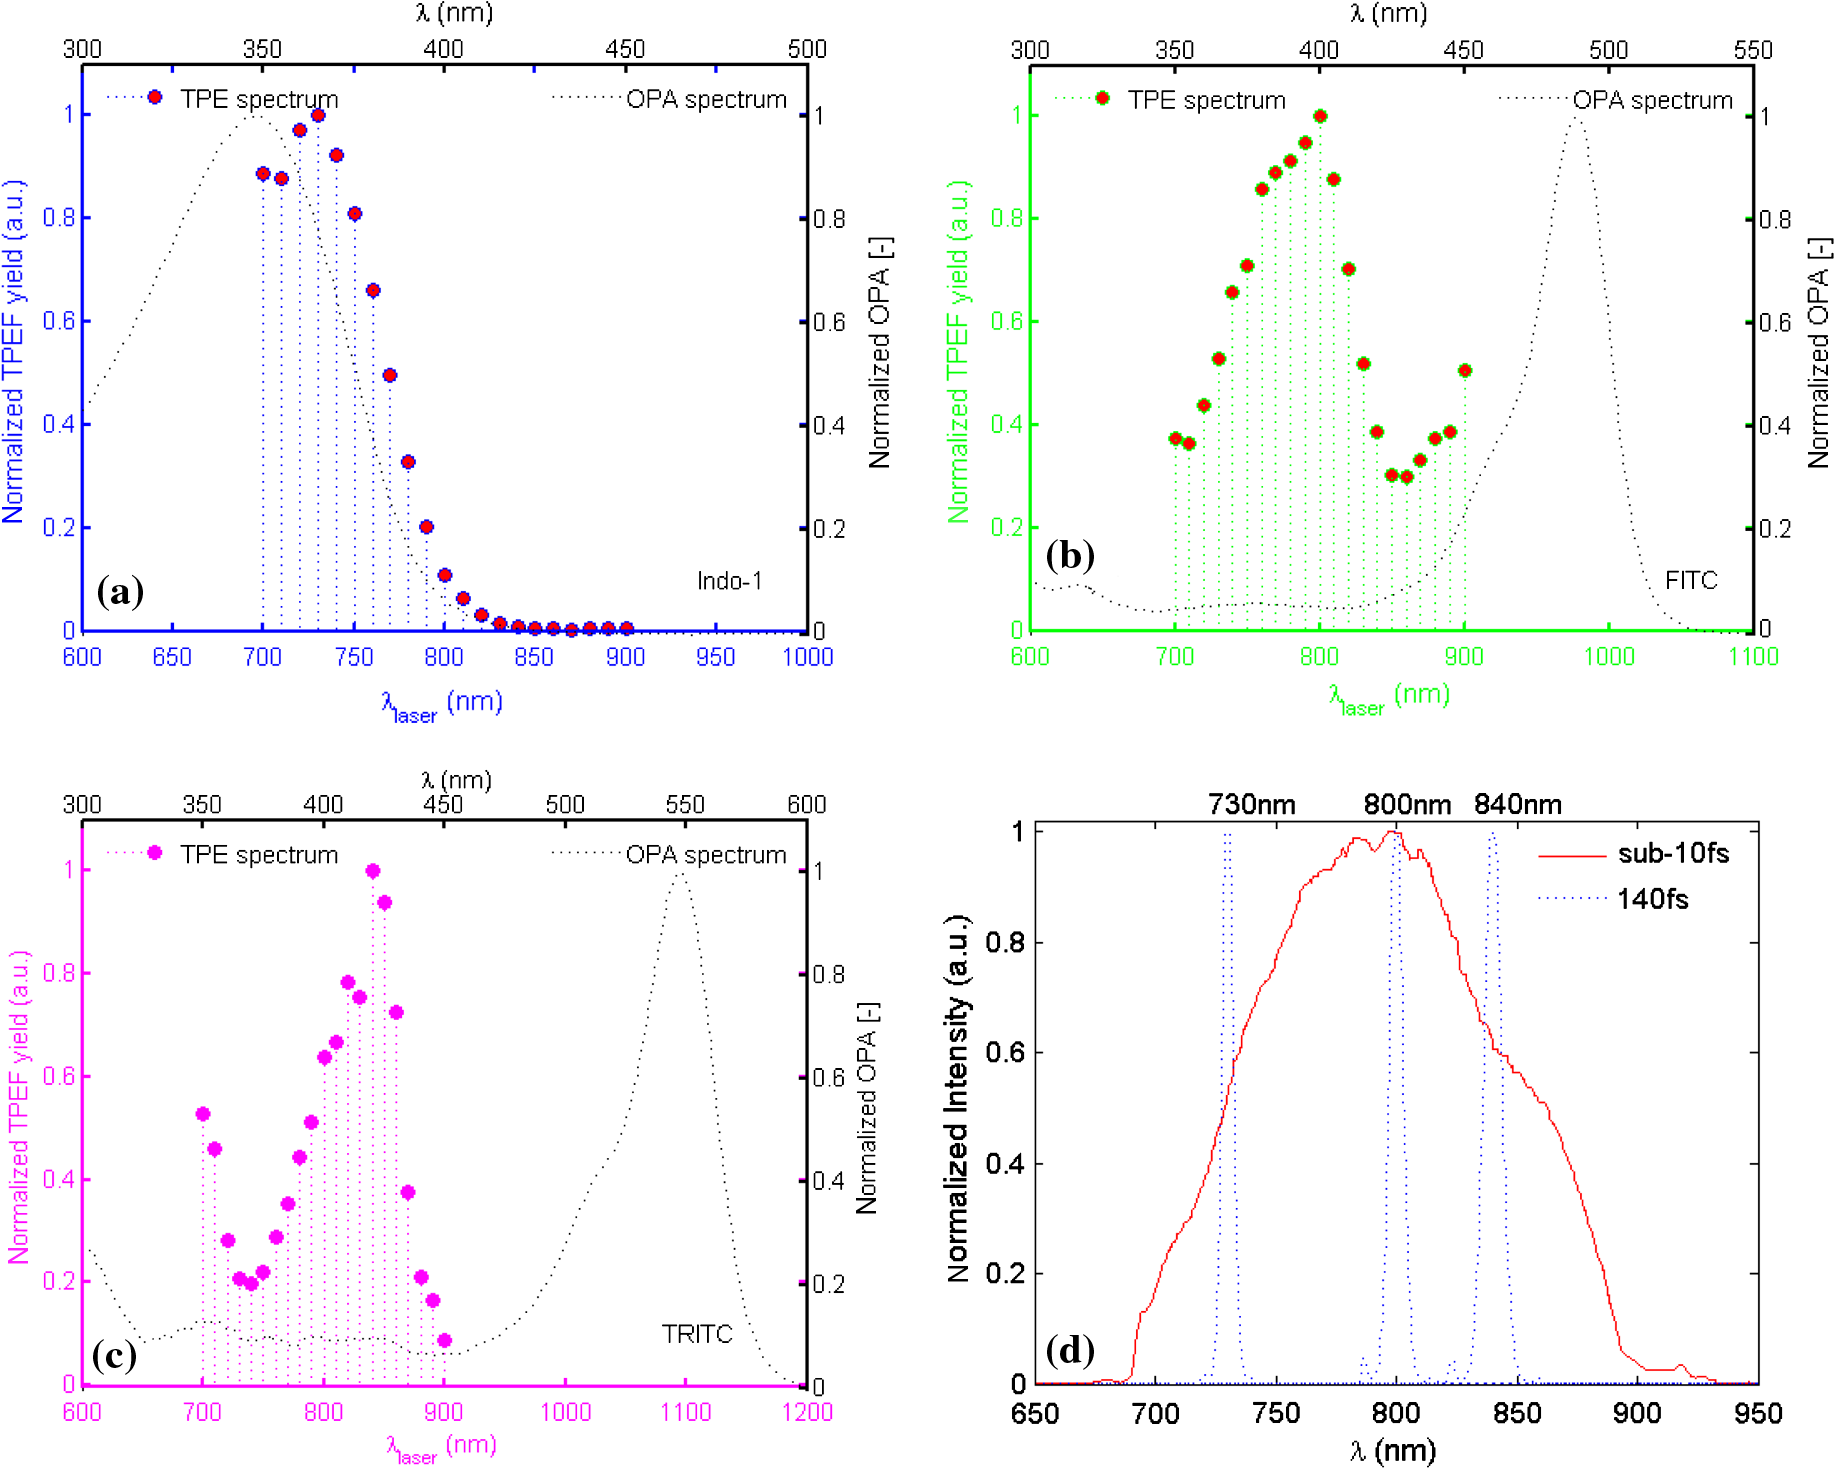 Power dependence of TPEF was previously measured for the three dyes to find the suitable excitation power range in which nonresonant TPEF holds.21 With 140 pulse central wavelength tuned to TPE maxima of Indo-1, FITC, and TRITC at 730, 800, and 840 nm, respectively, fluorescence yields were integrated from measured spectra, which are shown on logarithmic plots as a function of excitation power in Fig. 4. For reference, a dash-line of slope 2 is shown to denote the square-law dependence.7,18 Subtle deviations from the square-law suggest onsets of saturation or higher-order nonlinearities. Power dependence measurements are likewise performed with the untuned sub-10 TLP, whose results are shown in Fig. 5. Deviations from the square-law occur for all three dyes at excitation powers above 40 mW. Conservatively, excitation power of 20 mW is used for all TPEF measurements. To make direct comparisons of TPEF yields excited with 140 and sub-10 TLP, all the measured TPEF spectra are normalized to exposure-time for each phantom (5.25, 13.9, and 0.45 sec for Indo-1, FITC, and TRITC, respectively, with 140 pulse excitation; 14.5, 10.1, and 0.44 sec for Indo-1, FITC, and TRITC, respectively, with sub-10 TLP excitation). 3-D plots are shown in Fig. 6 of normalized TPEF spectra ( and -axis) for each phantom with respect to 140 pulse tuned wavelengths (-axis; excitation with sub-10 TLP at 792 nm). With TPEF yield obtained by integrating the normalized TPEF spectrum, TPEF enhancement is defined as the ratio of TPEF yield excited by the sub-10 TLP to that by 140 pulse tuned to a specific wavelength. Overall TPEF enhancements readily observed in all three phantoms (Fig. 6) show noticeable advantages of excitation with broadband sub-10 TLP over narrowband tunable 140 pulse. At TPE maxima for Indo-1, FITC, and TRITC with 140 pulse tuned to 730 nm, 800 nm, and 840 nm, respectively, TPEF enhancements of 1.6, 6.7, and 5.2 are measured (summarized in Table 1). Fig. 4Logarithmic plots of fluorescence yields versus excitation power (10 to 150 mW at 5 mW increments) with 140 pulse tuned to 730, 800, and 840 nm for Indo-1, FITC, and TRITC, respectively. Dashed lines with slope 2 are shown for reference. 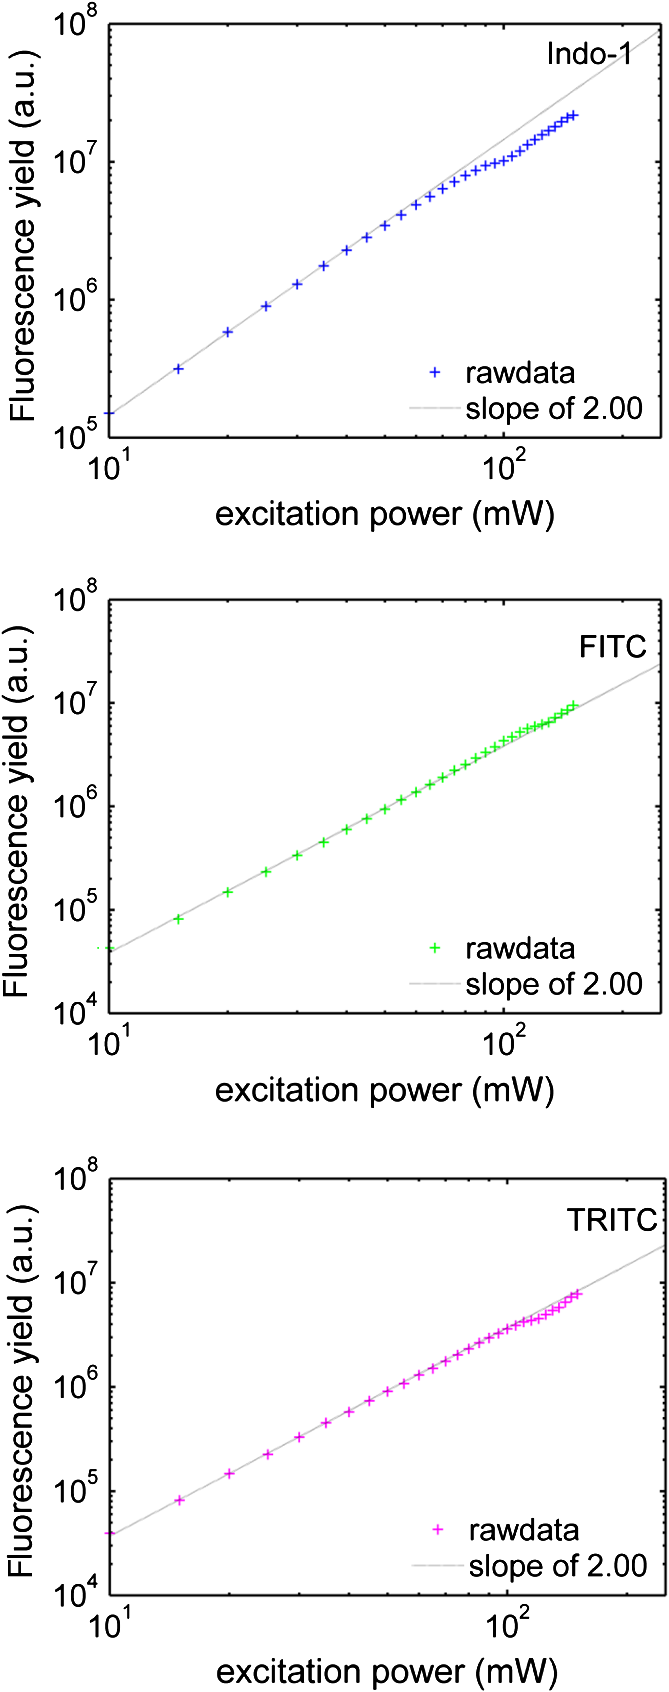 Fig. 5Logarithmic plots of fluorescence yields versus excitation power (10 to 150 mW at 5 mW increments) with sub-10 TLP excitation at 792 nm for Indo-1, FITC, and TRITC. Dashed lines with slope 2 are shown for reference.  Fig. 6Normalized TPEF spectra of Indo-1 (peaked at 498 nm), FITC (peaked at 523 nm), and TRITC (peaked at 578 nm) shown in 3-D plots as a function of emission wavelength (- and -axis) in relation to laser excitation wavelength of sub-10 TLP at 792 nm and 140 pulse tuned from 700 to 900 nm at 10 nm increments (-axis). 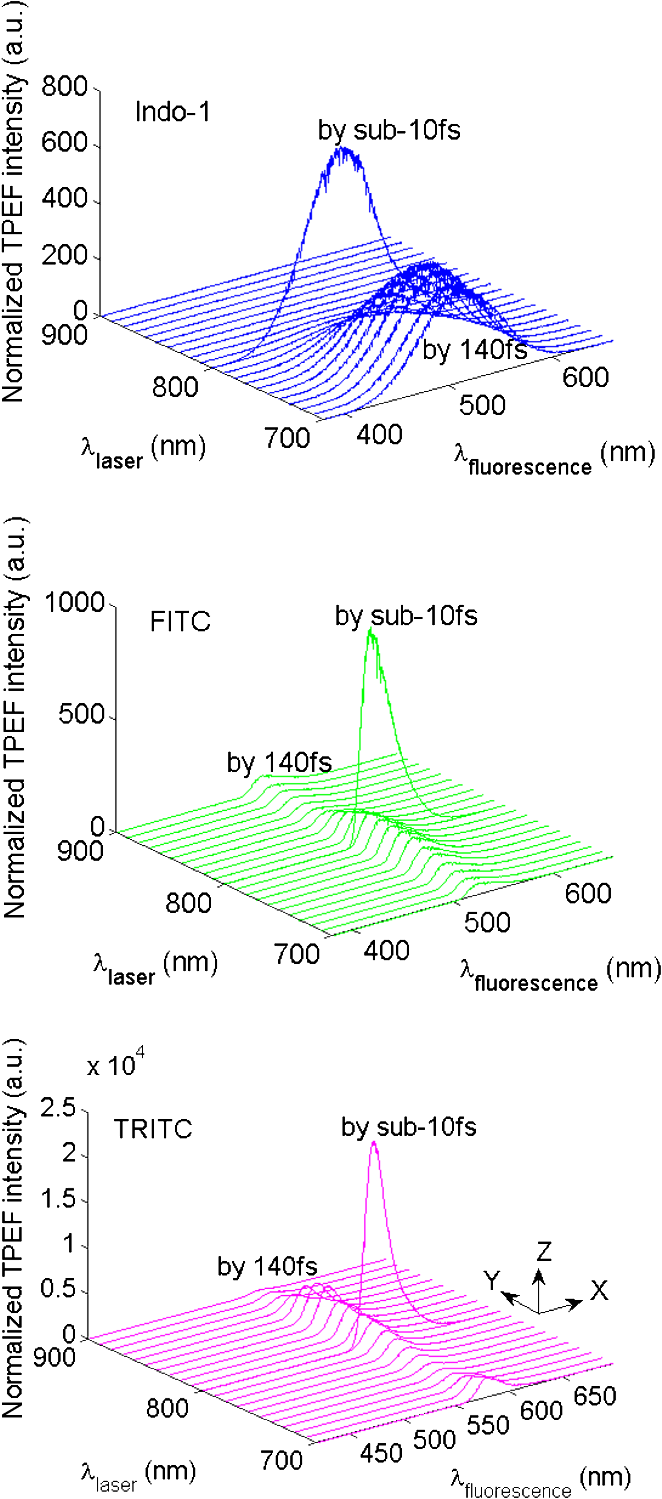 Table 1Measured and calculated TPEF enhancements
Differentiated TPEF enhancements among the three dye-phantoms suggest that the measured enhancements depend on the overlap between dye TPE and -pulse SH power spectra.22 Assuming dye TPE are proportional with corresponding TPA spectra, TPEF enhancement may be calculated by the ratio of two-photon transition probability () excited by sub-10 fsversus 140 pulse,7 or, where refers to TPEF yield. is calculated for each dye by the phenomenologically introduced formula,22 i.e.,where is frequency dependent TPE spectrum of the dye (refer to TPE spectra in Fig. 3), denotes two-photon transition energy, is the -pulse SH power spectrum (i.e., two-photon spectral density), is the -pulse spectrum, and stands for angular frequency of the -pulse. Transform-limited pulses are assumed with no phase terms added.Calculated TPEF enhancements for Indo-1, FITC, and TRITC with 140 pulse tuned to dye TPE maxima at 730, 800, and 840 nm are 3.4, 13.3, and 8.0, respectively. Measured and calculated TPEF enhancements are directly compared in Table 1 and show proportional agreement. This proportional agreement is supportive of the statement that the effective TPEF enhancement depends on the overlap of dye TPE and -pulse SH power spectra. Differences between measured and calculated TPEF enhancements (with a reduction factor of 1.5 to 2) may be ascribed to nonidealized experimental conditions including residual phase distortion in the -pulse excitations due to imperfect GDD compensation, deviations between dye TPE and two-photon absorption spectra, slight mismatch of laser pulse-repetition-rates, and differences in fluorescence collection efficiencies between two experimental setups. If frequency invariant response of a dye is assumed, i.e., be constant, then the two-photon transition probability, , is proportional to the integral of the -pulse SH power spectrum [refer to Eq. (2)]. The integrated SH power spectrum is indicative of TPE capability of the transform-limited -pulse. Using measured laser pulse spectra, ratios of sub-10 to 140 pulse (central wavelength at 730, 800, and 840 nm) integrated SH power spectra are shown in Table 1 with values between 11 and 14. In an idealized case of identical 10 and 140 pulse shapes, the ratio of integrated SH power spectra is 14. Together with our measured and calculated enhancements, these results suggest that optimization of TPEF does not depend solely on central wavelength tuning but ultimately on the overlap of dye TPE and -pulse SH power spectra. For ultrashort pulses, TPEF enhancement can be accomplished via broad SH power spectrum and high spectral density which results from both degenerate () and nondegenerate () mixing of pulse spectral components. These SH properties also suggest TPEF enhancements in selective excitation schemes by coherent quantum control of broadband -pulse23–25 relative to narrowband -pulse tuning. However, these advantages of broadband -pulse excitation may be mitigated in cases where the dye TPE maximum is detuned such that the -pulse SH power spectrum overlaps with low absorptive wing (e.g., fluorescent protein variants Venus and DsRed26). In addition, parameters such as residual spectral phase and shape can have dramatic effects on the overlap integral5 in Eq. (2). Just as TPEF enhancements are observed in individual dyes with TPE maxima across the sub-10 pulse spectrum, the broad SH power spectrum and high spectral density of sub-10 TLP suggests an efficient excitation scheme for multicolor TPM applications. To validate this hypothesis, multicolor TPEF enhancements are quantified with a mixture of the three dyes excited by the untuned sub-10 TLP and tunable 140 pulse. Individual dye-phantoms (100 μM) of Indo-1, FITC, and TRITC were mixed at the volume ratio of 27:17:1 based on their relative brightness (cf., Fig. 6). TPEF spectra of the mixture are shown in Fig. 7 excited by sub-10 TLP and 140 pulse tuned to 730 nm [Fig. 7(a)], 800 nm [Fig. 7(b)], and 840 nm [Fig. 7(c)]. Consistent with individual dye TPEF enhancements (recall Fig. 6), multicolor TPEF signals excited by sub-10 TLP are overall stronger than those by 140 pulse tuned to TPE maxima. The readily achieved enhancement by the untuned broadband -pulse would greatly improve discernibility of the generated multicolor TPEF spectrum and facilitate detectability of multicolor TPM imaging from which post data processing could benefit. This capability of untuned broadband -pulse excitation for multicolor TPEF enhancement would not be well recognized without considering extensive overlap of its broad SH power spectrum with the TPE spectra of the constituent dyes in the mixture. In contrast with broadband sub-10 TLP excitation, the TPEF spectra of Fig. 7 also show that optimizing the central wavelength of 140 pulse for excitation of one dye comes at the expense of degraded excitation for the others. This observation is particularly acute for Indo-1 with significantly reduced TPEF when excited by 140 pulse tuned to 800 nm [Fig. 7(b), inset] and 840 nm [Fig. 7(c), inset]. Fig. 7Normalized mixture TPEF spectrum (Indo-1, FITC, and TRITC) excited by sub-10 TLP at 792 nm (red) and by 140 pulse (blue) tuned to (a) 730 nm, (b) 800 nm, and (c) 840 nm. Insets show the close-up of the normalized mixture TPEF spectrum excited by 140 pulse.  Nonetheless, multicolor TPEF spectrum of the mixture is not simply a linear summation of individual dye spectra. Individual dye TPEF spectra with sub-10 TLP excitation, scaled by the respective volume ratio, and its linear summation are shown in Fig. 8(a). Discrepancies of the summed with the measured mixture TPEF spectra [Fig. 8(c)] are observed particularly with respect to Indo-1 and TRITC spectral peak positions. A number of factors could contribute to this observation, including mutual OPA of TPEF (Ref. 27) and environmental influences (i.e., solvent effects).28 Measured FITC and TRITC OPA spectra at mixture concentrations are shown in Fig. 8(b) and exhibit significant overlap with Indo-1 and FITC TPEF spectra. In addition, TRITC TPEF exhibited a marked blue-shift and reduction in intensity when dissolved in mixture solvents of water and methanol compared to methanol alone. This blue-shift and reduced intensity is due to some combination of solvent effects29 and reduced self-quenching.30 Thus, to simulate the mixture TPEF spectrum, individual Indo-1 and FITC TPEF spectra weighted by their respective mixture volume fraction were summed with TRITC TPEF acquired in (methanol/water) mixture solution. Absorption of mixture TPEF is introduced through Beer’s law using measured FITC and TRITC OPA spectra shown in Fig. 8(b) and assuming half the cuvette path-length. The resultant multicolor spectrum by simulation shows good agreement with the measured mixture TPEF spectrum as seen in Fig. 8(c). Fig. 8(a) Linear summation (dash-black) and individual TPEF spectra of Indo-1 (blue), FITC (green), and TRITC (red) scaled by mixture volume ratio. (b) Measured OPA spectra of FITC (green) and TRITC (red) at mixture concentrations. (c) Measured (red) and simulated (blue) multicolor TPEF spectra that incorporate OPA contributions from FITC and TRITC and solvent effect plus reduced self-quenching of TRITC.  These observations illustrate some issues relevant to multicolor TPM imaging, in particular, perturbed TPEF profiles from OPA and environmental effects. However, practical evaluation of environmental influences for TPM imaging should be made with great caution due to their high complexity and entanglement.28,30 Although imaging depth should be taken into account, frequency dependence of optical scattering and absorption in thick tissue samples can modulate TPEF profiles;31 however, this effect was not studied here. Implied in our results is the importance of dispersion management especially for broadband -pulses to realize the reported enhancements. For TPM using pulses as short as sub-10 , dispersion management is nontrivial but has been demonstrated.32,33 4.ConclusionsThis comparative study highlights some tradeoffs in using broadband versus tunable -pulse lasers for TPM. The results are consistent with previous works, which suggest that TPEF can be effectively enhanced by using -pulse of shorter durations. However, as -pulse duration decreases, its spectral bandwidth increases such that the spectrum of sub-10 pulses contains the effective gain bandwidth of Ti:Sapphire and its central wavelength is no longer tunable. Herein, TPEF enhancements are quantified for a series of individual dye phantoms excited by sub-10 and 140 pulses with TPE maxima across the narrowband -pulse tuning range. Measured enhancement factors of 1.6, 6.7, and 5.2 for Indo-1, FITC and TRITC, respectively, are in proportional agreement with theoretical values, owing to the broad SH power spectrum and high spectral density of sub-10 TLP. It is believed that these SH properties can effectively compensate for the lack of central wavelength tuning, enabling its larger spectral overlap with dye TPE spectra compared to 140 pulse excitation. The advantages of sub-10 TLP are also exploited for multicolor TPEF enhancement with a mixture of dyes to demonstrate its potential applications in TPM. Of note are the entangled OPA and solvent effects in interpreting the multicolor TPEF spectrum from the mixture and the compromised excitation scheme with narrowband 140 pulse central wavelength tuning. Also, implicit in this study is the essential need for dispersion management of sub-10 pulses to realize the enhancements reported and translate to TPM. AcknowledgmentsSpecial thanks are given to Brad Collier and Dr. Mike McShane at Texas A&M University for their help with OPA measurements. We thank Dr. Brian E. Applegate at Texas A&M University for use of the tunable Ti:Sapphire laser. We are grateful to Dr. Kenith Meissner at Texas A&M University for use of the triple-grating spectrograph, helpful discussion on OPA effect, and critical comments on the paper. We thank the Microscopy and Imaging Center at Texas A&M University for use of the sub-10 Ti:Sapphire laser. We also thank the reviewers for their helpful comments. This research was supported in part by the National Science Foundation [Faculty Early Career Development (CAREER) Award and CBET-1033660]. ReferencesW. R. ZipfelR. M. WilliamsW. W. Webb,
“Nonlinear magic: multiphoton microscopy in the biosciences,”
Nat. Biotechnol., 21
(11), 1369
–1377
(2003). http://dx.doi.org/10.1038/nbt899 NABIF9 1087-0156 Google Scholar
P. TheerW. Denk,
“On the fundamental imaging-depth limit in two-photon microscopy,”
J. Opt. Soc. Am. A, 23 3139
–3149
(2006). http://dx.doi.org/10.1364/JOSAA.23.003139 JOAOD6 0740-3232 Google Scholar
W. DenkJ. H. StricklerW. W. Webb,
“Two-photon laser scanning fluorescence microscopy,”
Science, 248 73
–76
(1990). http://dx.doi.org/10.1126/science.2321027 SCIEAS 0036-8075 Google Scholar
P. TheerM. T. HasanW. Denk,
“Two-photon imaging to a depth of 1000 µm in living brains by use of a regenerative amplifier,”
Opt. Lett., 28 1022
–1024
(2003). http://dx.doi.org/10.1364/OL.28.001022 OPLEDP 0146-9592 Google Scholar
C. J. Bardeenet al.,
“Effect of pulse shape on the efficiency of multiphoton processes: implications for biological microscopy,”
J. Biomed. Opt., 4 362
–367
(1999). http://dx.doi.org/10.1117/1.429937 JBOPFO 1083-3668 Google Scholar
V. V. Lozovoyet al.,
“Applications of ultrashort shaped pulses in microscopy and for controlling chemical reactions,”
Chem. Phys., 350 118
–124
(2008). http://dx.doi.org/10.1016/j.chemphys.2008.01.025 CMPHC2 0301-0104 Google Scholar
C. XuW. W. Webb,
“Measurement of two-photon excitation cross sections of molecular fluorophores with data from 690 to 1050 nm,”
J. Opt. Soc. Am. B, 13 481
–491
(1996). http://dx.doi.org/10.1364/JOSAB.13.000481 JOBPDE 0740-3224 Google Scholar
S. Tanget al.,
“Effect of pulse duration on two-photon excited fluorescence and second harmonic generation in nonlinear optical microscopy,”
J. Biomed. Opt., 11
(2), 020501-1
–020501-3
(2006). http://dx.doi.org/10.1117/1.2177676 JBOPFO 1083-3668 Google Scholar
G. McConnell,
“Improving the penetration depth in multiphoton excitation laser scanning microscopy,”
J. Biomed. Opt., 11 054020-1
–054020-7
(2006). http://dx.doi.org/10.1117/1.2360593 JBOPFO 1083-3668 Google Scholar
S. Panget al.,
“Beyond the 1/Tp limit: two-photon-excited fluorescence using as short as sub-10-,”
J. Biomed. Opt., 14
(5), 054041-1
–054041-7
(2009). http://dx.doi.org/10.1117/1.3253388 JBOPFO 1083-3668 Google Scholar
X. LiangW. HuL. Fu,
“Pulse compression in two-photon excitation fluorescence microscopy,”
Opt. Express, 18
(14), 14893
–14904
(2010). http://dx.doi.org/10.1364/OE.18.014893 OPEXFF 1094-4087 Google Scholar
P. F. Moulton,
“Spectroscopic and laser characteristics of ,”
J. Opt. Soc. Am. B, 3
(1), 125
–133
(1986). http://dx.doi.org/10.1364/JOSAB.3.000125 JOBPDE 0740-3224 Google Scholar
A. M. Weiner, Ultrafast Optics, John Wiley & Sons, Hoboken, NJ
(2009). Google Scholar
B. RichardsE. Wolf,
“Electromagnetic diffraction in optical systems, II. structure of imaging field in an aplanatic system,”
Proc. Roy. Soc. London A, 253
(1274), 358
–379
(1959). http://dx.doi.org/10.1098/rspa.1959.0200 PRLAAZ 0080-4630 Google Scholar
C. J. R. SheppardH. J. Matthews,
“Imaging in high-aperture optical system,”
J. Opt. Soc. Am. A, 4
(8), 1354
–1360
(1987). http://dx.doi.org/10.1364/JOSAA.4.001354 JOAOD6 0740-3232 Google Scholar
F. A. JenkinsH. E. White, Fundamentals of Optics, 4th ed.McGraw-Hill, New York
(1976). Google Scholar
R. KingslakeR. B. Johnson, Lens Design Fundamentals, 2nd ed.Academic Press, Elsevier, Burlington, MA
(2010). Google Scholar
R. W. Boyd, Nonlinear Optics, 2nd ed.Academic Press, San Diego, CA
(2003). Google Scholar
J. W. LichtmanJ. A. Conchello,
“Fluorescence microscopy,”
Nat. Methods, 2
(12), 910
–919
(2005). http://dx.doi.org/10.1038/nmeth817 1548-7091 Google Scholar
T. N. SmirnovaE. A. TikhonovM. T. Shpak,
“Vibronic structure in the spectra of two-photon absorption of organic dye solutions,”
JETP Lett., 29
(8), 411
–414
(1979). JTPLA2 0021-3640 Google Scholar
Y. R. Shen, The Principles of Nonlinear Optics, John Wiley & Sons, New York
(1984). Google Scholar
D. MeshulachY. Silberberg,
“Coherent quantum control of multiphoton transitions by shaped ultrashort optical pulses,”
Phys. Rev. A, 60
(2), 1287
–1292
(1999). http://dx.doi.org/10.1103/PhysRevA.60.1287 PLRAAN 1050-2947 Google Scholar
T. Brixneret al.,
“Photoselective adaptive femtosecond quantum control in liquid phase,”
Nature, 414
(6859), 57
–60
(2001). http://dx.doi.org/10.1038/35102037 NATUAS 0028-0836 Google Scholar
V. V. LozovoyM. Dantus,
“Systematic control of nonlinear optical processes using optimally shaped femtosecond pulses,”
Chem. Phys. Chem., 6
(10), 1970
–2000
(2005). http://dx.doi.org/10.1002/(ISSN)1439-7641 CPCHFT 1439-4235 Google Scholar
J. P. Ogilvieet al.,
“Fourier transform measurement of two-photon excitation spectra: applications to microscopy and optimal control,”
Opt. Lett., 30
(8), 911
–913
(2005). http://dx.doi.org/10.1364/OL.30.000911 OPLEDP 0146-9592 Google Scholar
H. Hashimotoet al.,
“Measurement of two-photon excitation spectra of fluorescence proteins with nonlinear Fourier-transform spectroscopy,”
Appl. Opt., 49
(17), 3323
–3329
(2010). http://dx.doi.org/10.1364/AO.49.003323 APOPAI 0003-6935 Google Scholar
A. J. Raddosevichet al.,
“Hyperspectral in vivo two-photon microscopy of intrinsic contrast,”
Opt. Lett., 33
(18), 2164
–2166
(2008). http://dx.doi.org/10.1364/OL.33.002164 OPLEDP 0146-9592 Google Scholar
A. P. Demchenkoet al.,
“Monitoring biophysical properties of lipid membranes by environmental-sensitive fluorescent probes,”
Biophys. J., 96
(9), 3461
–3470
(2009). http://dx.doi.org/10.1016/j.bpj.2009.02.012 BIOJAU 0006-3495 Google Scholar
A. NagD. Goswami,
“Solvent effect on two-photon absorption and fluorescence of rhodamine dyes,”
J. Photochem. Photobiol. A, 206
(2), 188
–197
(2009). http://dx.doi.org/10.1016/j.jphotochem.2009.06.007 JPPCEJ 1010-6030 Google Scholar
J. R. Lakowicz, Principles of Fluorescence Spectroscopy, 3nd ed.Springer, New York
(2006). Google Scholar
K. VishwanathM. A. Mycek,
“Do fluorescence decays remitted from tissues accurately reflect intrinsic fluorescence lifetime?,”
Opt. Lett., 29
(13), 1512
–1514
(2004). http://dx.doi.org/10.1364/OL.29.001512 OPLEDP 0146-9592 Google Scholar
A. M. LarsonA. T. Yeh,
“Ex vivo characterization of sub-10- pulses,”
Opt. Lett., 31
(11), 1681
–1683
(2006). http://dx.doi.org/10.1364/OL.31.001681 OPLEDP 0146-9592 Google Scholar
P. Xiet al.,
“Two-photon imaging using adaptive phase compensated ultrashort laser pulses,”
J. Biomed. Opt., 14
(1), 014002-1
–014002-7
(2009). http://dx.doi.org/10.1117/1.3059629 Google Scholar
|