|
|
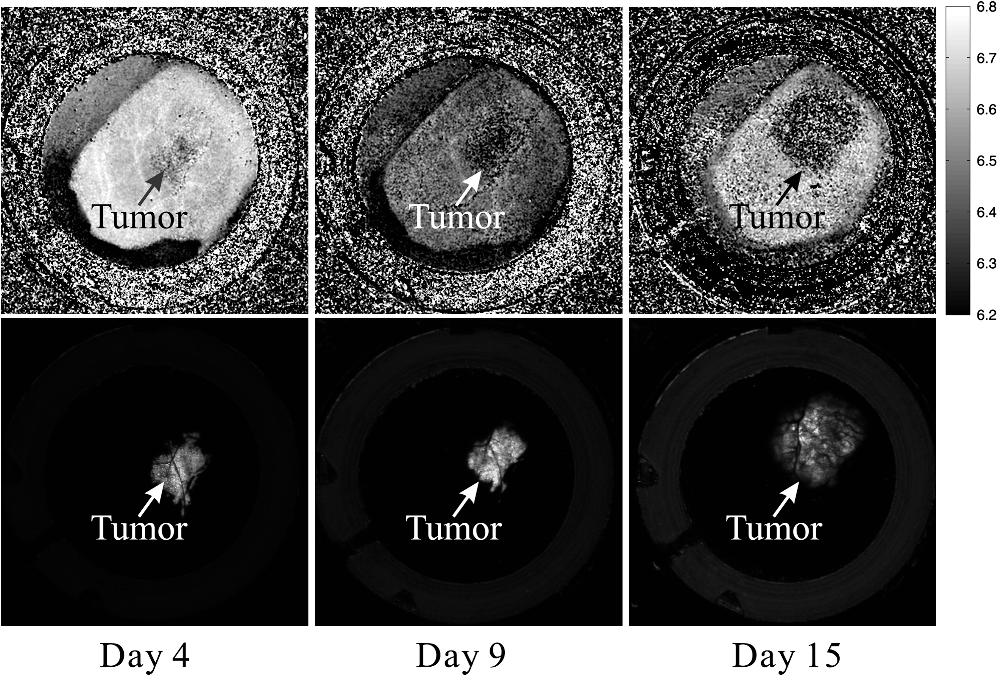
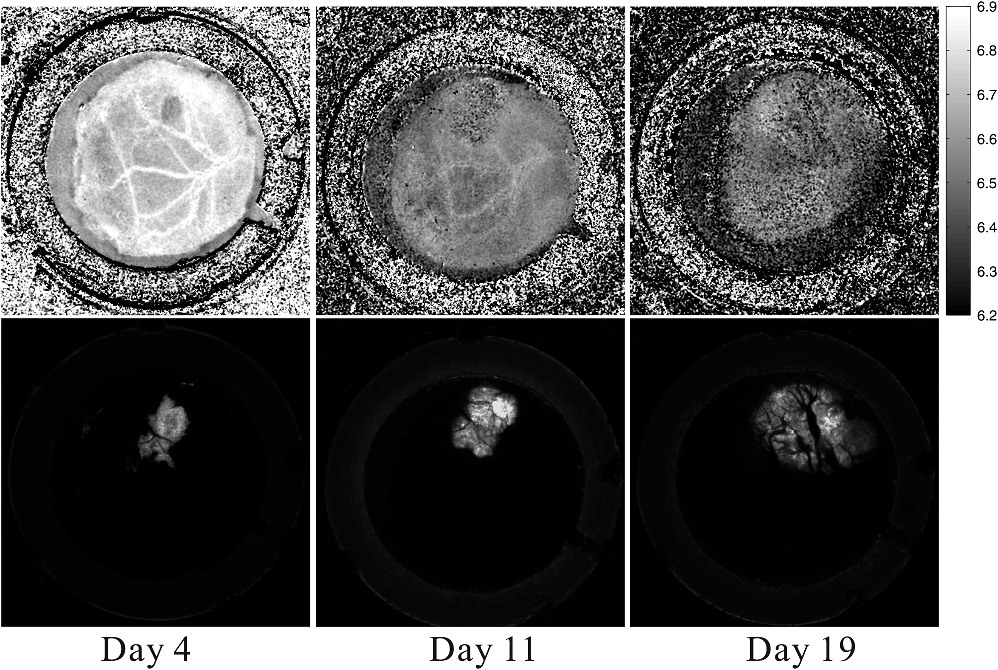
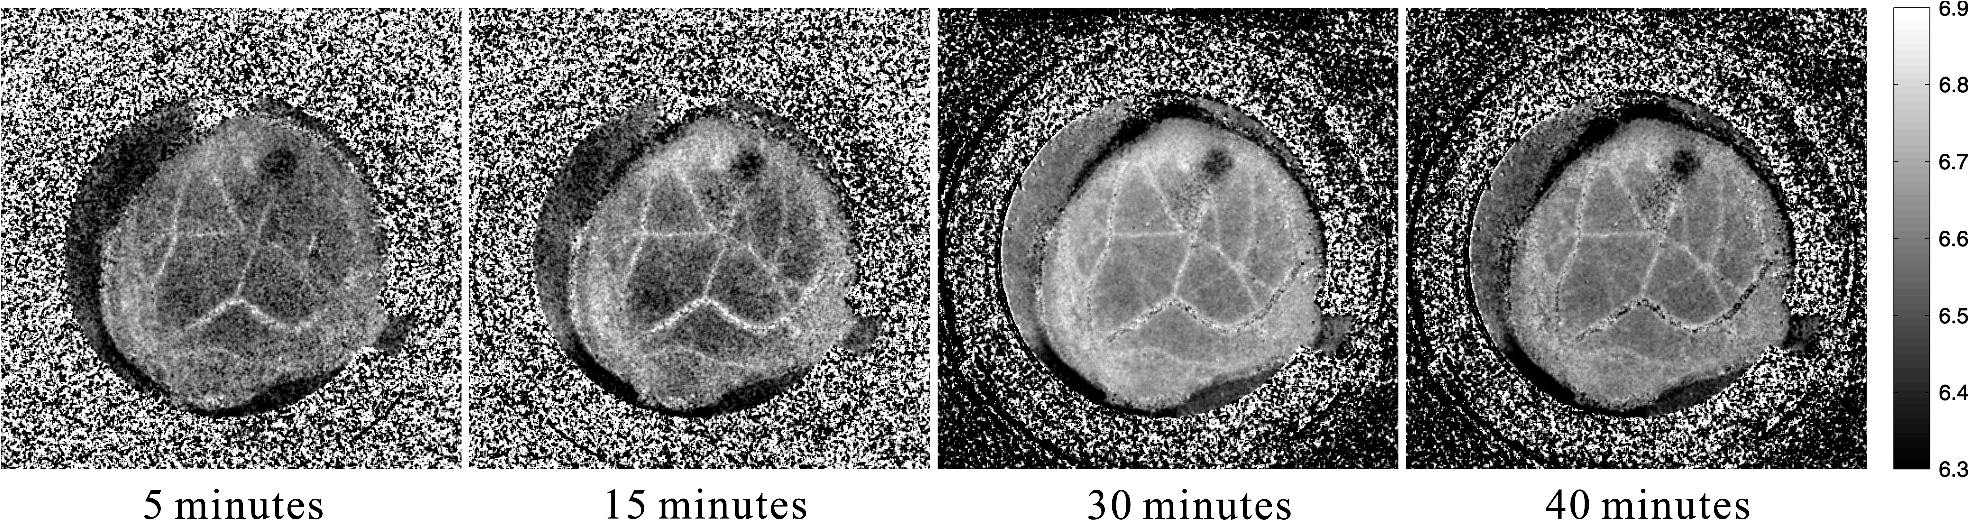
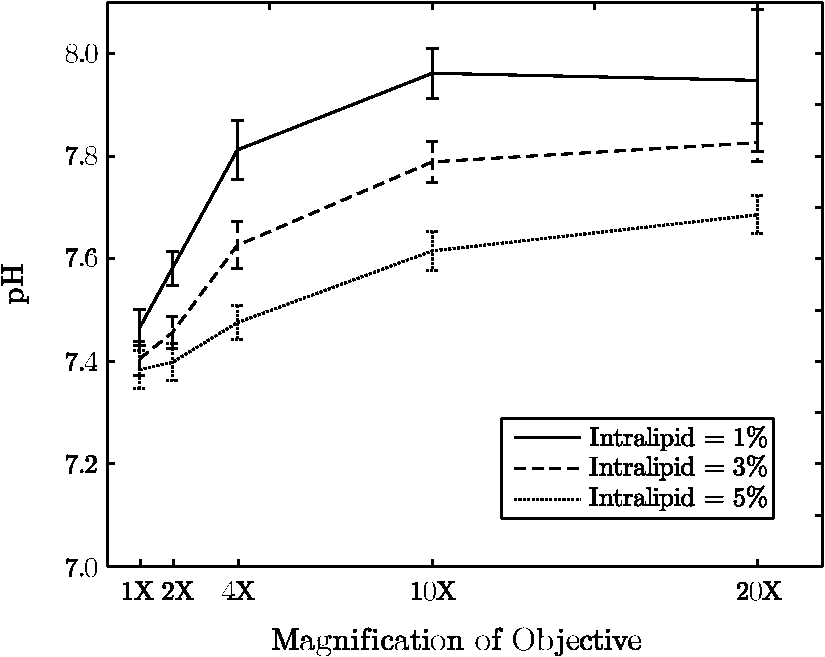
1.IntroductionThe pH of tumors and surrounding tissues is a key biophysical property of the tumor microenvironment that affects how a tumor survives, proliferates, and invades surrounding normal tissue.1–3 Intracellular pH is typically highly regulated, but extracellular pH can vary significantly during carcinogenesis. The measurement of extracellular pH is therefore important for studying tumorigenesis and its relationship to physiologic and metabolic factors such as angiogenesis, glycolysis, and hypoxia. Ratiometric fluorescence imaging is a method commonly used to measure variations of calcium ions,4,5 pH levels,6,7 and membrane potentials8,9 within tissue. The emission spectra of certain fluorescent probes undergo a parameter-dependent wavelength shift, thus allowing estimation of a parameter, such as pH, by first calculating the ratio of the fluorescence intensities from the fluorophore at two emission wavelengths and then relating this back to the parameter of interest through a calibration procedure. In order to image pH via optical means in live animals, access to the tissue of interest must be achieved. One experimental method to allow such access is the window chamber. Window chambers are support structures implanted in animals to allow direct visual access to tissues. A common type of window chamber is that placed in the dorsal skin-fold of a rodent, where the dorsal skin is pulled up and clamped into the window chamber. A portion of the outer skin is removed and a cover glass is inserted over the area of exposed tissue. This technique was developed in the 1940s,10,11 and improved over the years.12 It has been widely used in tumor microcirculation studies. We have employed ratiometric fluorescence imaging on a laser scanning confocal microscope to measure the pH distribution around tumors growing in a window-chamber model system. We have noted significant variations in the quantitation of pH via this approach. In this paper, we first present the experimental methods used to measure pH and then investigate and discuss the factors that affect the bias and uncertainty in the pH results that are achieved. The factors considered are photon noise, estimator bias, instrument errors, temperature dependence, and calibration error due to scattering and other biological factors. 2.Materials and MethodsSevere combined-immuno-deficient (SCID) mice were used in the experiments. A flap of skin on the back of a mouse was pulled and clamped into a window chamber. The skin inside the chamber opening was removed on one side to expose the underlying smooth-muscle tissue. A cover glass was placed over the exposed tissue. Two days after the window chamber was installed, the cover glass was removed and the tissue within the chamber was injected with approximately 1 million prostate cancer cells (PC3 cancer cell line). The cancer cells were genetically modified to express green fluorescent protein (GFP), which was used to track the growth of the tumor. The visible region of the tissue inside the window chamber was 13 mm in diameter. The window chambers generally remained functional for about three weeks, allowing serial measurement of pH at different stages of tumorigenesis. Carboxy SNARF-1 (Invitrogen, Carlsbad, CA), a pH probe for near-neutral pH imaging, was used to investigate the extracellular pH of tissue within the window chambers. This dye is excited efficiently in the 480 to 550 nm wavelength range. Carboxy SNARF-1 has dual emission peaks at 580 and 640 nm owing to the protonated and deprotonated forms of the molecule. The relative amount of fluorescence between the emission peaks varies as the local pH environment changes, thus allowing the ratio of the fluorescence intensities from the dye at two emission wavelengths to be used to determine pH. Images were acquired using a Nikon Eclipse E600 microscope with a C1 confocal module (Nikon Instruments, Melville, NY). In order to image the whole window chamber, a Nikon 1X/0.04NA CFI Plan UW objective was used. The pinhole of the confocal microscope was opened as far as possible to a diameter of 150 μm (corresponding to 75 μm in object space) to maximize the photon-collection efficiency. With the objective lens and pinhole setting above, the system was expected to have a lateral resolution of 9 μm and an axial section thickness of approximately 2 mm. Scattering will lead to an even smaller section thickness at the surface. There is potential for partial volume effects (mixing of cancerous and noncancerous tissue in the section) and the results represent the average pH within the measured volume. GFP images were captured with Ar-ion-laser (488 nm, 250 μW) excitation and a bandpass (channel 1) emission filter. Carboxy SNARF-1 was excited using a green He-Ne laser (543 nm, 240 μW). To collect the emitted fluorescence from SNARF-1, two emission filters, bandpass (channel 2) and 640 longpass (channel 3), were used. The mouse was placed on a custom holder, which was mounted on the microscope stage. Isoflurane was used to anaesthetize the animal during the imaging experiment. The GFP signal from channel 1 and background fluorescence from channel 2 and 3, and , were recorded before the injection of carboxy SNARF-1. 200 μl of 1-mM carboxy-SNARF-1 solution in phosphate-buffered saline (PBS) was injected via a tail-vein catheter. The emission signals from channel 2 and 3, and , increased slowly over a period of about 30 min following the injection. Images with a pixel resolution of over a field of view of were collected at 5, 15, and 30 min after injection. The PMT gains for the three channels were set to fixed values of 60, 90, and 110, respectively, to ensure consistency in all experiments. The dwell time per pixel was 6.96 μs, yielding a single-image collection time of 2.82 sec. Due to the low photon-emission rate from the sample, 10 images were taken successively and averaged to improve the signal-to-noise ratio (SNR) at each data-collection time point. There was no noticeable decay in signal level observed due to photobleaching at the exposures used. The imaging parameters described above were applied to both calibration and imaging processes. The ratiometric image, , of the tissue was computed as where and are the actual signal increases recorded in the two emission channels due to the influx of carboxy SNARF-1.The pH at each pixel in the image is obtained using the relationship13 where the values of , , and are estimated during a calibration procedure. A calibration curve was generated by measuring the fluorescence signals and from a series of HEPES-(4-(2-hydroxyethyl)-1-piperazineethanesulfonic acid) buffered 5-μM carboxy SNARF-1 solutions with varying pH. The solution pH was modified by starting with a basic solution at 7.4 pH and adding hydrochloric acid. The pH values were evenly spread between 6.2 and 7.4 over 15 calibration samples. The signal ratio of each sample was computed and Eq. (2) was fit to the data to estimate the values of , , and .3.Imaging ResultsSome typical results of pH imaging of tissues in window chambers are shown in Figs. 1–4 together with the corresponding GFP images that show location of the tumors with the identical field of view. The first row of each figure is the pH map of the window chamber and the second row is the corresponding GFP image. pH maps and GFP images in the same column were imaged on the same day. The number of days after the cancer-cell implantation is listed at the bottom of each column. The pH maps of the same mouse on different days are shown using the same scaling. Figure 1 shows a tumor that doubled in size between Day 4 and Day 15. The tumor appears darker (more acidic) than the surrounding tissue in the pH maps. The dark area correlates with the high-signal-intensity area in the corresponding GFP image. The GFP images in Fig. 2 also show a tumor that was growing over time; however, the pH images show some variability in how acidic the tumor is relative to the surrounding tissue. The latter time points show a tumor that appears to be more similar in pH to its surroundings. This may be due to the tumor becoming less acidic with increased vascular perfusion. Figure 3 shows a series of images where the size of the tumor on different imaging days appears similar. However, in this case, the tumor was actually growing in thickness in the direction normal to the window-chamber plane. Figure 4 shows a case where a tumor was shrinking over time. From Figs. 1 through 4, one can see that the average pH in the normal tissue is significantly lower than expected (expected ) with a range of to units below that value. Figure 5 shows the variation in the pH images of a window chamber in a single experiment at different imaging time points after the injection of the carboxy SNARF-1 solution. The pH map appears more acidic at the early time point, appears to become slightly more basic over time, and finally turns more acidic at the final time point. This behavior of temporal variation was observed in multiple experiments. A variation of units in the average pH in the normal tissue is observed at different time points in Fig. 5. 4.Error AnalysisAlthough the pH is generally lower in tumor than in surrounding tissue, the estimated pH values appear biased toward low values. In all the pH images, the pH values in tumor and in normal tissue are lower than typical physiological pH (around 7.2 for normal tissue). In addition, the pH value in normal tissue varied somewhat from image to image over time and from day to day over the course of an experiment. These errors can potentially be due to a number of factors, including Poisson noise in the measured signals, estimator bias, instrument drift, temperature variation, calibration error, and biological factors. 4.1.Biased Estimator and Poisson NoiseThe signals in the two measurement channels can be modeled as uncorrelated Poisson random variables and . The mean of the ratio , , of the two random variables can be calculated using a Taylor expansion as where and are the mean of and , respectively, and is the standard deviation of . The mean of the ratio is generally not equal to the ratio of the means of the two signals. As a result, Eq. 1 is a biased estimator for , which is the value needed for pH estimation. Consequently, the estimated pH computed using this ratio is biased.In Eq. 3, the first-order bias term, , is the reciprocal of the square of the SNR of the signal from channel 2. Photon flux is low for window-chamber pH imaging and photon noise is therefore a predominant source of the signal uncertainty. A Monte Carlo simulation was performed to investigate the effects of the biased ratio estimator and photon noise on the estimated pH. Figure 6 shows plots of the bias and standard deviation of the estimated pH for different numbers of collected photons. Both the bias and the standard deviation decrease as the number of photons increases. The minimum bias and minimum standard deviation occur at near-neutral pH () regardless of the number of photons. It can be seen that the bias of the estimated pH is relatively small compared to the standard deviation. This bias can generally be considered insignificant and can be ignored. To achieve a measurement precision better than 0.1 pH units, a total photon number of at least 500 is required. In experiments, the image sensor absorbs photons and emits photoelectrons, with a quantum efficiency of less than unity. Fig. 6Bias (a) and standard deviation (b) of the estimated pH due to photon noise and estimator for varying number of collected photons. Bias of the estimated pH is very small and can be ignored even when the number of photons is as low as 500. To achieve a standard deviation lower than 0.1 pH units for the estimated pH, at least 500 photons need to be collected.  In the experimental results shown in Figs. 1 through 5, approximately 600 photoelectrons were collected per pixel. A standard deviation of 0.09 pH units is expected at in this case. In a relatively uniform area inside a window chamber, we measured a standard deviation of 0.11 pH units at , which is close to the results predicted by the Monte Carlo simulation. 4.2.Instrument ErrorsSystem stability (i.e., drift) in the two spectral detection channels of the microscope can be another factor that introduces uncertainty in the estimated pH. The pH of a phantom was measured to investigate the stability of the confocal microscope system used for pH measurements. The phantom consisted of a microscope slide with a well, which was filled with the 5-μM PBS-buffered carboxy SNARF-1 solution. The experiment was run over two days and the pH of the phantom was measured every 30 min using the ratiometric technique and previously obtained calibration result. The imaging system was turned off in the evening of the first day and turned back on the following morning. The measured pH versus the imaging time points is plotted in Fig. 7. The variation was slightly higher on the second day, possibly due to power or temperature instability, but the fluctuation in the pH-measurement result is still within a fairly narrow range (approximately units). Therefore, the stability of this imaging system is adequate for our experiments, and the errors due to this factor can be ignored on this instrument. Fig. 7Stability of the confocal microscope system. The fluctuation of the pH-measurement results is fairly small. 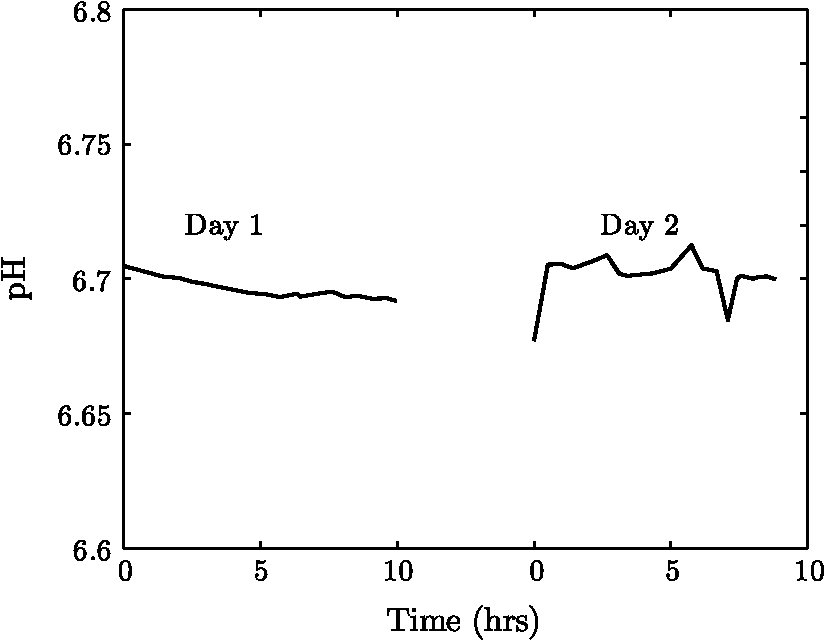 We have recently shown that chromatic aberration in a confocal microscope can introduce a significant amount of variation to the ratio of two spectral signals, especially when the microscope is focused near the sample boundary.14 Due to the depth of field of the objective, it is difficult to focus perfectly on the same plane of the sample for each experiment. The subtle shift of the focal plane results in a variation of the ratio, thus yielding a variation in pH values for the same sample. However, because we imaged with a 1X objective and an open pinhole, the variation in the signal ratio due to this effect is extremely small and is not a major source of the observed variability in the pH measurements. 4.3.TemperatureVariation in temperature can also cause the emission spectra of carboxy SNARF-1 to shift. This introduces a variation in the signal ratio and consequently the estimated pH. The variation of estimated pH versus temperature was measured in a 5-μM PBS-buffered carboxy SNARF-1 solution. The results are plotted in Fig. 8. One can see that the fluctuation of measured pH is approximately linear with a change of units per degree celsius. These results clearly show that temperature is an important factor in pH measurement. For the imaging results shown in Figs. 1 through 5, the window-chamber temperature was not carefully maintained and this may be a source of some of the observed variability. Although temperature variation will introduce errors in the pH estimation, the effect is only on the order of 0.1 pH units over the temperature range that would be expected to be encountered experimentally. Moreover, the pH-versus-ratio calibration curve was generated using a carboxy SNARF-1 solution at room temperature, which is a lower temperature than that of the tissue in the window chamber. This temperature difference between calibration and experiment introduces an overestimation, not an underestimation, of the tissue pH, and therefore does not explain the observed behavior. This bias can be avoided by maintaining the animal and surrounding environment at a fixed temperature (e.g., 37°C) and performing the calibration procedure at the same temperature. 4.4.Calibration Error Due to ScatteringIdeally, the ratiometric method should not be sensitive to tissue scattering, especially when the surface of a sample is imaged. However, due to chromatic aberration in the microscope system, the focal planes of two wavelengths are at slightly different depths inside the sample. In this case, light scattering in two emission channels is different, and the ratio of the two signals becomes depth dependent. The wavelength that focuses deeper in the sample suffers more signal loss from scattering and alters the ratio of the signals of the two wavelengths. In our window-chamber experiments, calibration was done using non scattering solutions. Therefore, in real tissues, which are highly scattering, there is a bias introduced in the estimated pH. Since the focal shift between two wavelengths depends on the magnification and numerical aperture of the objectives, the variation of the ratio is also objective dependent. To test the magnitude of this effect we used the ratiometric method to measure SNARF solutions with varying intralipid concentrations. Several different objective lenses, including Nikon 1X/0.04NA Plan UW, 2X/0.06NA Plan UW, 4X/0.13NA Plan Fluor, 10X/0.25 NA Plan and 20X/0.5NA Plan Fluor, were tested. The nominal pH of the carboxy SNARF-1 test solution was 8.0. The results are shown in Fig. 9 where it is seen that the magnitude of the bias in the estimated pH increases with the concentration of intralipid for the same objective. The pH is underestimated to a greater degree for lower magnification objectives since the focal shift is usually greater for these objectives.14 The experiment revealed that a 5% intralipid solution can cause the measured pH to be underestimated by as much as 0.6 pH units with a 1X/0.04NA objective on our instrument. This is clearly a large effect that can explain the observed error in the underestimation of pH in the window-chamber model. 4.5.Biological FactorsBeside the scattering differences between the calibration standards and real tissues, there are other biological factors that might affect the results. Sanders15 has shown that the concentration of protein and other macromolecules inside tissue can affect the emission spectra of pH-sensitive fluorophores. Because the signal intensities of the two channels are generated from the two fixed spectral bands of the corresponding emission filters, the resulting ratio becomes dependent on the protein concentration. Since it is difficult to replicate the same molecular environment in the calibration media as in real tissue, an erroneous calibration curve can introduce bias in the estimated tissue pH. A fluorophore molecule bound to extracellular protein yields a pH measurement that appears more acidic compared to an unbound molecule. As a result, the combination of bound and unbound probe molecules yields an estimated pH that is lower than the actual pH if the calibration curve is generated with a completely unbound probe. In Sanders’ experiments, the pH inside cells was underestimated by as much as 1 pH unit near neutral pH. We measured the pH of SNARF solutions with and without 0.7-mM bovine serum albumin (BSA). The 0.7 mM BSA solution is similar to the protein concentration one would encounter in tissue. It was found that the pH value is underestimated by about 0.2 pH units in the solution with added BSA. The result is consistent with Sanders’ experiment in the sense that the presence of BSA shifts the pH values toward lower values; however, the amount of bias is smaller in our experiment compared to what was reported in Ref. 15. Still, this is a significant factor in obtaining accurate pH measurements that may be ameliorated by using calibration media that more closely mimic the complex biochemistry in tissues. The variation of pH measurements in a single experiment (e.g., result presented in Fig. 5) can potentially be explained by the variation in the ratio of bound and unbound pH-probe molecules in tissue. It is possible that the ratio of bound to unbound probe changes with time. At the early time point (e.g., 5 min after injection), the concentration of probe molecules that gets from the blood to the tissue is low and a relatively high proportion of the molecules that are in the tissue are bound with extracellular protein. Therefore, the tissue appears more acidic than it should. As more probe enters the tissue, the proportion of unbound probe molecules increases and the measured pH increases (15 and 30 min time points in Fig. 5). The concentration of probe molecules inside the tissue will eventually drop, with unbound probe molecules leaving first, and the pH map will then start to appear more acidic again. The 40-min time point in Fig. 5 shows a slight decrease in average pH. Since the permeability of vessels and the metabolism rate of individual mice varies, there can be temporal variations in the ratio of bound to unbound probe that alter the measured pH. This effect can be minimized to some extent by generating a calibration curve with solutions that mimic both the protein and probe concentrations encountered in tissue. 5.ConclusionsImaging tissue pH in a window chamber using a ratiometric approach with carboxy SNARF-1 on a confocal microscope is possible, but a number of factors affect the accuracy of the method. Photon noise causes pixel-to-pixel fluctuations, which affect the variance and limit the precision of the estimated pH image. This fluctuation can be reduced by increasing the number of photons collected. In our experiments, the standard deviation of the estimated pH is around 0.1 pH units and matches the quantitative expectation based on the number of collected photons. Other factors can lead to systematic errors (bias) in the estimated pH image. The ratio estimator itself will introduce a bias to the results, but the effect is small and insignificant relative to other factors. The spectral emission of carboxy SNARF-1 is temperature dependent as well as pH dependent. Differences between the temperature of the calibration media and the sample to be measured will lead to a systematic bias that can be significant—on the order of 0.02 pH units per °C. This source of error can be made insignificant by controlling the temperature of the sample (window chamber) and matching the temperature at which the calibration data are collected. Scattering combined with chromatic aberration can introduce an even more significant bias in the ratio of the signals from two emission channels and therefore to a significantly biased estimate of pH when calibration data are collected in a medium whose scattering properties do not match those of the tissue. This systematic error can be reduced by using an imaging system with low chromatic aberration and/or by collecting calibration data from a medium whose scattering properties mimic tissue. Finally, biological factors such as the binding of pH probe molecules to extracellular protein can also lead to bias in the estimated pH. This may be the most difficult issue to address. The uncertainty of the ratio of bound and unbound probe molecules could account for the observed variation of pH measurements from experiment to experiment. Nevertheless, the effect can be minimized by trying to match the solution’s concentration of probe and protein during calibration to that of the tissue. With careful attention to these factors, bias error can be minimized in ratiometric fluorescence-based pH imaging. AcknowledgmentsThis work was supported by a grant from the Arizona Biomedical Research Commission (Grant # 1005). ReferencesR. A. GatenbyE. T. Gawlinski,
“A reaction-diffusion model of cancer invasion,”
Cancer Res., 56
(24), 5745
–5753
(1996). CNREA8 0008-5472 Google Scholar
A. A. Patelet al.,
“A cellular automaton model of early tumor growth and invasion,”
J. Theor. Biol., 213
(3), 315
–331
(2001). http://dx.doi.org/10.1006/jtbi.2001.2385 JTBIAP 0022-5193 Google Scholar
R. A. Gatenbyet al.,
“Acid-mediated tumor invasion: a multidisciplinary study,”
Cancer Res., 66
(10), 5216
–5223
(2006). http://dx.doi.org/10.1158/0008-5472.CAN-05-4193 CNREA8 0008-5472 Google Scholar
G. GrynkiewiczM. PoenieR. Y. Tsien,
“A new generation of indicators with greatly improved fluorescence properties,”
J. Biol. Chem., 260
(6), 3440
–3450
(1985). JBCHA3 0021-9258 Google Scholar
P. LippE. Niggli,
“Ratiometric confocal -measurements with visible wavelength indicators in isolated cardiac myocytes,”
Cell Calcium, 14
(5), 359
–372
(1993). http://dx.doi.org/10.1016/0143-4160(93)90040-D CECADV 0143-4160 Google Scholar
E. D. WiederH. HangM. H. Fox,
“Measurement of intracellular pH using flow cytometry with carboxy-SNARF-1,”
Cytometry A, 14
(8), 916
–921
(1993). Google Scholar
C. C. Overlyet al.,
“Quantitative measurement of intraorganelle pH in the endosomal–lysosomal pathway in neurons by using ratiometric imaging with pyranine,”
Proc. Natl. Acad. Sci. USA, 92
(8), 3156
–3160
(1995). http://dx.doi.org/10.1073/pnas.92.8.3156 1091-6490 Google Scholar
V. MontanaD. L. FarkasL. M. Loew,
“Dual-wavelength ratiometric fluorescence measurements of membrane potential,”
Biochemistry, 28
(1), 4536
–4539
(1989). Google Scholar
E. GrossR. S. BedlackL. M. Loew,
“Dual-wavelength ratiometric fluorescence measurement of the membrane dipole potential,”
Biophys. J., 67
(1), 208
–216
(1994). http://dx.doi.org/10.1016/S0006-3495(94)80471-0 BIOJAU 0006-3495 Google Scholar
G. H. AlgireF. Y. Legallais,
“Recent developments in the transparent chamber technique as adapted to the mouse,”
J. Natl. Cancer Inst., 10
(2), 225
–253
(1949). JNCIEQ Google Scholar
R. MerwinG. H. AlgireH. S. Kaplan,
“Transparent-chamber observations of the response of a transplantable mouse mammary tumor to local Roentgen irradiation,”
J. Natl. Cancer Inst., 11
(3), 593
–627
(1950). JNCIEQ Google Scholar
H. D. Papenfusset al.,
“A transparent access chamber for the rat dorsal skin fold,”
Microvasc. Res., 18
(3), 311
–318
(1979). http://dx.doi.org/10.1016/0026-2862(79)90039-6 MIVRA6 0026-2862 Google Scholar
J. E. WhitakerR. P. HauglandF. G. Prendergast,
“Spectral and photophysical studies of benzo[c]xanthene dyes: dual emission pH sensors,”
Anal. Biochem., 194
(2), 330
–344
(1991). http://dx.doi.org/10.1016/0003-2697(91)90237-N ANBCA2 0003-2697 Google Scholar
Y. LinA. F. Gmitro,
“Errors in confocal fluorescence ratiometric imaging microscopy due to chromatic aberration,”
Appl. Opt., 50
(1), 95
–102
(2011). http://dx.doi.org/10.1364/AO.50.000095 APOPAI 0003-6935 Google Scholar
R. Sanderset al.,
“Quantitative pH imaging in cells using confocal fluorescence lifetime imaging microscopy,”
Anal. Biochem., 227
(2), 302
–308
(1995). http://dx.doi.org/10.1006/abio.1995.1285 ANBCA2 0003-2697 Google Scholar
|