|
|
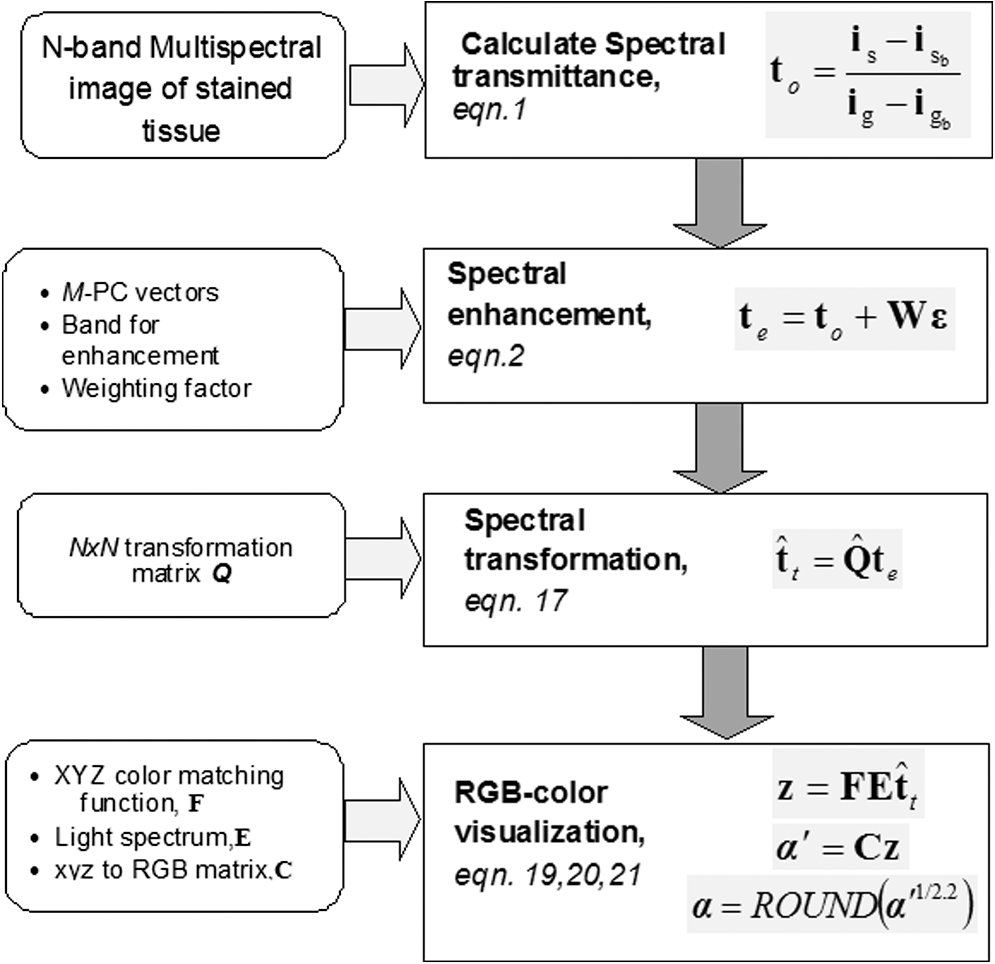
1.IntroductionThe potential utility of multispectral imaging for various medical imaging applications has been investigated.1–7 In pathology, particular interest is focused on the possible application of this imaging modality to improve tissue detection, classification and visualization.8–15 In contrast to the conventional RGB-color image acquisitions systems, which use wideband filters, multispectral imaging uses narrowband filters to capture images across wide spectral range. The utilization of narrowband filters enables a multispectral image acquisition device to capture spectral features that are not normally captured with RGB-color image acquisition devices. Chemical staining of tissue sections is an important part in clinical pathology diagnosis. Staining produces clearer visualization of the different tissue structures. From a stained tissue section, the tissue’s architecture and the morphological characteristics of its cells structures could easily be observed. The digital simulation of the effect of chemical staining, also known as digital staining, on histopathology images using multispectral features was explored.10,11,13 Digital staining aims at transforming the original image, which could be unstained or stained, into an image with the desired staining patterns by employing digital processing techniques. It produces images which do not only possess improved colorimetric differences between faintly discriminated tissue structures, but also the visualization inherent to the effect of chemical staining to the tissue. Hematoxylin and eosin (H&E) stain is currently the most popular for routine staining. To corroborate the pathologist’s initial findings on the H&E stained tissue sections, special stains and/or immunohistochemical stainings (IHC) are requested. Digital staining can be utilized to visualize the staining reactions of the H&E stained tissue structures to other types of dye without necessarily resorting to chemical staining. From the digitally stained images additional diagnostic information can be collected. The successful implementation of digital staining could therefore enhance the efficiency of the clinical diagnosis workflow while reducing the cost of chemical staining. Digital staining methods for histopathology multispectral images have been introduced.10,11 The methods involve two basic processes: 1. spectral classification; and 2. spectral transformation. The digital staining method in Ref. 11 showed promise in transforming H&E stained images to their Masson’s trichrome stained images equivalent. However, it was not as effective in differentiating tissue structures which have very subtle colorimetric difference. This was thought to be caused either by the limitation of the spectral classification itself or by the process by which the digital colorization was implemented. Mitsui et al.,4 proposed a spectral enhancement scheme to improve the visualization of obscured skin patterns. A similar approach was applied to histology images to enhance tissue structures which acquire similar H&E staining patterns;14 initial experimental results showed the capability of the enhancement method to capture salient spectral differences. To circumvent the limitations of the previous digital staining method, the application of spectral enhancement combined with spectral transformation was introduced.15 Application of the proposed method to H&E stained tissue images resulted in the vivid discrimination between tissue structures that share similar colorimetric attributes, particularly the discrimination between smooth muscle and collagen fiber. While spectral enhancement increased the spectral color difference between the object of interest and background, application of spectral transformation converted the H&E stained spectral color of the tissue structures to the colors specific to their reaction to the specified stain, i.e., Masson’s trichrome. In this paper, we extended the discussion of the digital staining method presented in Ref. 15. This paper is organized as follows. The details of the digital staining methodology are presented in Sec. 2 followed by the experimental results in Sec. 3 and discussions in Sec. 4. Summary and conclusion of the current work is presented in Sec. 5. 2.Materials and Methods2.1.Multispectral Imaging SystemThe multispectral microscopic imaging system developed by Olympus Inc., Japan is utilized to capture the multispectral images of the stained tissue sections. The system consists of an Olympus BX51 light microscope that is connected to a personal computer. A liquid crystal tunable filter, which has spectral sensitivity within the visible spectral range, is attached to the light microscope. The imaging system comes with image acquisition and viewing software. The user utilizes the image acquisition software to acquire the multispectral image of the tissue as seen under the microscope. Each multispectral image is composed of 63 monochromatic images representing the light absorption characteristics of the tissue from 410 to 720 nm at an interval of 5 nm. The 63 monochromatic images are encoded in Tiff format at . To view the RGB-color format of the multispectral images, the user may use the viewing software, which also allows him/her to view and save the spectra, e.g., spectral transmittance or absorption, of the selected points of interest. 2.2.Spectral TransmittanceThe spectral transmittance, , of an -band multispectral pixel can be calculated as follows: where and are column vectors whose elements are the signal values of the tissue and that of glass at location (, ), respectively, and and are the corresponding dark current signals. In the expression above we dropped the spatial notation (, ) for simplicity. The components of the transmittance are associated to the light absorption behavior of the tissue at point (, ) at different wavelengths.2.3.Spectral EnhancementThe spectral enhancement utilized in this work is based on the enhancement method proposed in Ref. 4. In the enhancement process, the original spectrum of the pixel at band , , , is shifted by a real-valued factor, which is the spectral residual-error of the multispectral pixel weighted by a constant. The spectral enhancement can be expressed as follows: The variables , , and are all column vectors which denote the pixel’s enhanced spectral transmittance, original transmittance, and its spectral residual-error, respectively. The entries of the matrix serve as weighting factors to the spectral residual-error at different bands. The parameters and will be discussed in the next sections. 2.3.1.Principal component analysis and spectral errorPrincipal component analysis (PCA) is a popular choice for multispectral/hyperspectral image compression and for spectral feature extraction.16–19 In the analysis, the original spectrum is estimated by considering only the first dominant principal component (PC) vectors, which were calculated from a chosen spectral dataset. The objects in an image can generally be categorized into: 1. background (or objects of non-interest); and 2. object of interest. Let be a matrix containing the original spectral transmittance samples of the background and object of interest, where is the total number of spectral samples and is the spectral dimension. The element of the matrix above represents the transmittance value of the ’th samples at the ’th spectral band where and . In multispectral image compression applications, the principal component (PC) vectors are normally derived from the covariance of the samples in . The PC vectors are determined based on how much of the variance in the spectral samples in are captured. The accumulated variance captured by the PC vectors can be estimated using their respective eigenvalues: where denotes the accumulated variance, is the eigenvalue of of the ’th PC vector, . The original spectrum of a multispectral pixel can be reconstructed with minimum error when the first PC vectors captured most of the original spectral data variance: where is the coefficient of the ’th PC vector, ; denotes the estimate of the original transmittance ; is the average of the spectral samples in ; and is the -dimensional spectral residual-error, which is defined as follows:Let be a , where represents the total number of spectral samples of the background objects. For the current spectral enhancement method, the PC vectors are instead derived from the spectral samples in matrix rather than from . That is, the spectral samples of the object of interest are not considered from the spectral set from which the PC vectors are drawn. 2.3.2.Weighting matrixIn Ref. 15, the weighting matrix in Eq. (2) was designed as follows: where is a real value. Equation (8) implies that all the spectral bands are equivalently weighted. That is, there are no specified bands for enhancement. In Ref. 8, the band for enhancement was identified from the spectral residual-error plot of the object of interest. The band at which the spectral residual-errors of the object of non-interest or background objects are close to zero and that of the object of interest was large was chosen as the band for enhancement. This condition was found to be necessary to isolate the effect of the enhancement to the objects of interest and minimize the spectral color shifts among the background objects. Hence, when spectral samples of the image objects are available, a more robust approach would be to specify the bands for enhancement at which the spectral residual-errors of the object of interest are identified to be much larger than the errors of the background objects. This does not only ensure that only the spectra of the objects of interest will be modified at the specified bands by the spectral enhancement process, but this also minimizes the effect of spectral variations in the original spectral data to the digital staining results in general. If we let a vector containing the different bands at which the spectral residual-error of the object of interest is large while those of the background objects are small, we can rewrite Eq. (8) in the following form:We referred to the elements of the vector b in Eq. (9) as the bands for enhancement. 2.4.Spectral TransformationIn the transformation of spectral transmittance we assumed that the target transmittance value of the ’th spectral sample at the ’th spectral band, , is equal to the weighted summation of its reference transmittance, which is the original or enhanced transmittance of the object, in the whole spectral band. where ,; is the transmittance value of ’th reference spectral sample at ’th band; and is the element of the transformation at the ’th row and ’th column. With the appropriate values of the elements of the matrix the reference spectrum can be converted to its target spectral configuration smoothly using Eq. (10).The solution for the transformation matrix can be determined using the least mean squares method.10 Let be a matrix that contains the target spectral transmittance samples of the reference spectral transmittance samples in . The matrix form of Eq. (10) can be written as: and the linear solution for can be given by: where is the pseudoinverse of . Using the result of Eq. (12), the reference spectrum (or original spectrum) can be converted to its target spectral configuration by the following: where and are column vectors representing the reference and its transformed spectrum, respectively; and is the transposed of in Eq. (12).2.5.Digital Staining SchemeCombining Eqs. (2), (5) and (7), we can rewrite Eq. (2) in the following form: where is an identity matrix, and an matrix whose ’th column corresponds to the ’th PC vector:The enhanced versions of the original transmittance samples resulting from the application of Eq. (14) are used instead of the original spectral samples in finding for the solution of the transformation matrix . With this, Eq. (11) becomes: where is the matrix that contains the enhanced spectral samples. The linear solution for as expressed in Eq. (12), still holds. Replacing in Eq. (13) with , we will have:Then, the digitally stained spectrum of a pixel, , can be determined by combining Eqs. (14) and (17). Equation (18) illustrates that the current digital staining approach can be implemented by matrix manipulation. Since spectral classification is no longer necessary this makes the implementation of the present approach more straightforward compared to the previously proposed methods in Refs. 10 and 11. Using the equation above, the original stained transmittance of a tissue structure, , can be converted to its target spectral transmittance configuration, , by scaling and shifting. The original transmittance, , is scaled by the product between the transformation matrix and the principal component vectors, weighted by the elements of the matrix . The spectral color of the scaled transmittance is shifted by the average spectrum of the background objects, denoted by , which is scaled by the weighted product between the matrices , , and . The matrices and are determined offline and require the first and second stained spectral samples of the different tissue components, e.g., H&E and Masson’s trichrome. The entries for are set to zero by default. The decision as to which elements should be set to non-zero values depends on the identified bands for enhancement. 2.6.RGB-Color VisualizationTo view the transformed spectrum of Eq. (18) on ordinary display, it is converted to its RGB-color. An -band spectral transmittance can be converted to its RGB-color using the CIE color matching functions. Let be the matrix of the color matching function, as the diagonal matrix of the illumination spectrum. The tristimulus values of the digitally stained spectrum, , are calculated as follows: where is the vector containing the values, . The RGB color values can be determined using the to RGB conversion matrix, .20 where is the RGB vector whose values are clipped into [0,255]. This procedure results in RGB data that meets the sRGB standard.20The digital staining method introduced in this work is summarized by the block diagram in Fig. 1. The spectral transmittance of a stained multispectral pixel is first calculated using Eq. (1). Then, spectral enhancement is applied by utilizing Eq. (2) using the -PC vectors, which were determined using the spectral samples of the background objects, i.e., objects of non-interest, together with other pre-defined enhancement parameters. The enhanced spectrum is then transformed using the transformation matrix , Eq. (17), which was determined using the reference and target spectral datasets, e.g., H&E and Masson’s trichrome stained spectra. RGB visualization of the transformed spectrum then follows, Eqs. (19)–(21). The process is repeated for all the image pixels. 3.Experiments and Results3.1.Multispectral Image AcquisitionIn this work we used two sets of slides. Each set is composed of a pair of H&E and Masson’s trichrome stained slides that belong to the serial sections of a liver tissue. From these sets we captured 10 sets of multispectral images at . Since we captured similar areas from both slides, the images in a set share similar structural composition. Of the 10 multispectral-image sets, we selected 5 sets from which we identified six different tissue components namely the nucleus, cytoplasm, red blood cells (RBC), collagen fiber, smooth muscle, and duct; the labeling of the these tissue components were referred to a pathologist for correctness. We then collected the H&E and Masson’s trichrome spectral samples for these tissue components, and also for the white areas; the white areas are areas in the images which are devoid of any tissue structures. 3.2.PC Vectors and Spectral Residual-ErrorsThe matrix contains the H&E spectral samples of all the identified tissue components while the matrix from which we derived the PC vectors for spectral enhancement contains the H&E the spectral samples of the non-collagen fiber tissue components only (or the background objects), which includes the nuclei, cytoplasm, red blood cells, (RBC), smooth muscle, duct, and the spectral samples of the white areas. The effective number of PC vectors, , was determined using Eq. (4). The log plot of one minus the accumulated variance with respect to the number of PC vectors is shown in Fig. 2. The vertical axis corresponds to one minus the log of the accumulated variance for a given number of PC vectors indicated on the horizontal axis. From this plot, we can see that the variance starts to taper at PC vectors. We can also observe that there is not much difference in the variance between and PC vectors. This implies that most of the variance in the original spectral data in are captured by the first five PCs, and the spectra of the non-collagen fiber tissue structures can be estimated with reduced error. The plots in Fig. 3 are the average spectral residual-errors of the different tissue-components in . We can see that the spectral residual-error of the collagen fiber in Fig. 3(b) is markedly different from the rest. This demonstrates that the spectral residual-error may represent the spectral samples of the collagen fiber that were not considered in the composition of , which we used to calculate the PC vector, and allows for the enhancement of these residual-error spectra at chosen wavelengths. Fig. 2The plot illustrates the accumulated variance with respect to the number of PC vectors. The horizontal axis corresponds to the number of PC vectors while the vertical axis to the log of the accumulated variance that a total number of PC vectors captures. The PC vectors were determined from the 1850 H&E spectral samples of the objects of non-interest (or background objects), which include the nucleus, cytoplasm, red blood cells (RBCs), smooth muscle and duct; spectral samples of the white areas, the areas which do not contain any tissue structures, were also considered. 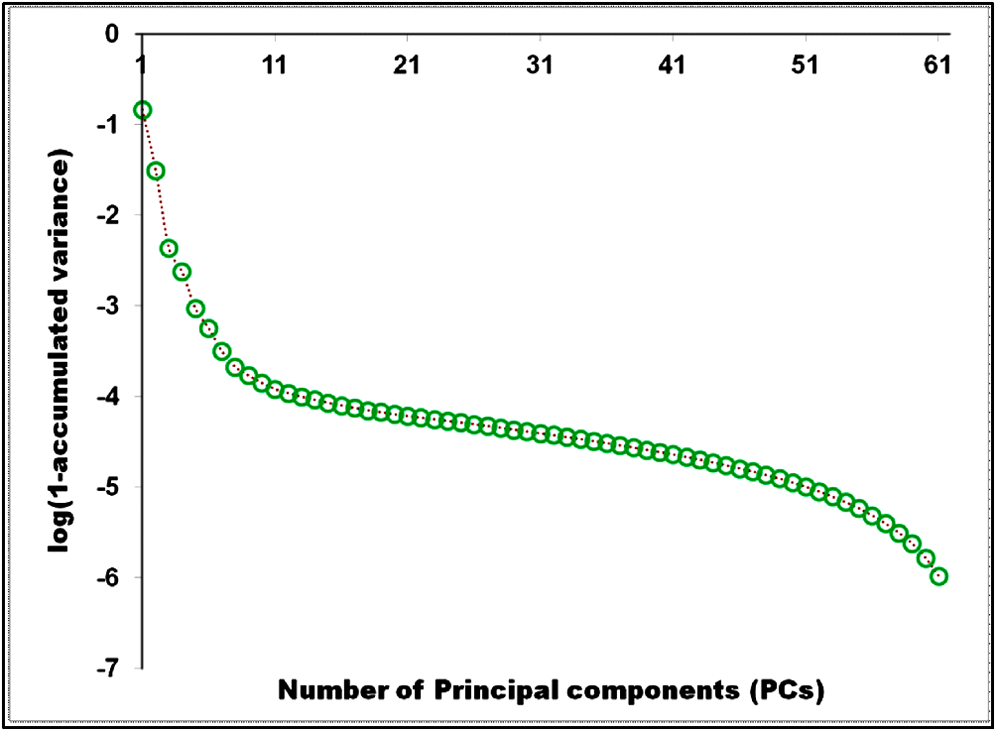 Fig. 3The plot shows average the spectral residual-errors of the different tissue components using 5 PC vectors. Each tissue component was represented with the following number of spectral samples: , , , , , , and the . (a) Spectral residual-errors of the non-collagen fiber tissue structures. (b) Spectral residual-error of the collagen fiber. We can see that the spectral residual-error of the collagen fiber exhibit prominent peaks at specific wavelengths while the errors of the rest of the tissue components taper to zero.  3.3.Digital Staining ProcessesTo demonstrate the effect of the spectral enhancement and the spectral transformation processes in the proposed digital staining method, we considered the H&E spectral samples of the different tissue components in . The average H&E transmittance spectra of these tissue components are shown in Fig. 4(a). The spectral samples from which these average spectra were calculated are translated into their RGB-color and they are illustrated by the color patches at the top of the spectral plots. The color of each patch characterizes the H&E staining reaction of a tissue structure. Eosin stained structures are stained pink to red, while the hematoxylin stained ones, such as the nuclei, are stained blue to purple. Figure 4(a) shows that from an H&E stained section we can easily discriminate between eosin and hematoxylin stained structures. Fig. 4An illustration of the major processes involved in the proposed digital staining method and their effect to the spectral transmittance and RGB color of the pixels. The H&E spectral samples used in this illustration belong to the same batch of samples used to compute the transformation matrix . The panels on top of the average spectral plots show the RGB color patches of the spectral samples from which the average spectra were calculated. (a) Original H&E stained; (b) effect of spectral enhancement; (c) result of digital staining; and (d) original Masson’s trichrome stained. In comparison to (a) and (b), we can observe that more vivid discrimination between collagen fiber and the rest of the tissue components can be obtained from application of digital staining, (c). 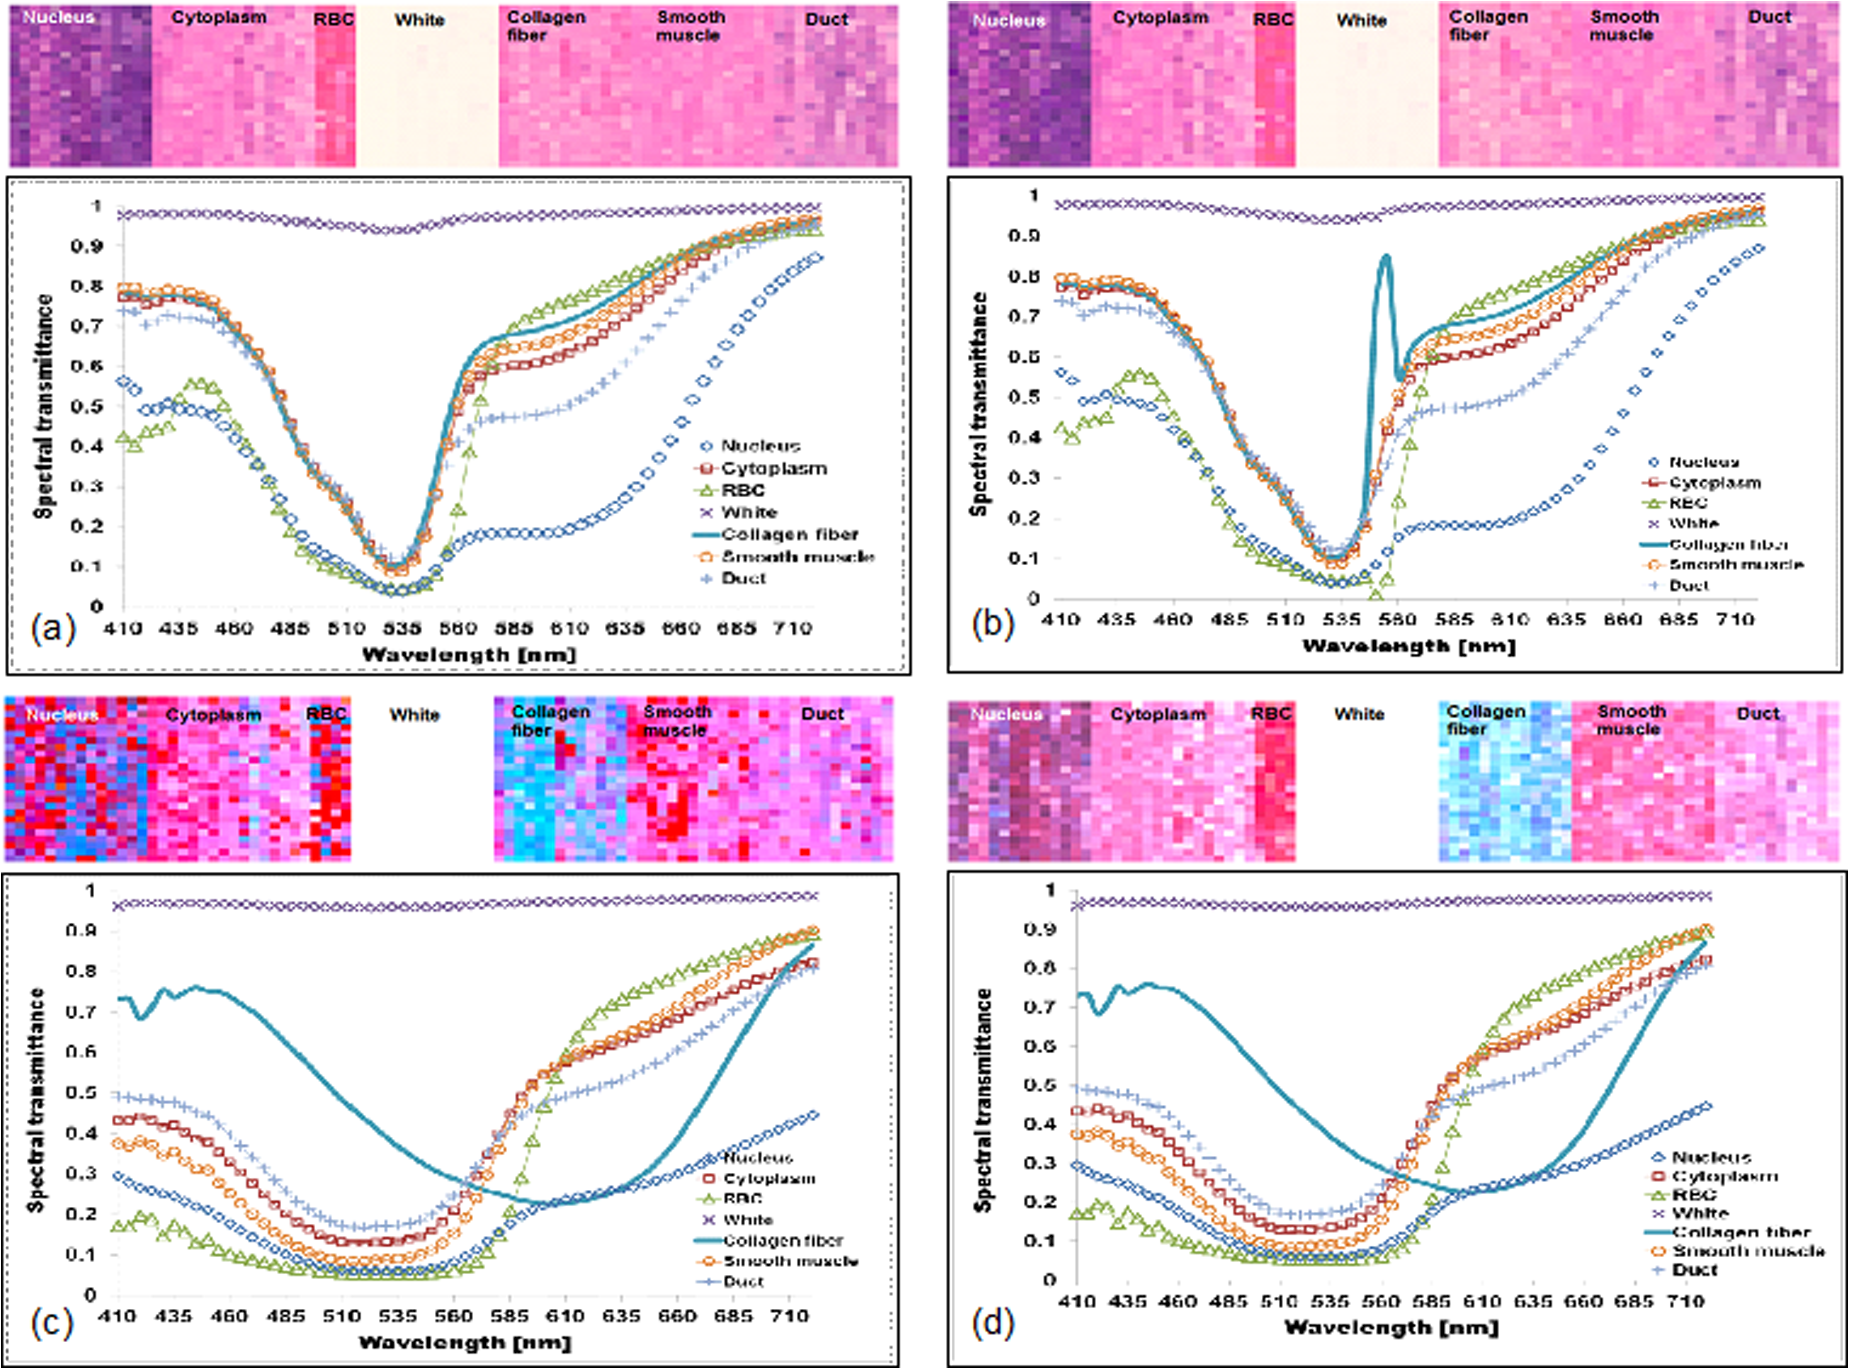 3.3.1.Spectral enhancementWe can observe in Fig. 4(a) that differentiation between collagen fiber and smooth muscle, which are both stained with eosin dye, is not as straightforward as the differentiation between eosin stained and hematoxylin stained tissue components, such as the differentiation between nuclei and collagen fiber. In order to improve the H&E spectral color difference between the collagen fiber and smooth muscle, we utilized the spectral enhancement of Eq. (2). As mentioned previously, the collagen fiber is the current object of interest and thus the subject for enhancement. Hence, we need to identify the bands for enhancement in Eq. (9) which would emphasize this structure in the enhanced image. Referring to the spectral residual-error configuration of the collagen fiber, as shown in Fig. 3, we considered the bands at which the non-collagen fiber spectral errors are small while that of the collagen fiber are distinctly large. We then selected . Trial and error experiments were done to determine the values of the weighting factors for these bands to produce the RGB images which exhibit the staining patterns of a Masson’s trichrome stained image. Based on the initial results of the experiments, we set the weighting factors for these bands to . The effect of the spectral enhancement using these bands is illustrated by the spectral plots at the top panel in Fig. 4(b). Each plot represents the average spectrum of a particular tissue component. It is evident that when the bands for enhancement are chosen appropriately, only the spectra of the objects interest, i.e., collagen fiber, are modified by the enhancement. The RGB-colors of the enhanced spectral samples are indicated by the color patches above the plot. We can observe that while the patches for the smooth muscle remains pinkish the hue of the collagen fiber shifted from pinkish to light pinkish, which in effect increases the overall color difference between these structures. 3.3.2.Spectral transformationThe purpose of spectral transformation is to convert the original or enhanced transmittance of a tissue component to the spectral configuration associated to its reaction to a particular stain. In our work, the spectral transformation was achieved by designing an transformation matrix using the enhanced H&E and Masson’s trichrome stained spectral samples of the different tissue components by least mean squares method, Eq. (16). The spectral samples represent seven different classes of tissue components. To minimize the effect of intra-class spectral variations, the spectral average of each class, e.g., nuclei, cytoplasm, etc., was instead considered to find the solution for .10 Taking this into consideration, Eq. (16) reduces to the following form: where and are the average transmittance of the th class at band of the Masson’s trichrome and the H&E enhanced spectral transmittance samples. The matrix was then derived using the Pseudoinverse function as implemented by Matlab.21Figure 4(c) demonstrates the effect of the spectral transformation. While it is not very direct to distinguish the collagen fiber from the smooth muscle on the basis of their H&E stained spectra, we can observe a notable difference between their transformed spectra. In contrast to the spectral enhancement wherein only the spectral samples of the collagen fiber were modified at the selected bands for enhancement, in spectral transformation all the spectral samples, regardless of their classes, underwent changes in their spectral configurations. The RGB color visualization of the transformed spectral samples is shown at the panel above the spectral plots. Here, we can readily observe the color difference between collagen fiber and smooth muscle. The average plots of the physically-stained spectral samples and their corresponding RGB color patches are also provided in Fig. 4(d). If we refer the RGB color patches in Fig. 4(c) to 4(d) we can see that some of the spectral samples were mislabeled as a result of the spectral transformation—the RGB colors acquired by these samples were different from what they were supposed to exhibit. However despite the occurrence of spectral mislabeling we can still observe the delineation between smooth muscle and collagen fiber better compared to the original spectral data, Fig. 4(a), or to the result of the spectral enhancement, Fig. 4(b). 3.4.Digitally-Stained Histopathology ImagesThe original H&E stained images along with the results of the digital staining and the physically stained Masson’s trichrome images are shown in Fig. 5. The original H&E stained images, results of digital staining, and the physically stained Masson’s trichrome stained images are shown at the left, middle and right panels, respectively. The H&E stained image at the topmost row represents one of the five training images we used in the experiments, and the images at the succeeding rows represent the test images. The results of the digital staining at the middle panels show similarity to the actual Masson’s trichrome stained images on their right, particularly with respect to the differentiation between the eosin stained tissue areas, e.g., collagen fiber and cytoplasm areas. Fig. 5Results of digital staining to the H&E multispectral images in comparison to the actual Masson’s trichrome stained images. The collagen fibers are associated to the blue color in both the digitally stained and physically stained images. Clearer distinction between collagen fiber and the rest of the eosin stained tissue structures can be observed from the digitally stained images. (a) Original H&E stained images; (b) result of digital staining; and (c) actual Masson’s trichrome stained images. 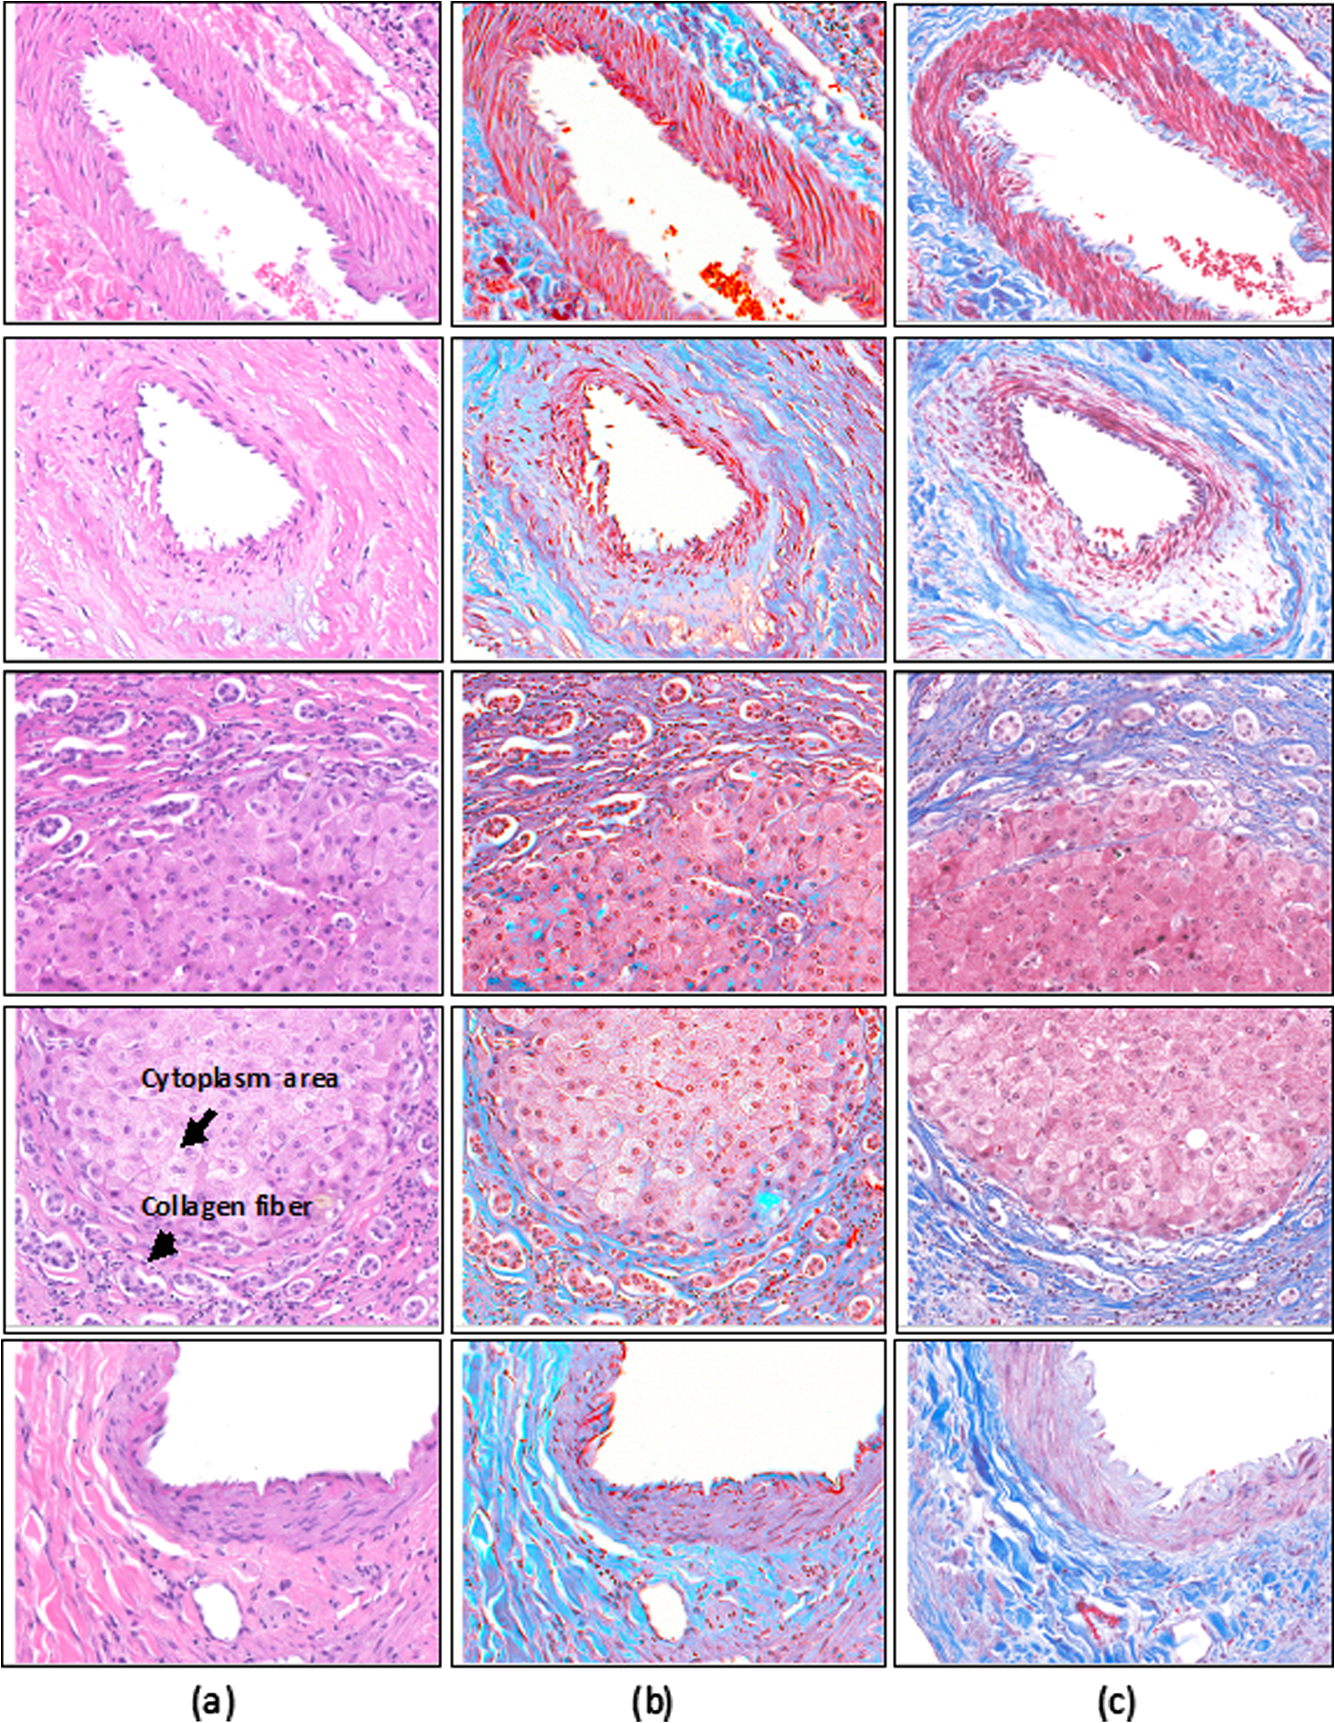 Masson’s trichrome stain is used to obtain clear visualization of fibrous tissue in the diagnosis of liver diseases.22 We cropped similar areas that contain both the collagen fiber and smooth muscles from the original H&E and Masson’s trichrome stained images, and from the digitally stained Masson’s trichrome image. The cropped images are shown in Fig. 6. The original H&E and Masson’s trichrome stained images are shown at the leftmost and rightmost panels, and the result of the digital staining is shown at the middle panel. While the distinction between collagen fiber and smooth muscle in the original H&E stained image is not as obvious as it is in the Masson’s trichrome stained image, this has been improved after the application of digital staining. The digitally-stained image at the center panel share similar characteristics to the physically stained Masson’s trichrome image on its right in two aspects: 1. the differentiation between the collagen fiber and smooth muscle is better observed; and 2. the acquired colors of these tissue structures. Fig. 6Areas containing both collagen fiber and smooth muscle. These areas were cropped from the original . (a) Original H&E stained image; (b) result of digital staining; and (c) physically stained Masson’s trichrome stained image. The collagen fiber could hardly be differentiated from the original H&E stained image, however application of digital staining results in their improved differentiation in which the smooth muscles were digitally stained with red color and the collagen fibers blue similar to their color when stained with Masson’s trichrome. 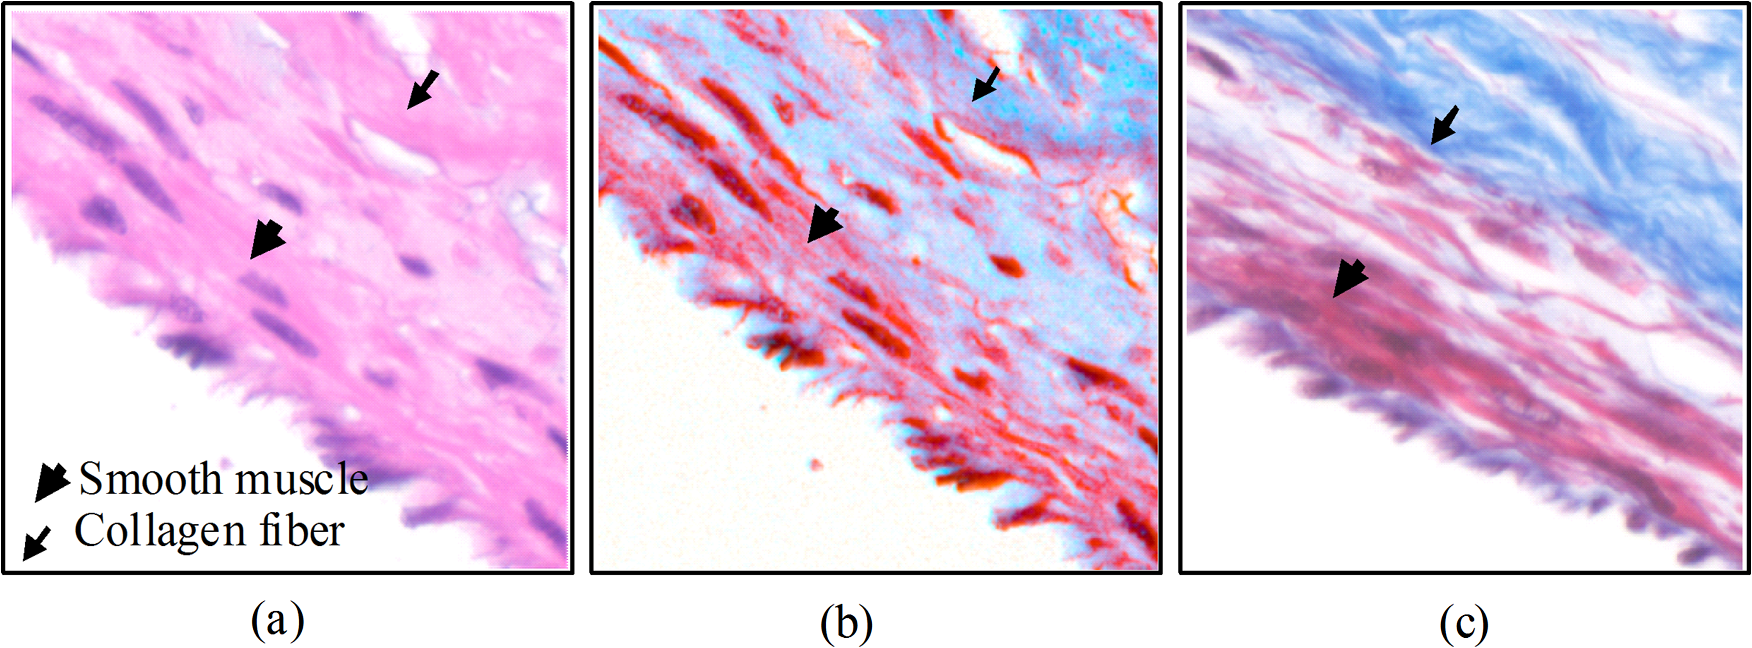 4.DiscussionThe digital staining method we presented in this paper consisted of two general processes: (1) spectral enhancement, and (2) spectral transformation. Linear transformation of transmittance spectra works best when the spectral data in both the reference and target spectral transmittance are linearly separated. In the previous works spectral classification was considered as the solution to address the spectral overlaps in some transmittance classes.10,11 However, even with the application of spectral classification, tissue structures with similar colorimetric attributes were not effectively discriminated. Figure 7 shows the original and enhanced transmittance spectra of the different tissue components, which share similar H&E stained spectral attributes, i.e., cytoplasm, smooth muscle and collagen fiber, projected onto the PC axes. The original H&E spectral clusters in Fig. 7(a) and 7(b) show that there is no clear-cut separation between collagen fiber and smooth muscle. However the cluster plots of the enhanced spectra in Fig. 7(c) and 7(d) show improved separation between these two structures, especially the projection of the enhanced spectra onto PC2 and PC3 axes, Fig. 7(d). The plot illustrates that the spectral residual-errors of the tissue structures contain information which could improve the visualization of H&E stained tissue structures not normally observe with the naked eyes, particularly the differentiation between smooth muscle and collagen fiber. Fig. 7Original and enhanced transmittance spectra of the eosin stained tissue components, i.e., cytoplasm, collagen fiber, and smooth muscle, projected onto the principal component axes. (a) to (b) original spectra and (c) to (d) enhanced spectra. The original spectra of collagen fiber and smooth muscle overlap to certain degree. Application of spectral enhancement minimizes the overlaps.  The use of principal component (PC) vectors to reconstruct the spectrum of a pixel is an established method. In this approach, the optimum number of PC vectors for used in the reconstruction depends on the application requirement.23 In the present experiment, the total number of PC vectors was determined such that the spectral reconstruction errors of the H&E stained spectral samples belonging to the background objects are minimized. With the current image samples, the background objects consisted of five classes of tissue components including the nucleus, cytoplasm, RBC, smooth muscle and duct; these are basically the non-collagen fiber tissue components. Included also in the category of background objects are the white areas which do not contain any tissue structures. We identified the first five PC vectors to reconstruct the spectra of these tissue components based on total amount of variance these vectors captured, Fig. 2. The different PC vectors are displayed in Fig. 8. To illustrate the possible correlation between the PC vectors and the staining characteristics of the spectral samples, the plots of the H and E dyes absorption spectra are also shown in Fig. 9. The first PC vector describes the luminance of the spectral samples. The second PC vector reveals spectral samples with variations in the eosin and hematoxylin dye amounts. The third PC vector demonstrates spectral samples which vary in the short wavelength and within the eosin absorption band. It also describes samples which moderately vary within the absorption band of hematoxylin dye. The fourth PC vector indicates spectral samples which prominently vary within the hematoxylin band, and the fifth PC vector represents spectral variations mainly within the eosin band. Here we see that each of the PC vectors captures particular staining characteristics of the spectral samples. Our experimental results also show that with five PC vectors we could isolate the spectral differences between collagen fibers and other eosin stained tissue structures. While the first two PC vectors captured around 98% of the total variance, they do not necessarily encompass the staining characteristics of the spectral samples. The diverse spectra found in a stained tissue section can be attributed to the absorbing elements in the tissue itself,24 or to the change in the absorption coefficient of some tissue components.25 Since the resulting spectral characteristics of some H&E stained tissue components are attributed by the tissue and the stain itself, superposition of the H and E stain spectra to reconstruct the spectra of these stained tissue components may not completely capture the staining characteristics of these tissue components. Fig. 8The first five principal component vectors derived from the spectral samples of white areas, and non-collagen fiber tissue components, which include the nuclei, cytoplasm, red blood cells (RBC), smooth muscle, and duct.  Fig. 9Normalized plot of the eosin and hematoxylin dye absorption spectra, and the residual error of the collagen fiber. 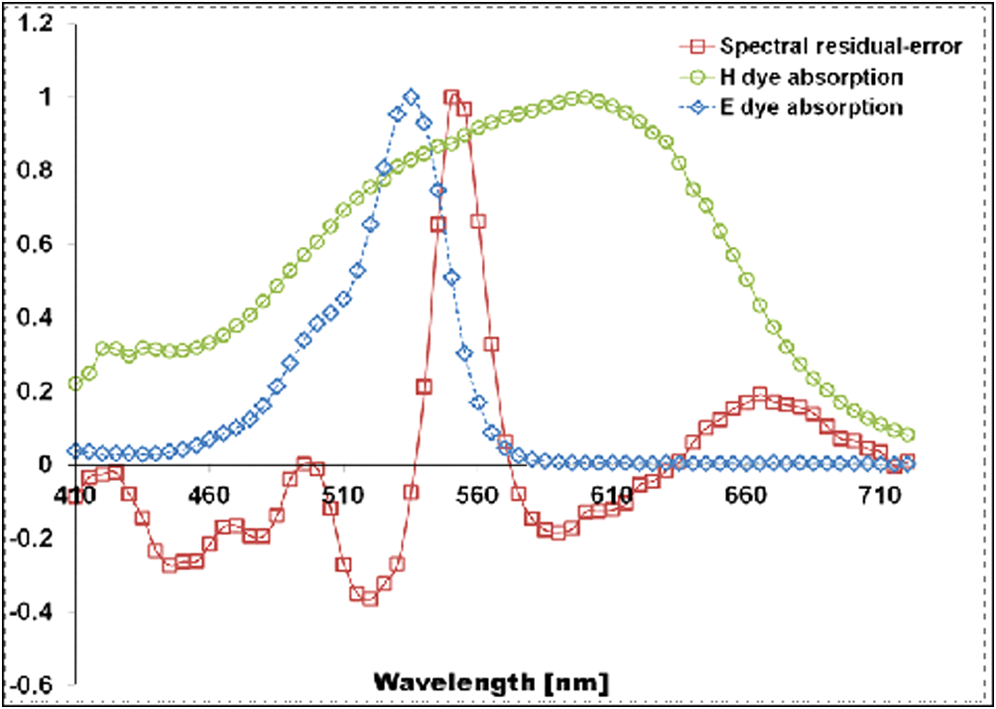 Figure 9 shows the normalized plots of the H and E dye absorption spectra and the spectral residual-error of the collagen fiber. The shape of the spectral residual error closely resembles the eosin dye absorption spectrum with the absorption peak shifted to a longer wavelength. The shift can be linked to the dye-protein interaction wherein the magnitude of the shift is proportional to the amount of protein concentration.26 Thus, it can be thought that the difference between the eosin-stained collagen fiber and smooth muscle lies in the amount of their protein concentrations. 4.1.Limitations and Future WorkThe digital staining process involves some parameters that have to be appropriately specified or computed in order to obtain the ideal results. Spectral enhancement involves the determination of the number of PC vectors as well as the bands for enhancement, while spectral transformation requires the derivation of the transformation matrix. The number of PC vectors and the bands for enhancement could be affected by the characteristics of the spectral samples used to derive them. Hence, the number of PC vectors and the bands for enhancement we used in the present experiments may not hold true for all cases. Possible ways to produce consistent enhancement result are: 1. to standardize the staining conditions of the input images; and 2. to replace the use of the dimensional spectral residual-error in the spectral enhancement. The staining correction method proposed in Ref. 12 can be employed in the pre-processing of the images to obtain standardize staining conditions. And the -dimensional spectral residual-error can be replaced with a one-dimensional variable such that the bands for enhancement do not depend on the spectral residual-error configurations, i.e., where the error peaks. Application of the spectral transformation process using the transformation matrix results in digitally stained images which have similar staining patterns to the physically stained Masson’s trichrome images. However, the colors of the digitally stained tissue components are not yet visually indistinguishable from the real Masson’s trichrome stained ones. An investigation on the more effective ways to implement spectral transformation will be part of our next work. Aside from Masson’s trichrome stain, there are other special stains which are employed to highlight other tissue structures. That is, although it has been shown that the spectral features of H&E stained tissue structures contain information relevant to improving the visualization of collagen fiber and smooth muscle, which are effectively visualize using the Masson’s trichrome special stain, further investigations are still needed to firmly establish whether the information contained in the original H&E spectral feature is complete to warrant the digital conversion of an H&E stained image into an image which displays the staining patterns of any particular special stain. Furthermore, the digital conversion of an unstained histopathology image to its stained image counterpart may require other spectral features and the extension of the multispectral filter sensitivity beyond the visible spectrum.27,28 5.Summary and ConclusionsIn this paper we introduce a digital staining method for histopathology images using multispectral imaging. In the method we utilize the spectral features of a multispectral image and combine the effects of spectral enhancement and spectral transformation to convert an H&E stained image to its Masson’s trichrome stained equivalent. The method can also be extended to convert H&E stained images to images possessing the staining patterns of other special stains. Digital staining goes beyond tissue classification. In addition to discriminating the structures in an image, it offers the kind of visualization inherent to chemically stained tissue sections. The success of this technology will alleviate the cost of staining while providing pathologists immediate access to the special stained images of the physically stained H&E stained tissue section. As whole slide imaging technology continue to evolve, it would be possible in the future to integrate digital staining to whole slide image scanning. ReferencesH. Akbariet al.,
“Detection and analysis of the intestinal ischemia using visible and invisible hyperspectral imaging,”
IEEE Trans. Biomed. Eng., 57
(8), 2011
–2017
(2010). http://dx.doi.org/10.1109/TBME.2010.2049110 IEBEAX 0018-9294 Google Scholar
L. Khaodhiaret al.,
“The use of medical hyperspectral technology to evaluate microcirculatory changes in diabetic foot ulcers and to predict clinical outcomes,”
Diabetes Care, 30
(4), 903
–910
(2007). http://dx.doi.org/10.2337/dc06-2209 DICAD2 0149-5992 Google Scholar
M. E. Martinet al.,
“Development of an advanced hyperspectral imaging (HSI) system with application to cancer detection,”
Ann. Biomed. Eng., 34
(6), 1061
–1068
(2006). http://dx.doi.org/10.1007/s10439-006-9121-9 ABMECF 0090-6964 Google Scholar
M. Mitsuiet al.,
“Color enhancement in multispectral image using the Karhunen-Loeve transform,”
Opt. Rev., 12
(2), 69
–75
(2005). http://dx.doi.org/10.1007/s10043-004-0069-4 1340-6000 Google Scholar
F. P. Wieringaet al.,
“Contrast enhancement of coronary arteries in cardiac surgery: a new multispectral stereoscopic camera technique,”
EuroIntervention, 2
(3), 389
–394
(2006). Google Scholar
I. Kuzminiet al.,
“Towards non-contact skin melanoma selection by multispectral image analysis,”
J. Biomed. Opt., 16 060502
(2011). http://dx.doi.org/10.1117/1.3584846 JBOPFO 1083-3668 Google Scholar
H. Makhloufet al.,
“Multispectral confocal microendoscope for in vivo and in situ imaging,”
J. Biomed. Opt., 13
(4), 044016
(2008). http://dx.doi.org/10.1117/1.2950313 JBOPFO 1083-3668 Google Scholar
N. Hashimotoet al.,
“Multispectral image enhancement for effective visualization,”
Opt. Express, 19
(10), 9315
–0329
(2011). http://dx.doi.org/10.1364/OE.19.009315 OPEXFF 1094-4087 Google Scholar
L. L. Nufferet al.,
“Hyperspecptral/multispectral image enhancement for biological cell analysis,”
Cytometry, 69A 897
–903
(2006). http://dx.doi.org/10.1002/cyto.a.20294 CYTODQ 0196-4763 Google Scholar
P. A. Bautistaet al.,
“Digital staining of unstained pathological tissue samples through spectral transmittance classification,”
Opt. Rev., 12
(1), 7
–14
(2005). http://dx.doi.org/10.1007/s10043-005-0007-0 1340-6000 Google Scholar
P. A. Bautistaet al.,
“Digital staining for multispectral images of pathological tissue specimens based on combined classification of spectral transmittance,”
Comput. Med. Imag. Graph., 29
(8), 649
–657
(2005). http://dx.doi.org/10.1016/j.compmedimag.2005.09.003 CMIGEY 0895-6111 Google Scholar
T. Abeet al.,
“Color correction of pathological images based on dye amount quantification,”
Opt. Rev., 12
(4), 293
–300
(2005). http://dx.doi.org/10.1007/s10043-005-0293-6 1340-6000 Google Scholar
X. WuJ. ThigpenS. K. Shah,
“Multispectral microscopy and cell segmentation for analysis of thyroid fine needle aspiration cytology smears,”
in Proc. IEEE Eng. Med. Biol. Soc., Conf. 2009,
5645
–5648
(2009). Google Scholar
P. A. Bautistaet al.,
“Multispectral image enhancement for H&E stained pathological tissue specimens,”
691836
(2008). http://dx.doi.org/10.1117/12.771046 Google Scholar
P. A. BautistaY. Yagi,
“Digital staining for histopathology images by the combined application of spectral enhancement and spectral transformation,”
in Proc. IEEE Eng. Med. Biol. Soc. Conf., 2011,
8013
–8016
(2011). Google Scholar
A. Kaarna,
“Integer PCA and wavelet transforms for multispectral image compression,”
in Proc. IEEE Geoscience & Remote Sensing Symposium, Int. Conf., 2001,
1853
–1855
(2001). Google Scholar
A. Kaarnaet al.,
“Compression of multispectral remote sensing images using clustering and spectral reduction,”
IEEE Geosci. Rem. Sens., 38
(2), 1073
–1082
(2000). http://dx.doi.org/10.1109/36.841986 0196-2892 Google Scholar
X. ZhangR. LiL. Jiao,
“Feature extraction combining PCA and immune clonal selection for hyperspectral remote sensing image classification,”
in Proc. Artificial Intelligence and Computational Intelligence Int. Conf., 2009,
472
–476
(2009). Google Scholar
M. S. ParkJ. Hee NaJ. Y. Choi,
“PCA-based feature extraction using class information,”
in Proc. IEEE Int. Conf. Syst. Man. Cybern. Int. Conf., 2005,
341
–345
(2005). Google Scholar
K. Shinodaet al.,
“Lossless and lossy coding for multispectral image based on sRGB standard and residual components,”
J. Electron. Imag., 20
(2), 023003
(2011). http://dx.doi.org/10.1117/1.3574104 JEIME5 1017-9909 Google Scholar
S. E. Mills, Histology for Pathologists, Third Edition, Lippincott Williams and Wilkins, Philadelphia
(2007). Google Scholar
D. TzengR. S. Berns,
“A review of principal component analysis and its applications to color technology,”
Color Res. Appl., 30
(2), 84
–98
(2005). http://dx.doi.org/10.1002/(ISSN)1520-6378 CREADU 0361-2317 Google Scholar
K. Fujiiet al.,
“Development of support systems for pathology using spectral transmittance: the quantification method of stain conditions,”
Proc. SPIE, 4684 1516
–1523
(2002). http://dx.doi.org/10.1117/12.467118 Google Scholar
T. Abeet al.,
“Color correction of red blood cells area in H&E stained images by using multispectral imaging,”
in Proc. Computer Graphics, Imaging and Visualization Conf., 2008,
432
–436
(2008). Google Scholar
A. A. WaheedK. Sridhar RaoP. D. Gupta,
“Mechanism of dye binding in the protein assay using eosin dyes,”
Anal. Biochem., 287
(1), 73
–79
(2000). http://dx.doi.org/10.1006/abio.2000.4793 ANBCA2 0003-2697 Google Scholar
A. Hyneset al.,
“Molecular mapping of periodontal tissues using infrared microspectroscopy,”
BMC Med. Imag., 5
(2),
(2005). BMIMA3 1471-2342 Google Scholar
R. S. Gurjaret al.,
“Imaging human epithelial properties with polarized light-scattering spectroscopy,”
Nat. Med., 7
(11), 1245
–1248
(2001). http://dx.doi.org/10.1038/nm1101-1245 1078-8956 Google Scholar
|