
|
|
1.IntroductionKnowledge about retinal oxygenation in the human eye is incomplete because the invasive nature and technical shortcomings of the methods currently used. Optical techniques for measuring retina oxygenation are based on analyzing the amount of light absorbance of blood at different wavelengths due to different light absorption spectra of oxygenated and deoxygenated haemoglobin. Spectroscopy measurements of hemoglobin oxygen saturation in human retinal vessels was initiated by Hickman et al.1 in the 1960s, but has still not been mastered as a reliable and useful clinical or research tool. They estimated retinal vessel oxygen saturation using the Beer–Lambert law. Further studies have been made for five decades to overcome the difficulties of the fundus photographic method, such as nonlinear sensor (photographic film), eye movement during lengthy measurements, small areas measured at one time, and optical complexities within the eye. Tiedeman et al.2 and Beach et al.3 improved this fundus photography technique using digital images, choosing as one wavelength an isobestic wavelength. A scanning oximeter, employing three wavelengths all in the green part of spectrum, of which two are isobestic, was developed in 1988 by Delori4 and more recently by other groups5 who improved this method using four wavelengths. Our study was built on the works of Hickam et al.,1 Beach et al.,3 and Harris et al.5 to develop a non-invasive retinal perfusion imaging (RPI) technique, using a high-resolution confocal scanning laser ophthalmoscope (cSLO). We developed the Aberdeen multispectral cSLO for sequential retinal imaging using a pair of visible and near-infrared wavelengths.6 The intention is to achieve a simple, non-invasive and real-time spectral study of physiologic status of the retina. This may allow early detection of retinal diseases such as diabetic retinopathy (DR), which is crucial for effective treatment. Also this may replace fluorescence angiography in some cases. The SLO illuminates the eye using a low light intensity with high contrast due to low scattering of light. The Aberdeen group previously reported the reproducibility of cSLO measurements in the human eye studies.6–8 The technical difficulties of the spectroscopy method using a conventional ophthalmoscope are to be found mostly in the signal-to-noise ratio, what light intensity levels can be employed without retinal damage, and how much light is needed for accurate detection of the information. This causes major shortcomings in the rapid, sequential, and real-time imaging, although technical improvements in light sources and the detectors are on the way.9 As no high-intensity flash is needed with the SLO, rapid imaging can be carried out, offering the potential for sequential imaging. SLO imaging is carried out point by point, and information is collected as digital images, allowing quantitative measurements and image processing. 2.Methods2.1.Scanning Laser OphthalmoscopeThis work used a prototype of cSLO initially developed in the Department of Bio-Medical Physics and Bioengineering, University of Aberdeen (Fig. 1). The operating principle of the SLO and a more detailed description of the mode of action of the SLO can be found in our previous works.8,10 The device has a 25-deg field of view and an area of about on retina, and it uses two sequential wavelengths, producing co-aligned individual red and infrared video frames. Two lasers were made coaxial via a cube prism, unlike a set of mirrors in other methods.5 An imaging time of 40 ms produces and gives images at a resolution of by a detection system including an avalanche photo diode (APD) and a set of confocal apertures. Fig. 1Schematic presentation of the cSLO components. The incident laser beam is shown by the blue (dark) arrow or line and the reflected light by the red (bright) one.  The image capturing process in the SLO produces an image based on the intensity of the laser beam that arrives on the APD window from the subject. The brightness of image pixels takes a value between 0 (black) and 255 (white). The electronic signal, which is produced by APD, is converted linearly to the value of the pixel by the computer system, so there is a linear relationship between light intensity and pixel value in the digital images.5,6 Therefore, reflected light intensity can be determined by measuring the value of brightness of each pixel in the grayscale image. Smith et al.11 and Lompado et al.12 presented a similar instrument using an SLO in which four or five wavelengths were multiplexed into a frame to produce a single video frame containing a number of interlaced monochromatic images. This limits the number of pixels per wavelength in each frame, consequently leading to lower resolution. This also leads to a lower SNR and higher intensity errors in the final image. In addition, Ashman et al.13 used a non-confocal multiple-wavelength SLO with a small field of view around the optic disc and individual APD for each wavelength, imaging seven frames/s. However, no quantitative assessments of simultaneous dual-wavelength oximetry with an SLO were made by Ashman et al.13 and Elsner et al.14 using similar devices. To overcome these limitations, our technique used a 100-µm confocal aperture to reduce the amount of scattered light collected and also to restrict the light collected to that reflected from a slice of thickness 136 μm [full width at half height (FWHH)] positioned between the internal limiting membrane (ILM) and retinal pigment epithelium (RPE) layers. This technique used lasers of power on the cornea at wavelengths in the red and infrared. This made the laser illumination safer to use; the retina could be imaged for a few minutes, giving an average image with a high SNR and low pixel intensity errors. Furthermore, light collection using the cSLO permitted non-mydriatic imaging, and the levels of illumination were a factor of 200 lower than with the fundus camera. The part of the technique that makes it different from others is using the image processing method as to correct laser illumination across the cSLO retina image and normalize light intensity of the spectral images. This improved the reproducibility of the measurements and the retinal field to determine oxygen levels. It is discussed in more detail in a later section. Initial work looked at how reproducible were the measurements of reflected light from the eye by Aberdeen cSLO. A number of factors needed to be considered to minimize the systematic and random errors. These factors are generally related to the adjustment and alignment of the SLO components (Fig. 1), such as eye positioning and laser power stabilization. 2.2.Data ReproducibilityBefore making quantitative measurements of the image data, it was first necessary to assess the amount of actual changes in intensity caused by two main problems: the non-uniformity of illumination (shading) across the image and the intensity variation of images taken at different times. “Shading” is a slow variation in the brightness of an image across the SLO’s field of view, the minimization of which improves the reproducibility of the measurements. The intensity variation, both across and between the SLO images, was due to (1) optics of the eye and SLO which cause the variation in intensity across the image (shading), and (2) problems of stabilizing the laser power. The source of such variations is usually caused by uneven illumination of the sample due to optical aberration of SLO and laser beam. Figure 2 shows a cSLO sample image of fovea and the intensity profiles across the image along the horizontal and vertical blue lines. Although the center of the horizontal profile is uniform, image intensity decreases toward the edges significantly. The intensity profile along a vertical line through the central area of the image shows the illumination to be more uniform than in the horizontal direction. Fig. 2cSLO eye picture and the intensity profile along the horizontal direction (Mid) and the profile along the vertical direction of the image (Right).  The illumination of SLO images taken at different times can be equalized by a normalization to facilitate comparing brightness of particular parts of retinal images. The schematic in Fig. 3 is an illustration of how non-uniform laser power arriving in the fundus across the field of view causes systematic errors and how different positioning of the eye affects intensity on different days randomly. Shade correction and normalization help to improve reproducibility of the data and reduce measurement errors. Fig. 3Schematic of the intensity profiles of eye images along the horizontal direction in different times. 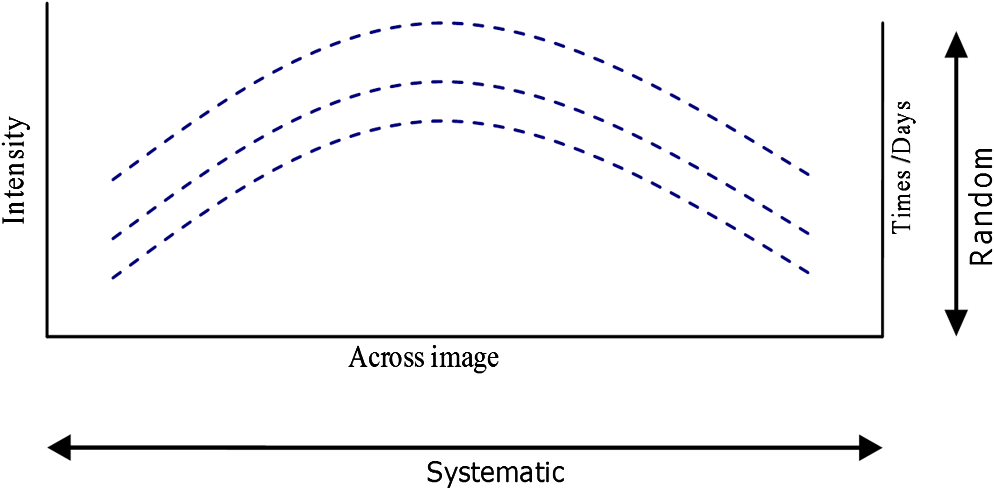 The images were first registered manually using landmarks. Images were then averaged to reduce noise. An algorithm for image correction was developed to minimize the intensity variation across the SLO image, which is due to shading across image and different illumination. The program, using software Matlab 6.1, divided each source image (SI) size into a grid of cells each with , and the mean value of each cell was corrected for the average image intensity of the region allocated (Fig. 4). A more detailed description of the technique of cSLO image correction can be found in Rasta.15 Fig. 4Schematic view of the cell on a sample image and the strip allocated (left). The small arrow shows the direction movement of the cell inside the strip and the horizontal arrow the movement of the strip. The corrected sample image after running the correction process (right). Graphs show the profile of image across yellow line for image before and after correction.  The image brightness variation of repositioning of the eight volunteers’ eyes before and after image correction over 3 days were investigated. To compare the brightness variation on images, all pictures taken of the volunteers’ eyes with red and IR wavelengths were corrected using the correction method. Image registration for each series of the volunteer images was done. Each image (with and without correction) was converted into a grid of cells with size and mean value of each selected cell was obtained. At least six cells around the fovea, excluding vessels, were selected in each image and compared with the same cell on other images on these days. To compare cells in grayscale, different illuminations of the laser on 3 days were compensated. To compare the brightness variation of the cell on different days the uncertainty value (SD/mean) was calculated. The non-parametric Wilcoxon test was performed.16 2.3.Dual-Wavelength CombinationFor imaging of retina perfusion in the eye, it is necessary to capture at least two images with two different wavelengths sequentially.1,5 Using a dual wavelength in which one is an isobestic wavelength, according to the Beer–Lambert law there is a linear relationship between oxygen saturation and optical density ratio of solutions of hemoglobin. The Beer–Lambert law can be applied to hemoglobin solutions, although hemoglobin is not a one-component system. Whole blood is a solution comprising different kind of cells including erythrocytes, which consist of hemoglobin, so blood is a non-homogeneous absorber and attenuates an incident beam through both absorption and scattering. This means that the Beer–Lambert equation cannot be completely valid. In spite of the limitations, some authors1,3 have assumed an approximate linear relationship between oxygen saturation and optical density ratio of whole blood, where concentration and path length remain fairly constant. A constant scattering term, , was introduced by Pittman and Duling17 in their oximetry technique. The oxygen saturation can be obtained by solving the following two equations using two oxygen-sensitive and oxygen-insensitive wavelengths for oxygen saturation : The constant scattering term can be eliminated by [], when is a isobestic wavelength and , where is transmission of light. So the oxygen saturation will be where is is and is the blood concentration which is multiplied by vessel thickness . While this should be obtained in vivo, is considered as a constant for the fundus measurement sites. Therefore a two-wavelength oximetry method is used to estimate or determine its changes.From our previous work, two wavelengths, and , which is an isobestic wavelength, were chosen.8 This combination is commercially available in the form of low-cost diode lasers. Because of the longer wavelengths, red and near infrared, the laser illumination is safe to use for longer exposure times. For and and the extinction coefficients of hemoglobin,18 the saturation equation will become where at .Our wavelength combination provided low-absorbance, independent scattering range.5,8,19 According to the depth of tissue penetration of the two wavelengths, both are reflected from the choroidal layer, it corresponds to the same thickness of fundus tissue. The dual-beam combiner provided co-linear red and infrared beams to take rapid sequential eye images in the same positioning by cSLO. A series of images can be rapidly acquired that, when summed and averaged, give a high SNR. 2.4.Retinal Perfusion ImagingTo investigate the capability of the new dual-wavelength for determining the oxygenation level of retina blood, imaging of volunteers’ eyes was carried out. The transmission of light through artery and vein with respect to the adjacent tissue at two wavelengths were determined. The measurements were made along the vessels of 400–500 pixels’ length in the segments of 50 pixels’ length (about size of 0.5 mm on the retina). The segments were 160 views from eight healthy eyes. Relative oxygen saturation of the segments was calculated, and the potential of the dual images for discriminating between artery and vein was investigated. The outcome suggested the possibility of performing a spectral analysis of the status of the retina by measuring the amount of light reflected using this new technique. To collect light reflected from the retinal plane of interest and reduce the contribution of reflected light from the choroid and sclera, a small confocal aperture was set up (Fig. 5). A confocal aperture of 100 μm was able to collect most of the reflected light from retinal thickness, while it reduced the amount of scattered light collected, improving image contrast [Fig. 5(b)].6 Fig. 5Schematic representation of depth selection by the confocal aperture. The reflected light from layer 2 (green) is collected. Brightness at different retinal planes. More superficial plane (1) vitreous, deeper plane (16) choroid.  In the next step, the potential of the technique for detection of normal and non-perfused retina was investigated. Measurements were made of the superior temporal part of the retina and a selection of artery and vein branches extending peripherally. Small-size confocal apertures ( and 100 μm) were chosen to overcome the effect of choroidal vessel reflection by blocking most parts of the reflected light from choroid. This size of aperture corresponds to the FWHH of 91- and 136-μm thickness of retina,6 respectively. The laser beam that illuminates the eye has low power of , so the aperture collects the reflected intensity as low as about . Because a small confocal aperture decreases the SNR, sequential images were averaged to reduce noise. The reflection intensities from the eye using the dual wavelengths were measured, and the ratio image of the red/IR was created to investigate retinal perfusion of human eye. Figure 6 shows how a red/IR ratio image is produced. Two images at 670 and 810 nm were taken from volunteers’ eyes sequentially. Registration and correction were done to produce normalized images. Finally, the ratio image was calculated. The ratio intensity of red/IR images for healthy volunteers’ retinas was calculated, and overall signal variation in the ratio image was measured. To determine the variation across the ratio image, same-size regions were considered in the image. The average intensity and the standard deviation of each region were obtained, and standard deviation between the regions was calculated to assess the variation across the image. The steps taken from volunteer recruitment to displaying the retina perfusion are described in our previous work.15 Informed consent was obtained from all participants enrolled. Fig. 6Red and infrared retinal images (top) and the pseudo-image, the ratio of reflected intensity red/IR images (bottom). The stages from top to bottom are sequential red and infrared imaging (a), averaging and registration (b), correction and normalization (c), and ratio image (d). Artery (bright vessels) and vein (dark vessels) are clearly discriminated on these images. 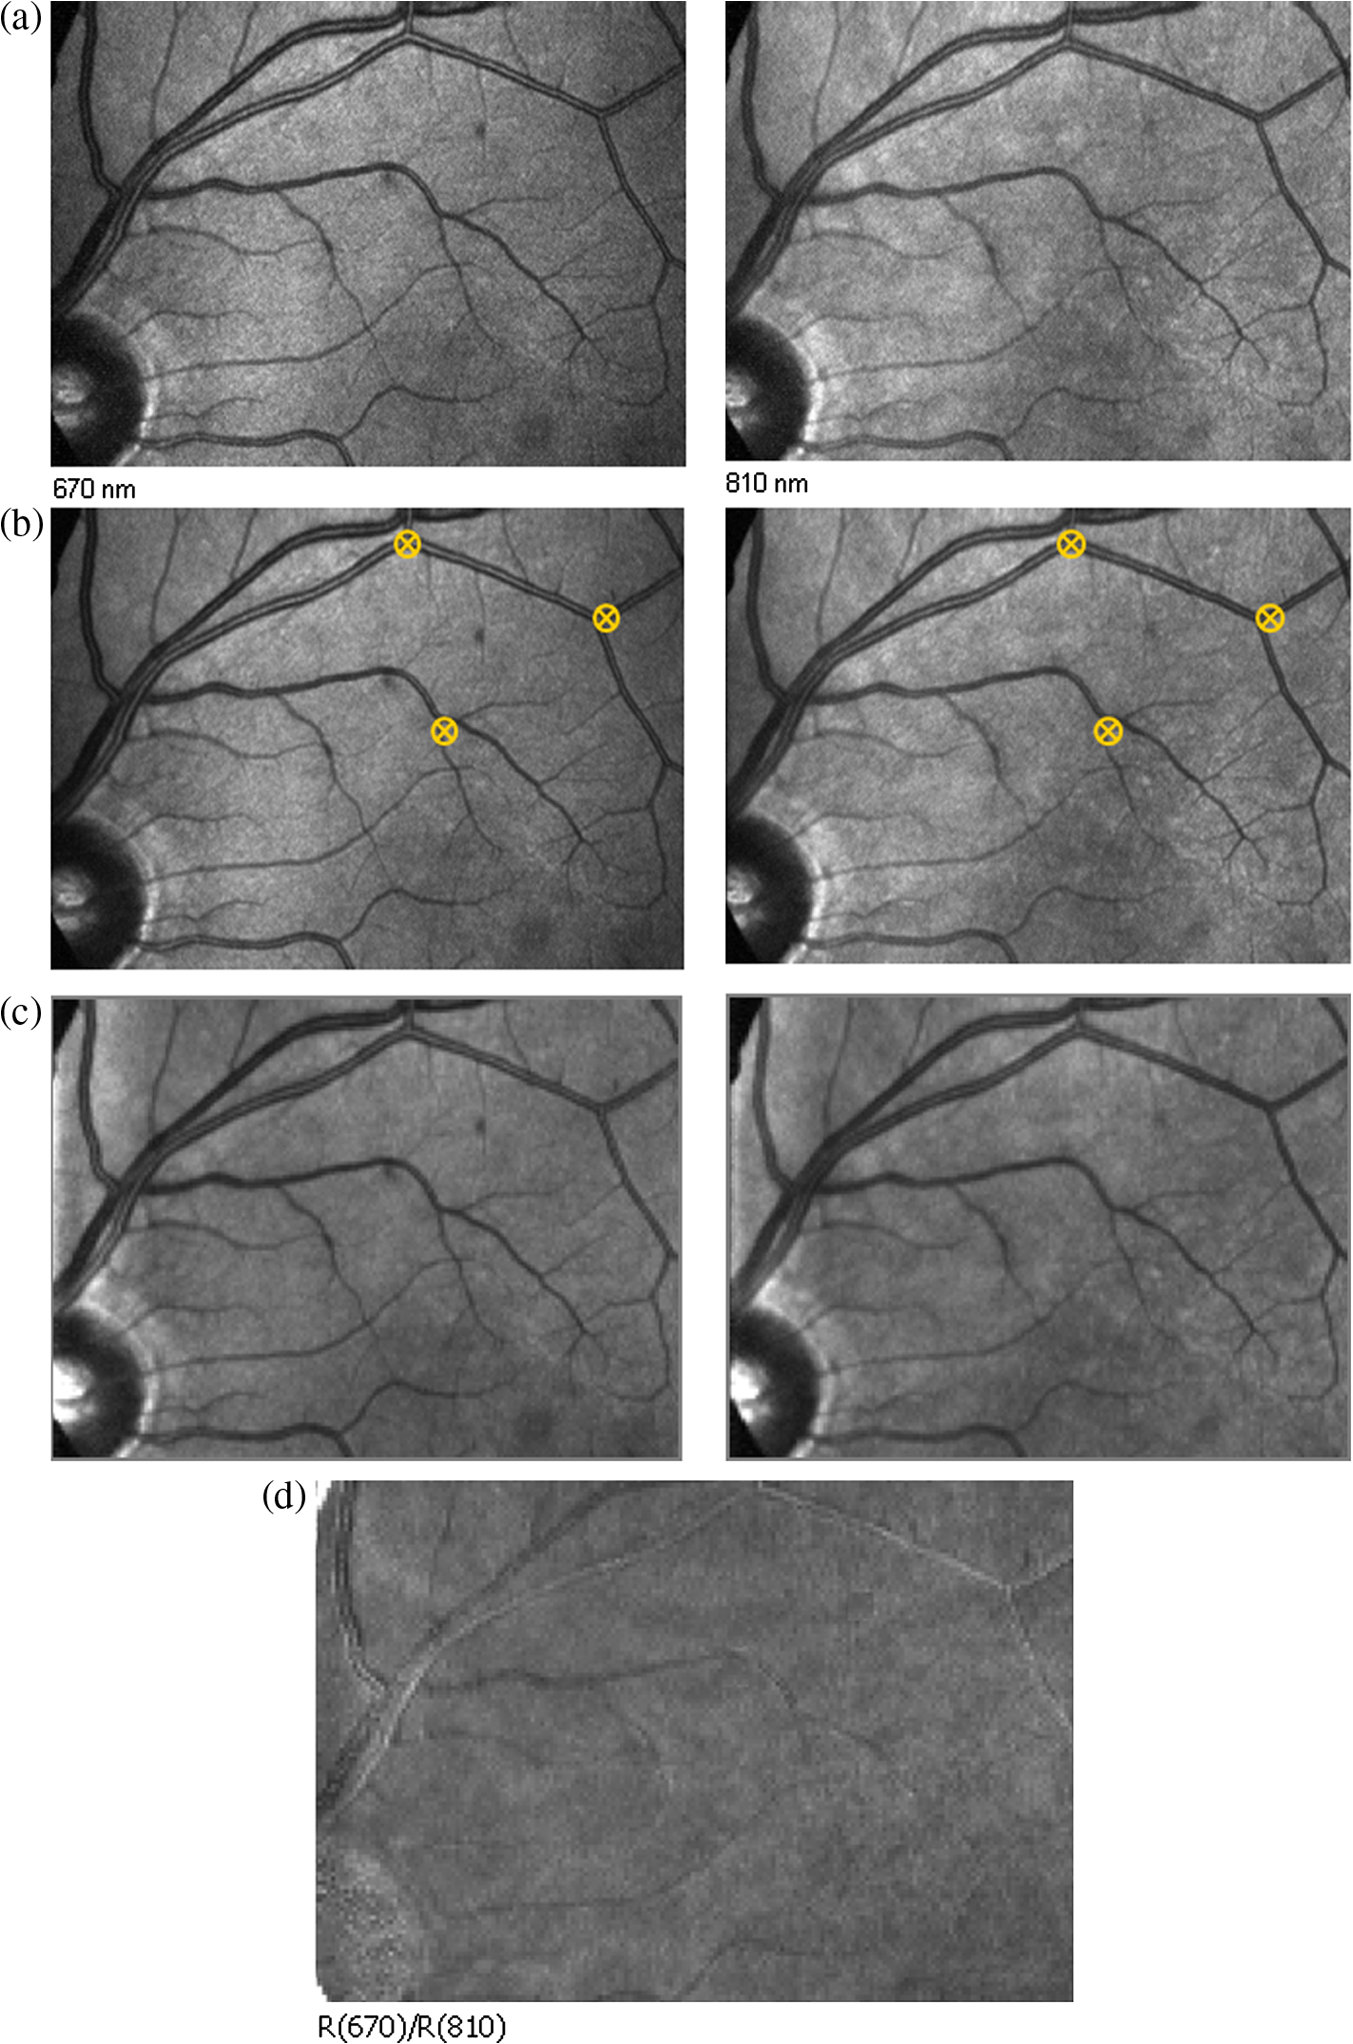 3.ResultsThe experiments showed that realignment of SLO components, such as the confocal aperture and repositioning of the eye, produces an overall variation in image intensity of 5%. An accurate positioning of the eye perpendicular to the laser beam could decrease the intensity variation up to 2.5%. Using the dual-beam combiner, red and infrared wavelengths were merged for easier and more accurate sequential spectroscopic imaging (Fig. 7). Fig. 7Dual-beam images demonstrate good alignment of the cSLO. (left) Red wavelength (right) infrared wavelength.15 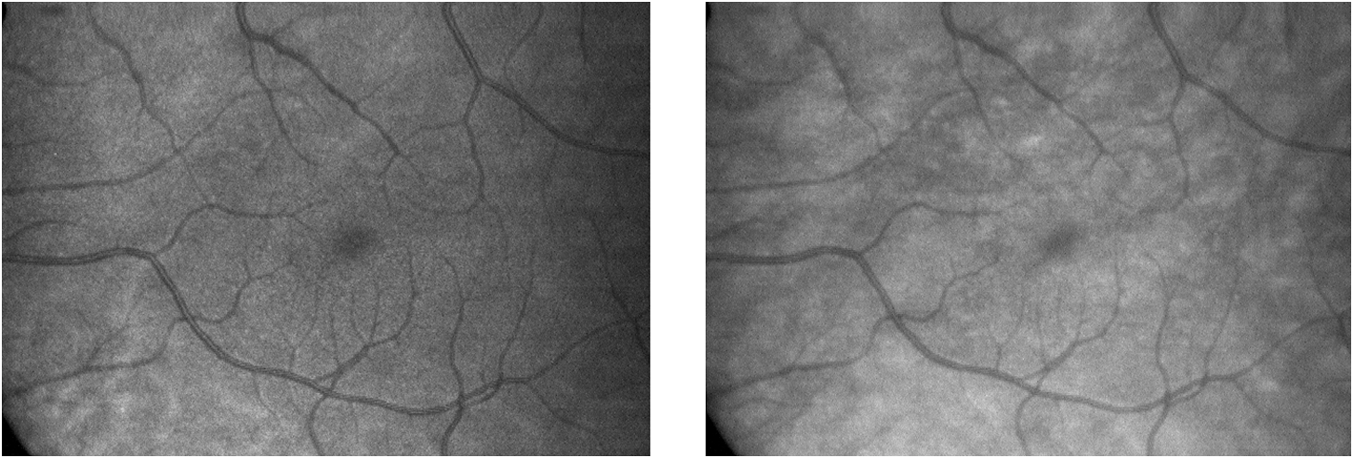 The high-frequency components largely represent the non-uniformity of the reflecting surface and structures such as blood vessels, and not SLO performance. Because the same laser beam illuminates all points on the retina, the illumination of retina remains uniform. The reflected light from all points of the fundus arrives at the single APD, and this detector has good linearity over the range of power levels used. While the uniformity of illumination has been confirmed by the Aberdeen group,6,8,10,20 only about half of the image area scanned is uniform. They suggested that the large variation in the uniformity of reflected signal along the horizontal direction is mainly due to the small size of the mirrors used to produce the horizontal scanning motion of the beam, in comparison with the diameter of the reflected beam coming from the edge of the illuminated field. In fact, good uniformity is limited to 12 deg of the 25-deg scanned angle in the horizontal direction. The results for healthy volunteers using two red and IR wavelengths on three different times and days showed a significant variation on different positioning and average of cell intensity variations of at least 3%, up to 12%, with mean value 5.6% (Fig. 8). This confirmed that, in spite of any care that was taken in the SLO setup and the positioning of the volunteers’ eyes, there can be considerable variations in image intensity expected to affect the capability of the instrument to measure tissue perfusion. Therefore, an intensity correction on images has been required to minimize intensity variations on images taken on different positions and also across images due to shading problems. The standard deviation of uncertainty mean value of cells presented less uncertainty variation for corrected images than for original images. Fig. 8Uncertainty variations of the selected cells of images before and after correction obtained from healthy volunteers with two-wavelength imaging.  The statistical test of six selected areas on each image, one set before and the other set after correction, showed a significant difference () of the uncertainty value. These uncertainty values were decreased after image correction to less than 2% on each of the three times. This correction therefore provided a more reproducible SLO measurement. The results showed it is possible to derive oxygen saturation information for retinal blood vessels from reflection spectra using the combination of dual wavelengths through cSLO retina images, although calculating absolute oxygen saturation of the retinal vessels is not proposed for this study. The oxygen saturation of arteries around the optic disk (Fig. 9) has been determined using Eq. (1) as an average, . Meanwhile it was for veins, showing an overestimation of oxygen saturation for veins. Expected values previously reported by different authors are in range of 92% to 102% (SD 8%) for the retina artery and 54% to 70% (SD 26%) for vein.1–5 Fig. 9Healthy eye sample image used for calculating oxygen saturation in three pairs of artery and vein. The regions demarcated by the dashed lines indicate the vessel parts used for the analysis. 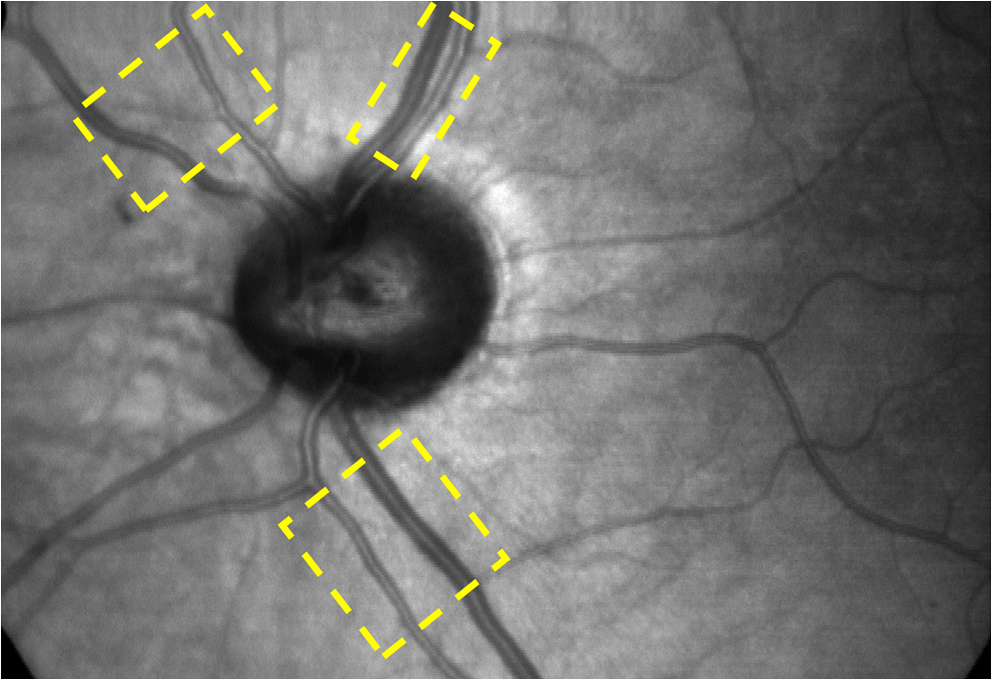 The result of the reflected intensity variation from healthy volunteers’ retinas demonstrated an average range of , except for regions with different topography such as fovea, vessels, and their bordering tissues. There was no significant difference in the measured values among the areas derived from the ratio image (Fig. 10). Fig. 10Images of two samples produced by optical density ratio (red/IR) from healthy volunteers. Color-scaled levels correspond to relative oxygen levels, from low (blue) to high (red). 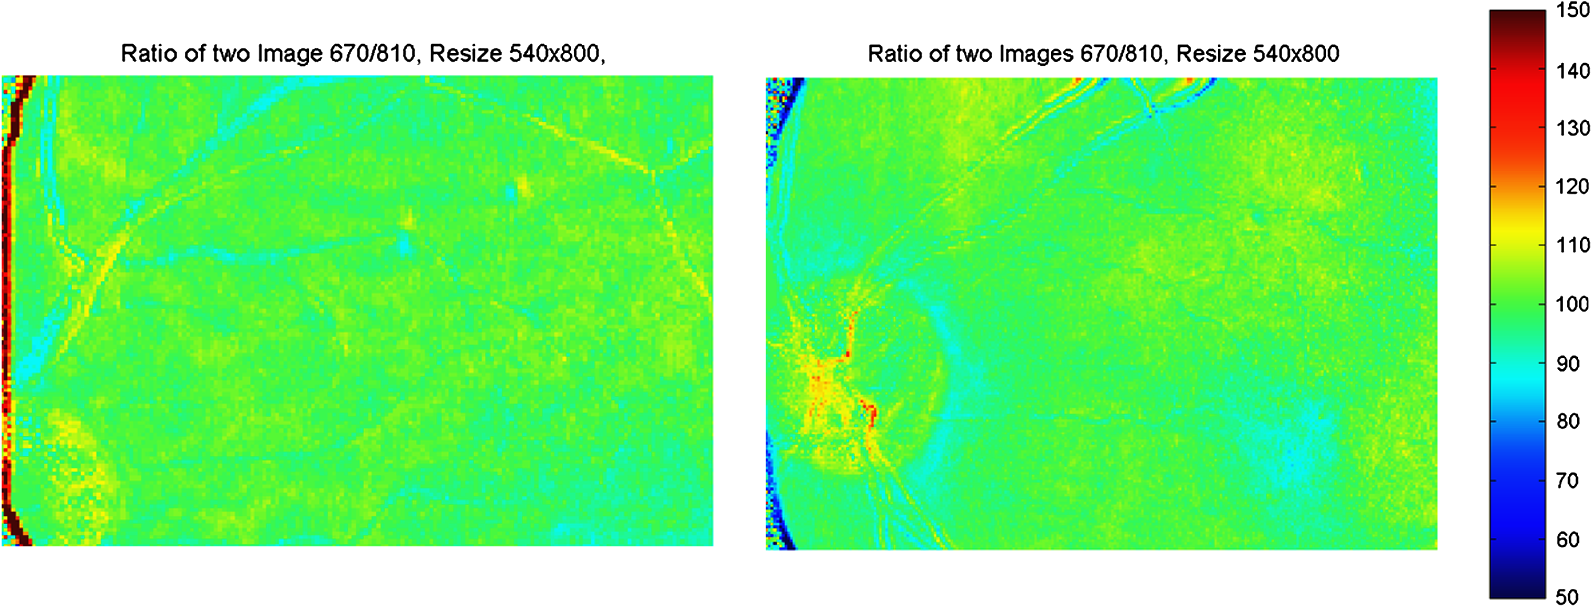 The experiment using a 100-µm confocal aperture for assessing of oxygen saturation variation on three different focal planes showed coefficient variation of less than 6% for healthy subjects. This could not affect discrimination of relative oxygen saturation in artery and vein. The results show that the reflected intensity of the red (670 nm) and infrared (810 nm) wavelengths from the pairs of artery and vein are significantly discriminated () [see Fig. 11(a)]. Figure 11(b) shows that the ratio of transmission of the artery for is higher than that for the vein, according to what is represented using oxygen saturation Eq. (3). Fig. 11(a), Scatterplot of the light reflectance for 64 pairs of arteries and veins from eight healthy eyes. Standard deviation bars show the variation along the vessels. (b), Average transmission ratios [] of artery and vein at two wavelengths for healthy eyes. 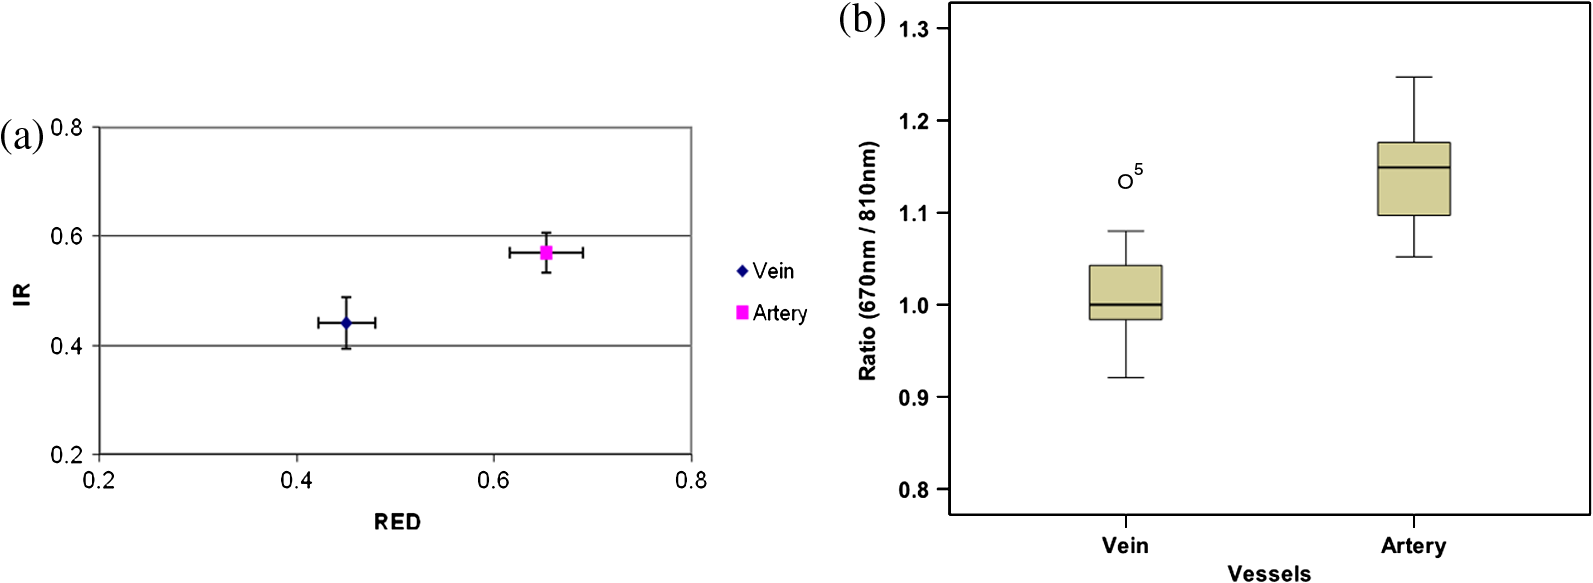 This two-wavelength technique demonstrated good potential for determining the ratio of oxygen levels in the retina and meeting calibration requirements. In this technique, for the first time, an image processing technique was designed and used to minimize the errors of oxygen saturation measurements by illumination correction in wide field of the retina by increasing SNR. It could help to detect those areas of the retina that have lower oxygen levels. 4.DiscussionThis work investigated the potential of a cSLO utilizing dual wavelengths to assess retinal oxygenation in the human eye. The capability of the new technique to discriminate the oxygenation levels of retinal artery and vein was successfully demonstrated, and it showed promise in the diagnosis of the perfused retina. We described a new technique for spatially mapping the relative oxygen saturation in retinal tissue based on spectral imaging, a method for illustrating the optical density ratio at each pixel of a conventional image. With constant illumination, our method can be used to collect spectral information over surface of the retina. The use of the high-resolution cSLO and the dual-beam combiner to image the retina simultaneously at two wavelengths is an extension of the earlier works of Beach et al.3 and Hickam et al.,1 who used the fundus camera, offering significant advantages over that approach. We found that the correction technique increases the uniformity across the image as well as shade correction. The results demonstrated the combination of an isobestic wavelength (810 nm) and a wavelength (670 nm) that gives a maximum difference between the extinction coefficients of hemoglobin and oxy-hemoglobin led to a linear relationship between oxygen saturation and optical density ratio.8 Using only a dual combination of wavelengths 670 and 810 nm makes this method different from other methods11,12,21 that used four wavelengths (488, 635, 670, and 830 nm) to get a significant result and minimize error. In particular, the large spectrum range () used by some authors11,12,21 nearly exceeds the spectral responses of photomultiplier and APDs. On the other hand, the fundus reflectivity varies significantly across this range of wavelengths. We overcame this by using our two close wavelengths with small spectrum range (), as well as achieving adequate sensitivity to relative oxygen saturation. However, the wavelength pair that we used is close to one of the pairs (633 and 815 nm) used by some authors.13,14 For the red wavelength of 670 nm we used, there is a large difference in the extinction coefficients of oxygenated and deoxygenated hemoglobin. This significant difference helped distinguish the concentration of oxygenated and deoxygenated hemoglobin more accurately. However, some investigators13,14 using the same wavelengths were unable to measure quantitative oxygen saturation for vessels using an SLO. In their measurements with infrared wavelengths, the background reflectance was affected by the reflectance of choroidal vessels. Denninghoff et al.22 introduced blue-green oximetry using an on-axis scanning retinal vessel oximeter in a small area with a good saturation calibration accuracy. This method is different from our technique in terms of the wavelengths and the confocal aperture used. This study showed advantages of using long wavelengths, red and infrared, to decrease reflections from surface layer, low scattering, and same-tissue thickness sampling. Where our wavelengths are set, the 670-nm recording wavelength produces a high contrast between both artery and vein against the fundus background and provides the highest ratio of light absorption between saturated and de-saturated blood.8 The wavelength combination used by other researchers11,12,21 led to large random errors in calculated saturation, and inability to scan along the length of vessel generally resulted in systematic errors due to local variations in fundus pigmentation. These methods required individual calibration for each subject based on arterial transmittance measurements and arterial saturations determined from pulse oximeter readings. Smith et al.11 had limitations on applying in vitro laboratory measurements to different human individuals. This study showed that the scanning laser ophthalmoscope provides imaging at low light intensity () with low scattering light. Short image acquisition times (40 milliseconds per frame) minimize degradation from saccadic movement of the eye. Furthermore, linear variation of light intensity passing through the SLO components provided accurate and reproducible measurements from retinal images.8,15 In techniques that use a fundus camera, contributions of reflections from choroid blood diffused into the retina are large, and reflections from choroid are not controlled or removed; thus retinal oxygen saturation measurements are affected increasingly. On the other hand, to capture an image using a fundus camera, the whole retina is illuminated and scattered light from retina tissue contributes to the measurements of vessels, so it makes significant errors. In the cSLO using a small confocal aperture (100 μm), we were able to collect most of the reflected light from retinal thickness, while reducing the amount of scatter light collected. Moreover, the results of oximetry using the fundus camera have been limited to only retinal vessels in a small area around the optic disk because of non-uniform illumination of the retina. This technique using two wavelengths gives the ratio og oxygen levels in a wide 25-deg field of view across retina tissue as well as vessels. In this study, confocal aperture of SLO offered the potential for both reducing the amount of collected scattered light and selecting from which retinal plane or depth the reflected light is being detected, improving quantitative measurements. Ability to image at a specific wavelength and the option of simultaneously imaging at a number of wavelengths (e.g., dual wavelengths) allows the possibility of in vivo spectroscopic investigation of retinal tissue. We found that a confocal aperture of 100 μm is able to collect most of the reflected light from retinal thickness from ILM to RPE layers. While the contribution of reflected light from choroid and sclera is small, we still cannot disregard the potential influence of the choroid capillaries and vessels.6 We supposed that the oxygen level of healthy retina remains in a range between arteriole-vein oxygen levels, and the results were in good agreement with this.8,23,24 In this study, in agreement with others, we found the average amount of oxygen saturation for healthy normal eyes. Comparing these results with results from studies that used different retinal oximetry methods is of limited value, however, because we measured relative values and no calibration was used. However, the reproducibility could be compared with earlier results, although this comparison is somewhat limited by the different methodologies applied. Oxygen saturation measurements of the vessels were in good agreement with other studies,1–5,22,25,26 particularly for artery, although device calibration is required for getting accurate measurements of oxygen.5 This method has shown differences in oxygen saturation levels along veins (less than 75%) and arteries (more than 80%) within the eight to 10 segments of 50-pixel length () in the temporal retina of healthy volunteers’ eyes. The method of analyzing vessels enables comparison between the corresponding segments in the vascular hierarchy at the same distance from the optic disc. This ability should be especially useful in the venous network for localization of areas of relative hypoxia.23,24,27 Moreover, we used eight diabetic retinopathy eyes and compared the measurements of capillary non-perfusion on their retinas using our technique with ophthalmologists’ reports using the FA images. It showed good agreement, with over 87% sensitivity. The result of the calculation for three pairs of arteries and veins around the optic disc showed strong agreement with previous measurements for arteries, 92%–102%. By other groups, however, it was overestimated for veins comparison with others, 54%–72%.1–5,22,25,26 However, some studies reported higher oxygen saturation limits, 70%–83%, for the vein, closer to our measurements.5,26,28 Former studies showed that the minimum error for oxygen saturation increased as decreased.5,19,27 Delori,4 moreover, found that where the diameter of vessels decreases by about 10%–14% (at 120–100 μm diameter) there is a substantial increase in venous , from 41% to 65%, without any change in arterial .4 The result of spectroscopy obtained by Schweitzer et al.28 displayed a significant difference in venous oxygen saturation, up to 75%, at a distance of one to two disc diameters away from the optic disc. Furthermore, other researchers reported that the scans of areas far from the disc depict the background elements (irregulars), which can significantly influence the measured transmittance of a vessel.5,19,27 It is generally agreed that vein oxygen saturation changes 5%–18%, more than for the artery, about 2%–5%.4,5,23,27 The results from healthy volunteers showed that the average coefficient of variation for transmission changes along the vessels; for the vein, this is 10%, which is more than that for the artery, 8%. Therefore, the reproducibility of our oxygen saturation results is comparable to that in former reports. No clinical technique is currently available for quantifying ocular oxygenation because of the invasive nature and technical shortcomings of the methods currently used. The techniques for quantifying oxygen levels in the human eye are gradually improving toward clinical applications.22–26 Some problems that arise from specular reflection at the vessel wall and the perturbing influence of the neighboring vessels were considered to minimize errors.4 Some factors due to both the eye and also to the imaging system had adverse effects, causing artifacts. These artifacts were caused by a variety of mechanisms. Some factors caused by the eye were not controllable, such as pigmentation changes, location and topology of retina surface, artifacts within vitreous, drusen, and data acquisition errors, mostly from a patient’s movement of eye between images or head between changing fields of view. Although we showed a little control of the correct positioning of eye and imaging field, we could avoid more errors in the final processed images that are potential sources of false positives/negatives. The technique of spectral RPI has many advantages over some previous approaches using fundus camera, such as the high spatial resolution, fast imaging, low-power laser light, less scattering and absorption light, a combination of two long wavelengths, and no dye injection or eye drops. RPI has enabled us to study relative oxygen level in the fundus with a field of view of 25 deg. By illustrating the relative oxygen saturation level on the fundus image, the status of retinal circulation can be expressed as oxygen saturation levels, which cannot be done with fluorescence in angiography. In summary, this technique may serve as a non-invasive means to detect the areas with DR changes from the non-ischemic to the ischemic, instead of doing fluorescence angiography. At the moment, blood perfusion of the fundus is being investigated by angiography, which requires using the injection of dyes and eye drops. However, using our technique, we were able to map relative oxygen levels on retina, so we recommend that angiography may be replaced in some eye imaging areas by this technique, which is non-invasive and does not use dyes. This also would be time- and cost-efficient for patients and doctors during diagnosis or follow-up of therapeutic intervention. Moreover, this may allow early detection of retinal ischemic diseases. The next experiment is with diabetic retinopathy eyes to find out whether the light reflection from fundus is able to represent the status of retinal perfusion. To validate and assess sensitivity of the method in the next study, there is need to do a comparison of the screened patients with retinal ischemic disease (or with non-perfusion retinal area) such as diabetic retinopathy confirmed by angiography, with the obtained result of images generated by the cSLO. AcknowledgmentsThe authors acknowledge the financial support of Tabriz University of Medical Sciences and Ministry of Health and Medical Education for this study. Invaluable comments were received from Dr. Alan Fleming, Dr. J Olson, Dr. P. Vieira, and Dr. Sima Salarirad. ReferencesJ. B. HickamR. FrayserJ. C. Ross,
“A study of retinal venous blood oxygen saturation in human subjects by photographic means,”
Circulation, 27
(3), 375
–385
(1963). http://dx.doi.org/10.1161/01.CIR.27.3.375 CIRCAZ 0009-7322 Google Scholar
J. S. Tiedemanet al.,
“Retinal oxygen consumption during hyperglycemia in patients with diabetes without retinopathy,”
Ophthalmology, 105
(1), 31
–36
(1998). http://dx.doi.org/10.1016/S0161-6420(98)71029-1 OPANEW 0743-751X Google Scholar
J. M. Beachet al.,
“Oximetry of retinal vessels by dual-wavelength imaging: calibration and influence of pigmentation,”
J. Appl. Physiol., 86
(2), 748
–758
(1999). JAPYAA 0021-8987 Google Scholar
F. C. Delori,
“Noninvasive technique for oximetry of blood in retinal vessels,”
Appl. Opt., 27
(6), 1113
–1125
(1988). http://dx.doi.org/10.1364/AO.27.001113 APOPAI 0003-6935 Google Scholar
A. Harriset al.,
“A review of methods for human retinal oximetry,”
Ophthalmic Surg. Laser. Imag., 34
(2), 152
–164
(2003). Google Scholar
P. Vieiraet al.,
“Tomographic reconstruction of the retina using a confocal scanning laser ophthalmoscope,”
Physiol. Meas., 20
(1), 1
–19
(1999). http://dx.doi.org/10.1088/0967-3334/20/1/001 PMEAE3 0967-3334 Google Scholar
P. F. Sharpet al.,
“The scanning laser ophthalmoscope: a review of its role in bioscience and medicine,”
Phys. Med. Biol., 49
(7), 1085
–1096
(2004). http://dx.doi.org/10.1088/0031-9155/49/7/001 PHMBA7 0031-9155 Google Scholar
S. H. RastaA. ManivannanP. F. Sharp,
“Spectroscopic imaging of the retinal vessels using a new dual-wavelength,”
Proc. SPIE, 7368 736805
(2009). http://dx.doi.org/10.1117/12.831635 PSISDG 0277-786X Google Scholar
A. R. Harveyet al.,
“Spectral imaging in a snapshot,”
Proc. SPIE, 5694 110
–119
(2005). http://dx.doi.org/10.1117/12.604609 PSISDG 0277-786X Google Scholar
P. F. SharpA. Manivannan,
“The scanning laser ophthalmoscope,”
Phys. Med. Biol., 42
(5), 951
–966
(1997). http://dx.doi.org/10.1088/0031-9155/42/5/014 PHMBA7 0031-9155 Google Scholar
M. H. Smithet al.,
“Retinal vessel oximetry: toward absolute calibration,”
Proc. SPIE, 3908 217
–226
(2000). http://dx.doi.org/10.1117/12.387526 PSISDG 0277-786X Google Scholar
A. Lompadoet al.,
“Multi-spectral confocal scanning laser ophthalmoscope for retinal vessel,”
Proc. SPIE, 3920 67
(2000). http://dx.doi.org/10.1117/12.379584 PSISDG 0277-786X Google Scholar
R. A. AshmanF. ReinholzR. H. Eikelboom,
“Oximetry with a multiple wavelength SLO,”
Int. Ophthalmol., 23
(4), 343
–346
(2001). http://dx.doi.org/10.1023/A:1014406831412 INOPDR 0165-5701 Google Scholar
A. E. Elsneret al.,
“Reflectometry with a scanning laser ophthalmoscope,”
Appl. Opt., 31
(19), 3697
–3710
(1992). http://dx.doi.org/10.1364/AO.31.003697 APOPAI 0003-6935 Google Scholar
S. H. Rasta,
“Perfusion imaging of the human eye using scanning laser ophthalmoscope,”
University of Aberdeen, UK,
(2008). Google Scholar
S. Siegel, Nonparametric Statistics for the Behavioural Sciences, International StudentMcGraw Hill, London
(1959). Google Scholar
R. N. PittmanB. R. Duling,
“A new method for the measurement of percent oxyhemoglobin,”
J. Appl. Physiol., 38
(2), 315
–320
(1975). JAPYAA 0021-8987 Google Scholar
O. W. Van Assendelft, Spectrophotometry of Haemoglobin Derivatives, Royal Van Gorcum, Assen, The Netherlands
(1970). Google Scholar
M. H. Smith,
“Optimum wavelength combinations for retinal vessel oximetry,”
Appl. Opt., 38
(1), 258
–267
(1999). http://dx.doi.org/10.1364/AO.38.000258 APOPAI 0003-6935 Google Scholar
A. ManivannanP. F. SharpJ. V. Forrester,
“Performance measurements of an infrared digital scanning laser ophthalmoscope,”
Physiol. Meas., 15
(3), 317
–324
(1994). http://dx.doi.org/10.1088/0967-3334/15/3/010 PMEAE3 0967-3334 Google Scholar
J. Dreweset al.,
“An instrument for the measurement of retinal vessel oxygen saturation,”
Proc. SPIE, 3591 114
–120
(1999). http://dx.doi.org/10.1117/12.350607 PSISDG 0277-786X Google Scholar
K. R. Denninghoffet al.,
“Retinal oximeter for the blue-green oximetry technique,”
J. Biomed. Opt., 16
(10), 107004
(2011). http://dx.doi.org/10.1117/1.3638134 JBOPFO 1083-3668 Google Scholar
H. Narasimha-Iyeret al.,
“Automatic identification of retinal arteries and veins from dual-wavelength images using structural and functional features,”
IEEE Trans. Biomed. Eng., 54
(8), 1427
–1435
(2007). http://dx.doi.org/10.1109/TBME.2007.900804 IEBEAX 0018-9294 Google Scholar
S. Yoneyaet al.,
“Retinal oxygen saturation levels in patients with central retinal vein occlusion,”
Ophthalmology, 109
(8), 1521
–1526
(2002). http://dx.doi.org/10.1016/S0161-6420(02)01109-0 OPANEW 0743-751X Google Scholar
S. H. Hardarsonet al.,
“Automatic retinal oximetry,”
Invest. Ophthalmol. Vis. Sci., 47
(11), 5011
–5016
(2006). http://dx.doi.org/10.1167/iovs.06-0039 IOVSDA 0146-0404 Google Scholar
S. K. Kimet al.,
“Retinal oximetry based on nonsimultaneous image acquisition using a conventional fundus camera,”
IEEE Trans. Med. Imag., 30
(8), 1577
–1580
(2011). http://dx.doi.org/10.1109/TMI.2011.2140329 ITMID4 0278-0062 Google Scholar
M. Hammeret al.,
“Retinal vessel oximetry-calibration, compensation for vessel diameter and fundus pigmentation, and reproducibility,”
J. Biomed. Opt., 13
(5), 054015
(2008). http://dx.doi.org/10.1117/1.2976032 JBOPFO 1083-3668 Google Scholar
D. Schweitzeret al.,
“In vivo measurement of the oxygen saturation of retinal vessels in healthy volunteers,”
IEEE Trans. Biomed. Eng., 46
(12), 1454
–1465
(1999). http://dx.doi.org/10.1109/10.804573 IEBEAX 0018-9294 Google Scholar
|


