|
|
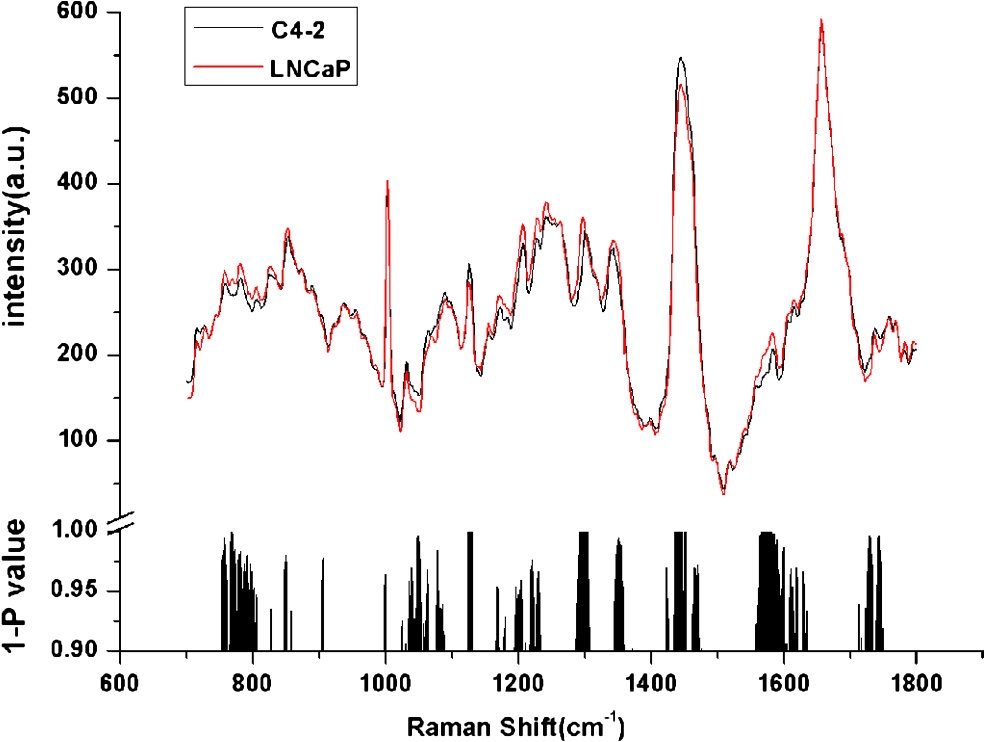
1.IntroductionProstate cancer (PC) is the most frequently diagnosed cancer in men.1,2 Androgen deprivation therapy (ADT) remains the mainstay of management of advanced PC. However, patients who receive ADT progress to castration-resistant prostate cancer (CRPC) in a median interval of 12 to 24 months.2–5 It had been proven that the median survival of patients with CRPC is only 15 to 19 months,6,7 Thus, disease progression and death invariably and rapidly follow CRPC. Currently, there is still a lack of reliable methods for early identification and prediction of CRPC from clinical specimens. Although serum prostate specific antigen (PSA) has been considered the main indicator to assess the treatment response of ADT, it must be stressed that PSA level is not a reliable marker for CRPC and could not stand alone as a follow-up test.2,8–10 Patients with Gleason score 8 to 10 took a significantly shorter time to CRPC,11–13 but the significant predictive value of high Gleason grade remains controversial. Therefore, it is very desirable to predict the prognosis of patients with primary PC using new technologies on clinical practice. Additionally, accurate evaluation of PC status could lead to adequate treatment plan for individual patient to increase the chance of cure. Raman spectroscopy (RS) is a laser-based analytical technique which has capability of characterizing tissues at a molecular level. Previous research has demonstrated that RS could accurately identify normal and bladder cancerous tissue in vitro and in vivo,14–16 and even diagnose bladder cancer through the epithelial cells in voided urine.17 RS was also able to distinguish different subtypes of renal cell carcinoma based on its pathohistologic characteristics.18 Crow et al.19 utilized RS to identify the androgen-dependent prostate cancer (ADPC) (LNCaP, CaP 2b) and CRPC (PC3, DU145) cells effectively. These promising results support the potential application of RS to identify CRPC in clinical practice. Nevertheless, previous studies only employed established PC cell lines but not clinical specimens. In this study, we first employed LNCaP and C4-2 as the model to explore the applicability of RS on distinguishing CRPC from ADPC. Furthermore, a diagnostic algorithm for RS was developed to predict CRPC in a cohort of patients presenting with advanced or metastatic disease. 2.Materials and Methods2.1.Cell Culture and PreparationHuman PC LNCaP and C4-2 cells were previously reported,20,21 and cultured in RPMI-1640 (Gibco) medium with 10% fetal bovine serum (Hyclone) at 37°C with 5% in humidified incubators. Cell samples were prepared as previously described.19,22 Cells were seeded in a culture dish at a density of and grown to 80% confluence in growth medium as described above. The growth medium was then aspirated and remaining cells were washed with 4°C phosphate-buffered saline (PBS) three times. The cells were dispersed from their culture dish using 0.25% Trypsin–ethylenediamine tetra-acetic acid (Sigma), transferred to a 15-mL universal tube and centrifuged at 92 g for 5 min at room temperature. After centrifugation again, the sediment was resuspended in 300 μL PBS and placed on glass slides with cytospin. Cells were then fixed in 4% paraformaldehyde for 10 min at room temperature, rinsed, and immersed in PBS. Spectra would be measured from the cells within 6 h of removal from the culture medium. 2.2.Study Patients and Tumor CollectionRecords were retrospectively reviewed of all patients with PC at the Department of Urology from February 2000 to June 2011, and the prostate specimens were retrieved from the Tissue Repository Facility of Department of Pathology. The study protocol has been approved by the Institutional Review Board and Research Ethical Board, Xi’an Jiaotong University. Patients with suspicion of PC gave written informed consent, and then received prostate needle biopsy guided by ultrasound and pathologic diagnosis. For treatment of advanced PC, combined androgen blockade (CAB, i.e., a combination of bicalutamide or flutamide with either bilateral orchiectomy or goserelin) was supplied to the 35 patients and single bilateral orchiectomy was offered to nine patients. Otherwise, six patients with localized PC but nodal invasion received radical retropubic prostatectomy combined with CAB. Subsequently, serum PSA was evaluated every 3 months during the first year and 6 months thereafter. The patients were selected in ADPC group if they had effective response to ADT which was recognized as decline of PSA level. Progression to CRPC was defined as three consecutive rises in PSA, resulting in two 50% increases over the nadir, with castrate serum levels of testosterone (testosterone ). Tissues of CRPC were available from 17 patients after transurethral resection of the prostate to release urinary obstruction and prostate needle biopsy guided by ultrasound. Since, the pathological stage was not available for all patients, time to CRPC progression was defined as the interval from initial of ADT to the first PSA rise. 2.3.Histopathology and Tissue ProcessingEach tissue was formalin fixed and paraffin embedded and consecutively cut into 4- and 10-μm parallel sections. All sections were placed on glass slides, warmed to just above the melting point (60°C) of paraffin. The 4-μm-thick sections were dewaxed with xylene and ethanol baths, then stained by hematoxylin & eosin (H&E) for subsequent pathological examination by two experienced pathologists under Olympus BX51 upright microscope. The 10-μm-thick sections, after being dewaxed in three washes of fresh xylene and ethanol,17,23 were subjected to RS analysis. Raman spectrum was acquired using corresponding regions marked as cancerous epithelial cells on the parallel H&E-stained tissue section. Pathologic staging was performed according to the 2009 TNM classification, and grading was done according to modified Gleason score.2,24 2.4.Instrumentation and Data PreprocessingRaman spectra data were recorded on a Labram HR 800 (Horiba Jobin Yvon). The laser beam was set at 17 mW with a 632.8 nm He-Ne laser radiation, and accurately focused on a spot on the surface of the sample. The cells and tissues were centered and photographed using objective magnifications, and measured using objectives. The acquisition period was 20 s, with a spectral resolution over a 700- to Raman shift range. Fifteen to twenty spectra was acquired from every tissue. The raw spectra were preprocessed by a first-order Savitsky–Golay filter for noise smoothing, and then a fifth-order polynomial was found to be optimal for fitting the autofluorescence background in the noise-smoothed spectrum. This polynomial was then subtracted from the noise-smoothed spectrum to yield the tissue Raman spectrum alone.15,16,25 2.5.Statistical AnalysisPrincipal component analysis (PCA) combined with support vector machine (SVM) in MATLAB7.1 (The Mathworks, Inc., Natick, Massachusetts) was used to develop a diagnostic algorithm for diagnosing and predicting CRPC within the data set. PCA is a data compression procedure that finds major trends within the spectral data set and redefines the data set using a small set of component spectra or principal components and scores.16 Then, SVM with a radial basis function kernel and a particle swarm optimization solver were applied to discriminate different groups in the form of their principal component scores. The spectra for each sample were averaged to give an overall spectrum for that sample. Then, leave-one-out cross-validation (LOOCV) was used to train and test PCA/SVM. In this procedure, an SVM model was initially built from the spectra of all except one spectrum. Then, the algorithm predicted the classification of omitted spectrum and stored the result. This procedure was repeated with each omitted spectrum in turn, leading to independent predictions per spectrum. For each predicted spectrum, a probability of prediction was calculated and expressed as a sensitivity and specificity for each group. Student’s test was performed at each Raman shift to compare the mean spectral intensities between different groups within the data set. values of were considered significant. Progression-free survival was calculated as the time between initial ADT and the date of progression to CRPC with the Kaplan–Meier technique and SPSS software, version 16.0 (SPSS, Chicago, Illinois). Median follow-up time was calculated by the inversed Kaplan–Meier technique and statistical significance was set at a value of . The diagnostic accuracy of the predictions was quantified by constructing a receiver operating characteristic (ROC) curve. This represented the relationship between sensitivity and specificity at different cutoff values of the probability. The integration area under the ROC curves for PCA/SVM was calculated, illustrating the efficacy of the diagnostic algorithms. 3.Results3.1.RS Could Predict the CRPC Cell AccuratelyA total of 49 and 50 spectra were obtained from androgen-dependent (LNCaP) and castration-resistant (C4-2) cells, respectively (Fig. 1). As compared with LNCaP, C4-2 showed higher intensities at 1126, 1171, and , while lower at 783, 1299, and . Black histogram in Fig. 1 presented the corresponding significance () of Raman spectral changes (e.g., Raman peak intensities, positions, and spectral band-widths broadening or narrowing) between C4-2 and LNCaP. PCA/SVM algorithm could predict the C4-2 cell with a sensitivity of 94.00% and a specificity of 95.92%. 3.2.RS Revealed the Raman Changes Between CRPC and ADPC Tissues, and Effectively Diagnosed CRPCAfter the removal of obviously heterogeneous spectra, 826 spectra from 50 enrolled patients were analyzed, including 17 patients with CRPC and 33 patients with ADPC (Table 1). Among these 17 patients of CRPC, specimens biopsied prior to ADT were available from nine patients (Table 2), and spectra were compared both before and after developing CRPC. Figure 2(a) illustrated mean spectrum of CRPC and ADPC tissues and corresponding significance of Raman spectral changes (e.g., Raman peak intensities, Raman peak positions and spectral band-widths broadening or narrowing). To further confirm the spectral changes, spectra from nine paired patients were compared both before and after their CRPC status [Fig. 2(b)]. The peaks at 1126 ( stretching of protein), 1170 (tyrosine), and 1447 ( deformation of protein; deoxyribose) were significantly increased in CRPC, while significant peaks in ADPC were 1315 to 1338 (tryptophane; adenine) (Refs. 15, 16, 22, and 25). This indicated that there was an increase or decrease in the percentage of a certain type of biomolecules relative to the total Raman-active constituents from ADPC to CRPC transformation. Figure 2(c) and 2(d) denoted the corresponding pathologic tissue with H&E stain. Table 1The characteristics of 50 patients with prostate cancer (PC).
Table 2The characteristics of nine paired patients in their ADPC and CRPC status.
BO: bilateral orchiectomy; B: bicalutamide; F: flutamide; G: goserelin; RP: retropubic prostatectomy. Fig. 2The mean spectrum of castration-resistant prostate cancer (CRPC) and androgen-dependent prostate cancer (ADPC) tissues in total (a), nine paired patients (b), and the corresponding significance ( value) of Student’s test along with the spectral axis (histogram). The corresponding pathologic tissues of CRPC and ADPC with hematoxylin & eosin (H&E) stain (c and d). A scatter plot of the spectra for CRPC and ADPC (e) used to develop the model projected onto a plane in a principal component.  Figure 2(e) was scatter plots of first principal component versus third principal component of Raman spectra to demonstrate distinctively spectral clustering for CRPC and ADPC, in which each of the spectra was represented by different color and different shape. It showed a significant classification in a two-dimensional coordinate system. PCA/SVM provided an overall sensitivity of 88.2% (15/17) and a specificity of 87.9% (29/33) for diagnosing CRPC. Since a Gleason score 8 to 10 of initial diagnosis correlated with CRPC progression,12,13 stratified analysis of spectra was, respectively, performed in Gleason score 8 to 10 and Gleason score groups to remove cross-interaction of pathological grading. Table 3 presented stratified sensitivity and specificity for different Gleason score groups. Table 3The accuracy of prediction through PCA/SVM.
3.3.RS Prognosed the Progression Interval from ADPC to CRPCFor the 33 patients with ADPC, there was at least 12 months follow-up after initial ADT. Fourteen patients progressed to CRPC within 12 months. The patients were divided into progression and nonprogression groups depending on whether their cancer progressed to CRPC within 12 months. Figure 3(a) showed the mean spectrum of progression and nonprogression groups, however, very slight spectral changes were observed at 1207 (phenylalanine, tyrosine) and 1247 (amide III of protein; thymine) which corresponded to the changes of biomolecules in progression to CRPC (Refs. 15, 16, 22, and 25). From the PCA, the first and second principal components scores separated the two groups. A scatter plot of these principal components was shown in Fig. 3(b). The PCA/SVM diagnostic model could detect the progression to CRPC with a sensitivity of 85.7% (12/14), a specificity of 88.9% (16/19), a positive predictive value of 80% (12/15), and a negative predictive value of 78% (16/18). Fig. 3The mean spectrum of progression and nonprogression groups (a) and the corresponding significance ( value) of Student’s test along with the spectral axis (histogram). A scatter plot of the spectra for progression and nonprogression groups (b) used to develop the model projected onto a plane in principal component.  Furthermore, the patients were separated into two groups depending on whether the patients were prognosed progression to CRPC by RS. Fifteen patients were predicted as progression to CRPC by RS and 18 were not. The overall median progression-free interval was 13.5 months. By using log-rank test, there was a significant difference in progression-free survival between these two groups [, Fig. 4(a)]. To further evaluate the performance of the PCA/SVM algorithms together with the LOOCV method, the ROC curve [Fig. 4(b)] was also generated. The areas under the ROC curve for CRPC and ADPC and progression and nonprogression groups were 0.920 and 0.903, respectively, confirming that the PCA/SVM diagnostic model was powerful for clinical diagnosis at the molecular level. Fig. 4Kaplan–Meier curve (a) of progression-free survival rates for patients who were prognosed progression to CRPC by Raman spectroscopy (RS) () or not () (). Receiver operation characteristic (ROC) curve (b) representing the accuracy of RS discrimination with PCA/SVM. The areas under the curve for CRPC–ADPC and progression and nonprogression groups were 0.920 and 0.903.  4.DiscussionThe multistep carcinogenesis of prostate epithelia initially manifest as an androgen-dependent organ-confined cancer then progress to metastatic, castration resistant phenotype. PC cells encompass many genetic and epigenetic changes in epithelial cells as well as surrounding microenvironment.20 Currently, many mechanisms with a wide spectrum of molecular alterations have been identified for the onset of CRPC.26–28 However, due to the heterogeneity of PC, a single gene or protein marker was not likely to identify CRPC with a great accuracy based on clinical experience. RS is a well-established quantifiable optical technique with excellent reproducibility, and its spectrum might provide information in identifying structural changes of molecule. Each molecule had its own pattern of vibration that could serve as a “Raman biomarker.”18 RS had been used to accurately identify benign prostate hyperplasia and PC tissues, otherwise, heterogenetic cell lines (LNCaP, CaP2b, PC-3, and DU-145) with significant biochemical differences were applied in their research,19,29 but whether RS could identify congelleric CRPC and ADPC cells and tissues in vivo was still confusing. We used the classic LNCaP/C4-2 cells as cell model which mimicked closely the natural history from ADPC to CRPC (Ref. 20), then selected and matched the PC samples with coincident Gleason score to reduce the intrinsic interference. Notably, spectra of the nine paired patients presented more reliable results in vitro. We compared the spectral changes between CRPC and ADPC in both cell and tissue models. It revealed the corresponding spectral changes reflected structural changes of protein or DNA, concomitant with the alteration of amino acid and basic radical. Depending on these changes of conformation or component in some biomolecules, PCA/SVM effectively identified CRPC and ADPC. However, these spectral changes only represented partial information of the biomacromolecules, such as the level of secondary protein structure. Further, molecular biological studies were needed to determine the mechanism of these alterations. Gleason score 8 to 10, achieving nadir PSA level, and time to PSA nadir after ADT might correlate with the progression to CRPC in many retrospective analyses.8–13 However, nadir PSA level and time to PSA nadir were unpredictable in initial diagnosis, and Gleason score was nonspecific for CRPC. It was known that androgen ablation provided a selective advantage to androgen-refractory cells that grow and eventually comprise most of the tumor.2 Assuming that ADT effectively targeted the androgen-sensitive population of PC cells, an incomplete and sluggish response or short-term progression to CRPC was evidence of significant androgen-refractory population.2 Thirty-three patients with ADPC were followed-up after initial ADT. We separated these patients into progression and nonprogression groups depending on whether their cancers progressed within 12 months. Slight spectral changes were observed, and PCA/SVM could prognose whether ADPC would progress to CRPC within 12 months accurately. We further separated the patients into two groups depending on whether the patients were prognosed progression to CRPC by RS, then compared the progression-free survival between them. A significant difference was detected by log-rank test, illustrating the efficacy of RS together with PCA/SVM algorithms for prognosing CRPC. However, the experiment must be expanded to make a more detailed stratification of time to CRPC and ensure RS was available and reproducible in clinical practice. Another prospective work is ongoing to increase the sample size and follow-up interval and also to predict survival besides CRPC through this trained algorithm. Vibrational spectroscopy, both Raman and infrared (IR) imaging, are the prominent approaches to sense specific types of molecules or otherwise resolve the chemical species and morphologic structures.30 Bhargava groups31,32 coupled the IR with statistic pattern recognition of spectra to differentiate benign from malignant prostatic epithelium and the IR classified image was accurately overlaid with the H&E-stained image which had the potential of assessing the margin of cancerous tissues in surgery in real time. At the same time, the PC cells and tissues could be predicted according to different Gleason grade and tumor stage by the IR (Refs. 33 and 34). While each technology promises a specific measurement for specific situations, IR spectroscopic imaging provides a rapid and simultaneous fingerprinting of inherent biologic content, yet Raman spectroscopic imaging permits a high spatial resolution and could be applied in aqueous environments.35 Hence, a careful matching of vibrational spectroscopy to the clinical application could lead to useful protocols. Vibrational spectroscopic imaging directly provides the molecular descriptors, but also helps the pathologists make better diagnosis.35 Nevertheless, there are two possible limitations of this study. First, overall sample number was not large enough and population with Gleason score was not collected to demonstrate the difference between CRPC and ADPC. Because ultrastructural differences related to androgen-dependent or androgen-refractory state of cells or tissues could be detected by RS, we inferred that RS could gain similar results. Second, we used paraffin-embedded tissues for Raman analysis, therefore the influence of residual wax on RS cannot be ruled out completely. Although these tissues were dewaxed in three washes of fresh xylene and ethanol baths, slight Raman signals at 1062 and originated from residual wax have been documented.36,37 In this case, snap-freezing tissue sections could be a good alternative source for this application. AcknowledgmentsThe authors thank Professor Leland W.K. Chung at Cedars-Sinai Medical Center, Los Angeles, USA, for provision of C4-2 cells, Dr. Quan-li Wang at Department of Epidemiology and Health Statistics, Xi’an Jiaotong University College of Medicine, China, for the help with statistical analysis, Professor Victor K. Lin at Department of Urology, University of Texas Southwestern Medical Center, USA, for his excellent job critically revising this manuscript. Funding: National Natural Science Foundation of China (No. 30701009) and National Basic Research Program of China (973 Program, No. 2009CB526408). ReferencesB. K. Edwardset al.,
“Annual report to the nation on the status of cancer, 1975–2006, featuring colorectal cancer trends and impact of interventions (risk factors, screening, and treatment) to reduce future rates,”
Cancer, 116
(3), 544
–573
(2010). http://dx.doi.org/10.1002/cncr.v116:3 60IXAH 0008-543X Google Scholar
A. Heidenreichet al.,
“EAU guidelines on prostate cancer,”
Eur. Urol., 53
(1), 68
–80
(2008). http://dx.doi.org/10.1016/j.eururo.2007.09.002 EUURAV 0302-2838 Google Scholar
E. D. Crawfordet al.,
“A controlled trial of leuprolide with and without flutamide in prostatic carcinoma,”
N. Engl. J. Med., 321
(7), 419
–424
(1989). http://dx.doi.org/10.1056/NEJM198908173210702 NEJMAG 0028-4793 Google Scholar
M. A. Eisenbergeret al.,
“Bilateral orchiectomy with or without flutamide for metastatic prostate cancer,”
N. Eng. J. Med., 339
(15), 1036
–1042
(1998). http://dx.doi.org/10.1056/NEJM199810083391504 NEJMBH 0028-4793 Google Scholar
L. J. Deniset al.,
“Maximal androgen blockade: final analysis of EORTC phase III trial 30853. EORTC Genito-Urinary Tract Cancer Cooperative Group and the EORTC Data Center,”
Eur. Urol., 33
(2), 144
–151
(1998). http://dx.doi.org/10.1159/000019546 EUURAV 0302-2838 Google Scholar
I. F. Tannocket al.,
“Docetaxel plus prednisone or mitoxantrone plus prednisone for advanced prostate cancer,”
N. Engl. J. Med., 351
(15), 1502
–1512
(2004). http://dx.doi.org/10.1056/NEJMoa040720 NEJMAG 0028-4793 Google Scholar
D. P. Petrylaket al.,
“Docetaxel and estramustine compared with mitoxantrone and prednisone for advanced refractory prostate cancer,”
N. Engl. J. Med., 351
(15), 1513
–1520
(2004). http://dx.doi.org/10.1056/NEJMoa041318 NEJMAG 0028-4793 Google Scholar
C. Kwaket al.,
“Prognostic significance of the nadir prostate specific antigen level after hormone therapy for prostate cancer,”
J. Urol., 168
(3), 995
–1000
(2002). http://dx.doi.org/10.1016/S0022-5347(05)64559-4 JOURAA 0022-5347 Google Scholar
S. P. Huanget al.,
“Impact of prostate-specific antigen (PSA) nadir and time to PSA nadir on disease progression in prostate cancer treated with androgen-deprivation therapy,”
Prostate, 71
(11), 1189
–1197
(2011). http://dx.doi.org/10.1002/pros.v71.11 69FWUC 0270-4137 Google Scholar
R. D. Maliket al.,
“Three-year postoperative ultrasensitive prostate-specific antigen following open radical retropubic prostatectomy is a predictor for delayed biochemical recurrence,”
Eur. Urol., 60
(3), 548
–553
(2011). http://dx.doi.org/10.1016/j.eururo.2011.05.036 EUURAV 0302-2838 Google Scholar
A. Billiset al.,
“The impact of the 2005 international society of urological pathology consensus conference on standard Gleason grading of prostatic carcinoma in needle biopsies,”
J. Urol., 180
(2), 548
–552
(2008). http://dx.doi.org/10.1016/j.juro.2008.04.018 JOURAA 0022-5347 Google Scholar
E. A. BenaimC. M. PaceC. G. Roehrborn,
“Gleason score predicts androgen independent progression after androgen deprivation therapy,”
Eur. Urol., 42
(1), 12
–17
(2002). http://dx.doi.org/10.1016/S0302-2838(02)00238-5 EUURAV 0302-2838 Google Scholar
T. Uesugiet al.,
“Primary Gleason grade 4 impact on biochemical recurrence after permanent interstitial brachytherapy in Japanese patients with low- or intermediate-risk prostate cancer,”
Int. J. Radiat. Oncol. Biol. Phys., 82
(2), e219
–e223
(2012). http://dx.doi.org/10.1016/j.ijrobp.2011.04.018 IOBPD3 0360-3016 Google Scholar
P. Crowet al.,
“The use of Raman spectroscopy to identify and characterize transitional cell carcinoma in vitro,”
BJU Int., 93
(9), 1232
–1236
(2004). http://dx.doi.org/10.1111/bju.2004.93.issue-9 BJINFO 1464-410X Google Scholar
B. W. de Jonget al.,
“Discrimination between nontumor bladder tissue and tumor by Raman spectroscopy,”
Anal. Chem., 78
(22), 7761
–7769
(2006). http://dx.doi.org/10.1021/ac061417b ANCHAM 0003-2700 Google Scholar
R. O. Dragaet al.,
“In vivo bladder cancer diagnosis by high-volume Raman spectroscopy,”
Anal. Chem., 82
(14), 5993
–5999
(2010). http://dx.doi.org/10.1021/ac100448p ANCHAM 0003-2700 Google Scholar
A. Shapiroet al.,
“Raman molecular imaging: a novel spectroscopic technique for diagnosis of bladder cancer in urine specimens,”
Eur. Urol., 59
(1), 106
–112
(2011). http://dx.doi.org/10.1016/j.eururo.2010.10.027 EUURAV 0302-2838 Google Scholar
K. Bensalahet al.,
“Raman spectroscopy: a novel experimental approach to evaluating renal tumours,”
Eur. Urol., 58
(4), 602
–608
(2010). http://dx.doi.org/10.1016/j.eururo.2010.06.002 EUURAV 0302-2838 Google Scholar
P. Crowet al.,
“The use of Raman spectroscopy to differentiate between different prostatic adenocarcinoma cell lines,”
Br. J. Cancer, 92
(12), 2166
–2170
(2005). http://dx.doi.org/10.1038/sj.bjc.6602638 BJCAAI 0007-0920 Google Scholar
G. N. Thalmannet al.,
“Androgen-independent cancer progression and bone metastasis in the LNCaP model of human prostate cancer,”
Cancer Res., 54
(10), 2577
–2581
(1994). CNREA8 0008-5472 Google Scholar
D. Zhanget al.,
“PrLZ protects prostate cancer cells from apoptosis induced by androgen deprivation via the activation of Stat3/Bcl-2 pathway,”
Cancer Res., 71
(6), 2193
–2202
(2011). http://dx.doi.org/10.1158/0008-5472.CAN-10-1791 CNREA8 0008-5472 Google Scholar
F. Drauxet al.,
“Raman spectral imaging of single cancer cells: probing the impact of sample fixation methods,”
Anal. Bioanal. Chem., 397
(7), 2727
–2737
(2010). http://dx.doi.org/10.1007/s00216-010-3759-8 ABCNBP 1618-2642 Google Scholar
F. M. Lynget al.,
“Vibrational spectroscopy for cervical cancer pathology, from biochemical analysis to diagnostic tool,”
Exp. Mol. Pathol., 82
(2), 121
–129
(2007). http://dx.doi.org/10.1016/j.yexmp.2007.01.001 EXMPA6 0014-4800 Google Scholar
J. I. Epsteinet al.,
“The 2005 International Society of Urologic Pathology (ISUP) consensus conference on Gleason grading of prostatic carcinoma,”
Am. J. Surg. Pathol., 29
(9), 1228
–1242
(2005). http://dx.doi.org/10.1097/01.pas.0000173646.99337.b1 AJSPDX 0147-5185 Google Scholar
M. S. Bergholtet al.,
“In vivo diagnosis of gastric cancer using Raman endoscopy and ant colony optimization techniques,”
Int. J. Cancer, 128
(11), 2673
–2680
(2011). http://dx.doi.org/10.1002/ijc.v128.11 IJCNAW 1097-0215 Google Scholar
S. HaldarA. BasuC. M. Croce,
“Bcl-2 is the guardian of microtubule integrity,”
Cancer Res., 57
(2), 229
–233
(1997). CNREA8 0008-5472 Google Scholar
A. M. Stapletonet al.,
“Primary human prostate cancer cells harboring p53 mutations are clonally expanded in metastases,”
Clin. Cancer Res., 3
(8), 1389
–1397
(1997). CCREF4 1078-0432 Google Scholar
M. J. Linjaet al.,
“Amplification and overexpression of androgen receptor gene in hormone-refractory prostate cancer,”
Cancer Res., 61
(9), 3550
–3555
(2001). CNREA8 0008-5472 Google Scholar
P. Crowet al.,
“The use of Raman spectroscopy to identify and grade prostatic adenocarcinoma in vitro,”
Br. J. Cancer, 89
(1), 106
–108
(2003). http://dx.doi.org/10.1038/sj.bjc.6601059 BJCAAI 0007-0920 Google Scholar
R. KongR. K. ReddyR. Bhargava,
“Characterization of tumor progression in engineered tissue using infrared spectroscopic imaging,”
Analyst, 135
(7), 1569
–1578
(2010). http://dx.doi.org/10.1039/c0an00112k ANLYAG 0365-4885 Google Scholar
D. C. Fernandezet al.,
“Infrared spectroscopic imaging for histopathologic recognition,”
Nat. Biotechnol., 23
(4), 469
–474
(2005). http://dx.doi.org/10.1038/nbt1080 NABIF9 1087-0156 Google Scholar
J. T. Kwaket al.,
“Multimodal microscopy for automated histologic analysis of prostate cancer,”
BMC Cancer, 11
(1), 62
(2011). http://dx.doi.org/10.1186/1471-2407-11-62 BCMACL 1471-2407 Google Scholar
T. J. Harveyet al.,
“Discrimination of prostate cancer cells by reflection mode FTIR photoacoustic spectroscopy,”
Analyst, 132
(4), 292
–295
(2007). http://dx.doi.org/10.1039/b618618a ANLYAG 0365-4885 Google Scholar
E. Gaziet al.,
“A correlation of FTIR spectra derived from prostate cancer biopsies with gleason grade and tumour stage,”
Eur. Urol., 50
(4), 750
–760
(2006). http://dx.doi.org/10.1016/j.eururo.2006.03.031 EUURAV 0302-2838 Google Scholar
R. Bhargava,
“Towards a practical Fourier transform infrared chemical imaging protocol for cancer histopathology,”
Anal. Bioanal. Chem., 389
(4), 1155
–1169
(2007). http://dx.doi.org/10.1007/s00216-007-1511-9 ABCNBP 1618-2642 Google Scholar
E. Ó. Faoláinet al.,
“Raman spectroscopic evaluation of efficacy of current paraffin wax section dewaxing agents,”
J. Histochem. Cytochem., 53
(1), 121
–129
(2005). http://dx.doi.org/10.1177/002215540505300114 JHCYAS 0022-1554 Google Scholar
F. L. Martinet al.,
“Distinguishing cell types or populations based on the computational analysis of their infrared spectra,”
Nat. Protoc., 5
(11), 1748
–1760
(2010). http://dx.doi.org/10.1038/nprot.2010.133 NPARDW 1750-2799 Google Scholar
|
|||||||||||||||||||||||||||||||||||||||||||||||||||||||||||||||||||||||||||||||||||||||||||||||||||||||||||||||||||||||||||||||||||||||||||||||||||||||||||||||||||||||||||