
|
|
1.IntroductionProstate cancer is the most frequently diagnosed malignancy in American men. It is the second-leading cause of death, with one in six men having a lifetime risk of diagnosis; however, the therapeutic success rate for prostate cancer is significantly improved by early detection. Over the past three decades, prostate-specific antigen (PSA), a 237 amino acid, 33 kDa, extracellular serine protease, has been used extensively as a serum biomarker to screen for prostate cancer and follow therapeutic responses. In the normal prostate, high concentrations of active PSA are stored in the prostatic collecting ducts1–4 with only small quantities leaking out and forming complexes with its inhibitor, alpha-1 anti-chymotrypsin (ACT), to generate the low nanogram/milliliter levels measured in circulation.5 Prostate cancer cells disrupt this normal tissue architecture resulting in the leakage of increased amounts of PSA into the tissue interstitium and into the circulation, and it has been shown that enzymatically active PSA confers an enhanced growth rate to human prostate cancer cells, indicating a causal role in prostate cancer progression.6 The PSA serum test is simple and inexpensive, and it has been a valuable tool in the detection, staging, and monitoring of prostate cancer. However, the PSA assay has always had a disadvantage in that it is not very specific, detecting common pathological conditions such as benign prostatic hyperplasia (BPH) and prostatitis. Furthermore, in the past decade, the usefulness of PSA as a screening biomarker has become an even more controversial topic with the publication of the results of the Prostate Cancer Prevention Trial (2004) reporting that PSA levels of or less—levels generally thought to be in the normal range—were not rare among the 2950 men with biopsy-detected prostate cancer, including high-grade cancers.7 This has led to increased research using other prostate cancer biomarkers including free PSA, alternative screening tests (transrectal ultrasound), and newer diagnostic antigens, including prostate-specific membrane antigen and prostate cancer antigen 3. The deficiencies in current prostate cancer biomarkers are particularly evident at the level of monitoring disease progression and the outcome of clinical intervention, warranting exploration of new targets and/or methodologies. As an alternative biomarker approach for prostate cancer, we developed a new near–infrared (NIR) imaging agent focusing on the enzymatic activity of PSA rather than its presence as a protein biomarker in circulation. To do this, we designed an activatable NIR imaging agent, PSA750 FAST™ (PSA750), using a quenched substrate that can be selectively cleaved (thus activated) by enzymatically active PSA. The traditional PSA serum assay relies on testing for the presence of total serum PSA (which is mostly inactive and complexed), but the more biologically relevant, enzymatically active PSA is present at elevated levels only in prostate tumors. Because of this, PSA750 offers the potential to selectively detect abnormal levels of PSA produced at the source (i.e., in prostate cancer and metastases) with no detection of passively leaking or circulating (inactive) PSA. The combination of this agent with fluorescence tomography allows the noninvasive in situ detection and quantification of prostate tumor progression. For these studies, specific tumor targeting in and tumor-bearing mice was assessed in real time and noninvasively by fluorescence tomographic imaging. The specificity of the agent was validated using its specific inhibitor in ex vivo binding studies. 2.Materials and Methods2.1.Synthesis and Characterization of Fluorogenic PSA FAST AgentsA nine amino acid oligopeptide substrate based on a known PSA-cleavable tetrapeptide sequence, Chg-Gln-Ser-Ser,8 was purchased as the trifluoroacetic acid salt from Tufts Core Facility, Boston, MA. VivoTag-S 750 was obtained from PerkinElmer, Inc. (Waltham, MA). All chemicals were used as purchased without further purification. To generate a fluorophore quenched PSA substrate sequence, the N-Ac oligopeptide () was dissolved in 1 mL -dimethyl formamide (DMF) containing 10 μL of triethylamine. A solution of VivoTag-S 750 () in 2 mL of anhydrous DMF was added and stirred for 30 min at ambient temperature in the dark. Purification was carried out by preparative high-performance liquid chromatography (HPLC) using a Varian system and a Phenomenex Jupiter Phenylhexyl column (10 μm, , ) to give the fluorophore labeled oligopeptide. The incorporation of two fluorophores per oligopeptide was confirmed by electrospray mass spectrometry on a single quadrupole Waters ZQ: calculated: 2274; found: 1138 1/2 . As a labeled oligopeptide alone would not have the desired pharmacokinetic properties in vivo, a chemical modification was made to increase circulation half-life. Briefly, the labeled oligopeptide () was dissolved in 6 mL of DMF containing the pharmacokinetic modifier (PKM) amine (40 kDa polyethylene glycol, 12 μmol), -hydroxybenzotriazole (13 μmol), and -methylmorpholine (14 μmol). To the solution was added 1-ethyl 3-[(3-dimethylamino) propyl] carbodiimide hydrochloride (13 μmol) and the solution was stirred for 40 min at ambient temperature in the dark. The product was purified by an anion exchange column (Q-Sepharose Fast Flow anion exchange gel, 10 mL bed volume) and the desired fractions were pooled, lyophilized, and stored at . UV–visible absorbance and fluorescence emission spectra of the native and enzyme activated agent were recorded on Cary 50 and Cary Eclipse spectrophotometers, respectively, in PBS using 740 nm for fluorescence excitation. For this, 5 μM of PSA750 was cleaved in the presence of 1 μM activated PSA for 6 h in a final volume of 250 μL 50 mM Tris, pH 8, and 1 M NaCl. PSA was preactivated by Thermolysin ( for 5 min in 50 mM Tris, 10 mM , 150 mM NaCl, 0.05% Brij-35, pH 7.5) and the reaction stopped by the addition of 1,10-Phenanthroline (20 mM final). The proteolysis of the oligopeptide substrate at the anticipated cleavage site was confirmed by electrospray mass spectrometry on a single quadrupole Waters ZQ: calculated mass of fragment A: 1607.6 Da; found: 803 Da . 2.2.Cell Lines and ReagentsHuman prostate carcinoma LNCaP () and human grade IV prostate adenocarcinoma prostate cancer 3 (PC3) () cells (ATCC, Manassas, VA) were grown in RPMI-1640 medium containing 10% heat-inactivated fetal calf serum at 37°C in a humidified atmosphere containing 5% . 2.3.In Vitro Enzymatic ActivationIn vitro activation of PSA750 was carried out in a final concentration of 0.1 μM of each enzyme and 0.5 μM PSA750 at the optimal buffer and pH conditions for each individual enzyme. Recombinant human PSA, Kallikrein I, Kallikrein II, u-plasminogen activator/urokinase and cathepsin B (CatB) were purchased from R&D Systems (Minneapolis, MN), and MMP-9, MMP-12, MMP-13, human plasma alpha-1 ACT, chymotrypsin, and thrombin were purchased from Calbiochem. Enzymatic reactions were carried out in buffers recommended by manufacturers, at room temperature in 250 μl in 96-well plates with black sides and bottom in recommended buffers. PSA was preactivated by Thermolysin (R&D Systems) and 1,10-Phenanthroline (Sigma, St. Louis, MO) was used to stop the Thermolysin activity. All the reactions were monitored at various time points at excitation/emission wavelengths of using a fluorescence plate reader (Molecular Devices, San Leandro, CA). The released fluorescence is shown after subtracting background fluorescence of the agent without enzyme. 2.4.PharmacokineticsTwenty-four female retired breeder BALB/c mice (age 12 to 16 weeks, Charles River Laboratories, Wilmington, MA) were injected intravenously (i.v.) with 2 nmol PSA750 in PBS. Terminal blood samples () were collected by cardiac puncture from each mouse (following carbon dioxide asphyxiation) in ethylenediamine tetra-acetic acid-containing tubes and plasma was obtained by centrifugation (15,000 rpm for 10 min at 4°C). Fifty microliters of each plasma sample was mixed with 150 μL cold methanol, centrifuged (12,000 rpm, 4°C, 10 min), and supernatants were analyzed by HPLC. 2.5.Agent Characterization by HPLCHPLC analyses were performed on a Waters model 2695 (Waters Corporation, Milford, MA). The PDA, Waters model 2998, was set to scan from 225 to 800 nm. The wavelength corresponding to the absorbance maximum of the fluorophore, 750 nm, was extracted from the PDA trace. Samples were analyzed on a C4, , 5 μm, HPLC column (Phenomenex, Torrance, CA). The aqueous mobile phase contained 25 mM ammonium formate. Samples were eluted with acetonitrile at a flow rate of . An organic phase of 0.1% formic acid in methanol was used to elute native plasma proteins during the run. A gradient of 15% to 75% organic provided sufficient resolution. Standards were prepared with PSA750 (0 to 1 μM) in mouse plasma. Standard curves had correlation coefficients . 2.6.Prostate Tumor ModelsTwo tumor models were used in these studies: PSA positive LNCaP and PSA negative PC3 human prostate carcinoma xenografts. Male Nu/Nu mice (age 6 to 8 weeks, Charles River Laboratories, Wilmington, MA) were injected subcutaneously (s.c.) in the upper chest region with tumor cells. Mice were housed in environmentally controlled specific-pathogen free conditions with water and low-fluorescence mouse chow (Harlan Teklad, Madison, WI). All animal experimental procedures were approved by PerkinElmer’s Institutional Animal Care and Use Committee and in accordance with veterinarian requirements. When tumors reached the desired volume, as measured by calipers (), mice were injected i.v. with 2 nmol of PSA750 and imaged by FMT (FMT™ 4000, PerkinElmer Inc., Waltham, MA) at various time points. 2.7.PSA750 Activation in Tumor SectionsTo validate the specificity of PSA750 activation by active PSA present in tumors, LNCaP tumor-bearing mice were euthanized by inhalation and tumors were removed and snap frozen in OCT. Five micrometer tumor sections were incubated with 5 μM PSA750 in the absence or presence of ACT (5 μM) at 37°C in a humidified incubator for 30 min. Slides were viewed on a Zeiss Axioskop2 fluorescence microscope with a Hammamatsu Orca RC monochromatic camera using PerkinElmer’s Volocity software. Cell nuclei were visualized using a DAPI nuclear counterstain. 2.8.In Vivo Fluorescence Molecular TomographyMice imaged by FMT (FMT® 4000, PerkinElmer, Inc., Waltham, MA) were first anesthetized by gas anesthesia (isoflurane/oxygen mixture), placed in the FMT 4000 system imaging chamber (equipped with gas anesthesia), one at a time, and imaged. Images were analyzed using TrueQuant software (PerkinElmer Inc., Boston, MA) by drawing three-dimensional (3-D) regions of interests (ROIs) around tumor regions and an adjoining background area, and using a threshold equal to 30% of the mean value of fluorescence in the background. The total amount (in pmol) of fluorochrome was automatically calculated relative to internal standards generated with known concentrations of the appropriate dye (VivoTag-S 750). Quantification accuracy of the FMT system has been described previously.9,10 2.9.Organ DistributionImmediately following imaging, a cohort of mice was sacrificed (, experiment repeated twice), organs excised, and imaged in epifluorescence mode using the FMT 4000. The mean fluorescence intensity was measured after drawing an ROI around each organ. No threshold was applied. Data are expressed as mean fluorescence (in counts/energy). 2.10.Tissue LocalizationLNCaP tumor-bearing mice were injected i.v. with 10 nmol of agent. Twenty four hours later, mice were injected with Hoechst 33342 (Life Technologies, Grand Island, NY). Five minutes later, mice were sacrificed, and tumors were excised, and snap frozen in OCT. Ten micron sections was prepared and slides were viewed on a Zeiss Axioskop2 microscope with a Hammamatsu Orca RC monochromatic camera using PerkinElmer’s Volocity software. 3.Results3.1.Synthesis and Characterization of PSA750The fluorogenic agent PSA750 consists of an oligopeptide substrate sequence comprising seven amino acids containing a Chg-Gln-Ser-Ser tetrapeptide moiety, and flanked by two lysines at both the C-terminus and the N-terminus. Each of the two lysines was linked at the amino group on the side chain to VivoTag-S 750, an NIR fluorochrome, resulting in a self-quenched agent. To optimize the plasma half-life of the agent for in vivo imaging applications, the substrate was further conjugated to a 40 kDa polyethylene glycol PKM at the C-terminus at a ratio of one substrate per polymer molecule [Fig. 1(a)]. The product has a MW of and was characterized by reversed phase HPLC to be pure at 750 nm. Confirmation of the cleavage site between Q and S amino acid residues was achieved by mass spectral analysis of PSA-cleaved fragments, as described in Sec. 2: calculated mass of fragment A: 1607.6 Da; found: 803 Da . Fig. 1Design and optical characteristics of PSA750. (a) The fluorogenic peptide substrate containing a Gln-Ser cleavage site is conjugated to a pharmacokinetic modifier (PKM) and flanked by two NIR fluorophores. Upon cleavage of the peptide by active PSA, the fluorophores become fluorescent. (b) Absorbance spectra of the PSA-activated fluorescent form (gray line) shows a bathochromic shift in the absorbance maximum relative to the native autoquenched state (black line). (c) The fluorescence emission is increased more than 18-fold upon proteolytic activation with a maximum at 770 nm.  Compared to the absorbance maximum of VivoTag-S 750, a hypsochromic shift was observed in the absorbance maximum of the nonactivated agent ( at 684 nm and an in ) reflecting static, groundstate quenching of the two fluorochromes [Fig. 1(b)]. Measurement of fluorescence at 770 nm indicated quenching in the nonactivated form. Upon cleavage with active PSA, an 18-fold increase in fluorescence was detected while the absorption shifted to 750 nm, , similar to that of the starting fluorophore [Fig. 1(c)]. PSA750 was found to be stable in the presence of mouse plasma over a period of 24 h, as assessed by HPLC (data not shown). 3.2.In Vitro Enzyme AssaysThe main objective of developing a PSA-activatable agent was to target enzymatically active PSA over inactive or bound PSA as well as other disease-relevant enzymes. The in vitro specificity of PSA750 toward PSA is illustrated in Fig. 2. Activation of PSA750 by PSA was blocked in vitro by prior complexing with alpha-1 ACT, a known natural inhibitor of PSA, indicating the specificity of the agent. PSA750 is activated more effectively when compared to other cancer- and inflammation-relevant enzymes such as MMPs 12 ( at 24 h, at all other time points) and 13 ( at 24 h, at all other time points), chymotrypsin (comparable values at 1 min at 24 h, at other times), kallikreins, and thrombin (comparable values at 1 min, at 24 h, at other times). The kinetics of PSA750 activation reveal that a fluorescent signal is released as early as 1 min after addition of the enzyme, with peak fluorescence seen at around 6 h. The very low-level signal seen with MMP-12 and chymotrypsin required 24 h for effective measurement. Fig. 2PSA750 is activated several-fold by active PSA when compared to other disease-relevant enzymes. The agent (0.5 μM) was activated in vitro by a panel of enzymes (0.1 μM) in optimized buffers and pH for each enzyme and the fluorescence monitored up to 24 h in a fluorescence microplate reader. Released fluorescence was obtained by subtracting the fluorescence of agent only from that of the PSA750 in the presence of enzymes. PSA complexed with it natural inhibitor, ACT, does not cleave the agent. 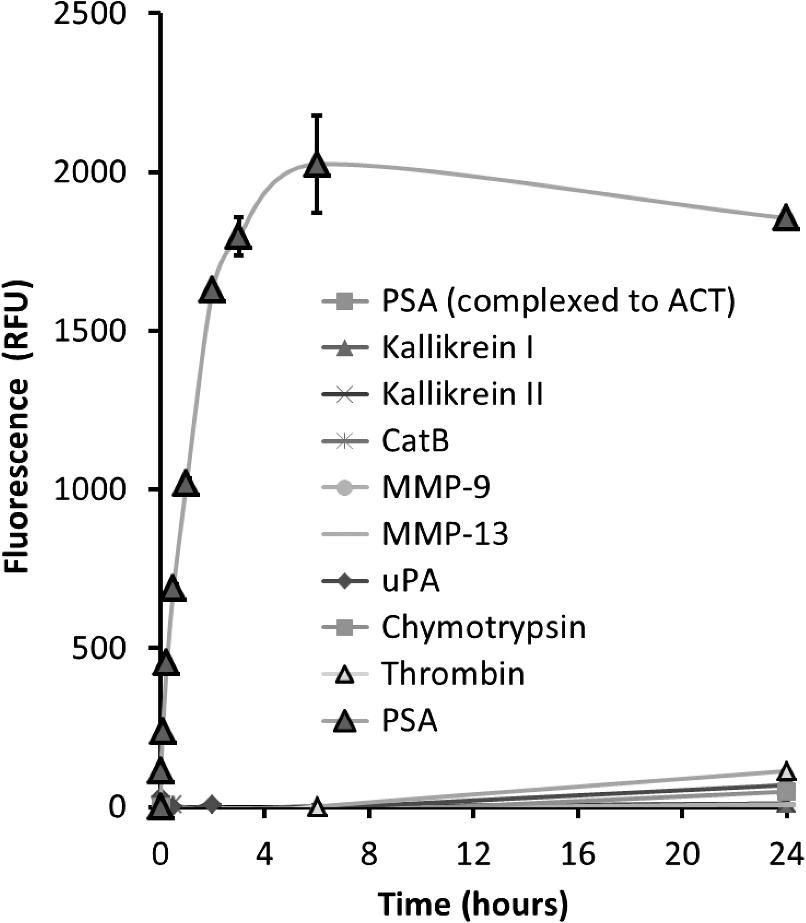 3.3.Ex Vivo Tissue ActivationActivation of PSA750 was tested in tumor tissue samples excised from tumor-bearing nude mice (Fig. 3). PSA positive LNCaP tumor slices (5 μm) displayed activation of PSA750 after incubation in a 5 μM solution of the agent. PSA750-associated fluorescence was also inhibited when adjacent tumor slices were incubated with an equal concentration of ACT. Fig. 3Effect of ACT on the activation of PSA750 ex vivo in tumor sections. LNCaP tumor-bearing mice were sacrificed and tumors excised and snap frozen. PSA activity was assessed in situ by incubating tumor sections (5 μm thick) with 5 μM PSA750 at 37°C for 30 min in the absence or presence of the PSA inhibitor ACT (5 μM). Fluorescent microscopy images were captured with a microscope equipped with a xenon light source and Cy7 filters. Shown are representative images at a final magnification. In light gray, DAPI nuclear stain; bright stain, activated PSA750.  3.4.Pharmacokinetics and Organ DistributionTo determine the optimal in vivo imaging time point, kinetic imaging, and blood pharmacokinetic studies were performed. In a preliminary imaging study, five tumor-bearing mice were imaged at 6 and 24 h post-agent injection. The mean fluorescence of the tumors and background area were quantified. At 6 h, there was no statistically significant difference between the tumor and background signals (), although there was a 3.12 tumor to background ratio. At 24 h, however, the ratio increased to 7.54 and there was a statistically significant difference between tumor and background signals (). An additional study [Fig. 4(a)] assessing tumor fluorescence over time, from 24 to 168 h, allowed determination of the clearance kinetics. Mouse plasma levels of PSA750 were measured by HPLC [Fig. 4(a)], which detects the intact parent molecule. The plasma half-life was determined to be 2 h, with remaining in plasma at 24 h, confirming this as the earliest optimal time point for in vivo imaging. Tissue clearance [Fig. 4(a)] and organ distribution of fluorescence [Fig. 4(b)] were also measured in LNCaP tumor-bearing mice at 24 h. This assessment provides useful data with regard to understanding the PSA750 tumor versus other potential sites of interfering signal at the time of optimal tumor imaging. High fluorescence in the bladder indicates mostly renal clearance. From in vivo and ex vivo tumor fluorescence measurements, it was determined that the tissue half-life of PSA750 was approximately 2 days, with full clearance by day 7. Fig. 4Plasma half-life and bio-distribution of PSA750. (a) LNCaP tumor-bearing mice were injected with 2 nmol of PSA750 and imaged at different times thereafter by FMT. CD-1 mice were injected i.v. with 2 nmol PSA750 and blood was collected at different times. Plasma was prepared and analyzed by HPLC (inset). Pharmacokinetic and pharmacodynamics profiles of PSA750 show a plasma half-life of 2 h, while in vivo tumor imaging reveals a the tissue fluorescence half-life of PSA750 is approximately 2 days, with full clearance by 7 days. This allows weekly repeat imaging. (b) LNCaP tumor-bearing mice were injected with 2 nmol of PSA750 different tissues excised 24 h later. Organ fluorescence was determined using FMT in epifluorescence mode. Regions of interest were drawn around each organ using the FMT software and the mean fluorescence normalized to the geometric mean of the ROI () determined. Shown are data from two representative mice (the experiment was repeated twice with similar results). PSA750 selectively distributes to tumor tissue compared to other vital organs. Inset shows an image of the fluorescence detected in different organs of an LNCaP tumor-bearing mouse.  3.5.In Vivo Fluorescence Molecular TomographyPSA750 was used to visualize both LNCaP and negative PC3 tumors in vivo using 3-D fluorescence molecular tomography [Fig. 5(a)]. Tomographic images showed a higher PSA750 signal in the LNCaP tumors, which was confirmed quantitatively, exhibiting a significant increase () in fluorescence concentration in the PSA positive cells when compared to PSA negative PC3 tumors [Fig. 5(b)]. In vivo tumor fluorescence was also found to correlate well () with tumor volume [Fig. 5(c)]. Fig. 5In vivo tumor imaging and quantification. LNCaP and PC3 tumor-bearing mice were injected with 2 nmol PSA750 and imaged 24 h later by FMT. (a) FMT representation of PSA750 activity in PSA positive (LNCaP) and negative (PC3) tumor-bearing mice. LNCaP tumors show more tumor definition and brighter signal, which is quantified in (b), the total amount of fluorescence (pmol) was quantified in specific ROIs encompassing each tumor. LNCaP tumors have significantly higher PSA-associated signal as compared to adjoining muscle (left) or PC3 tumors (right). (c) The total fluorescence of PSA750 also correlates well () with tumor volume. 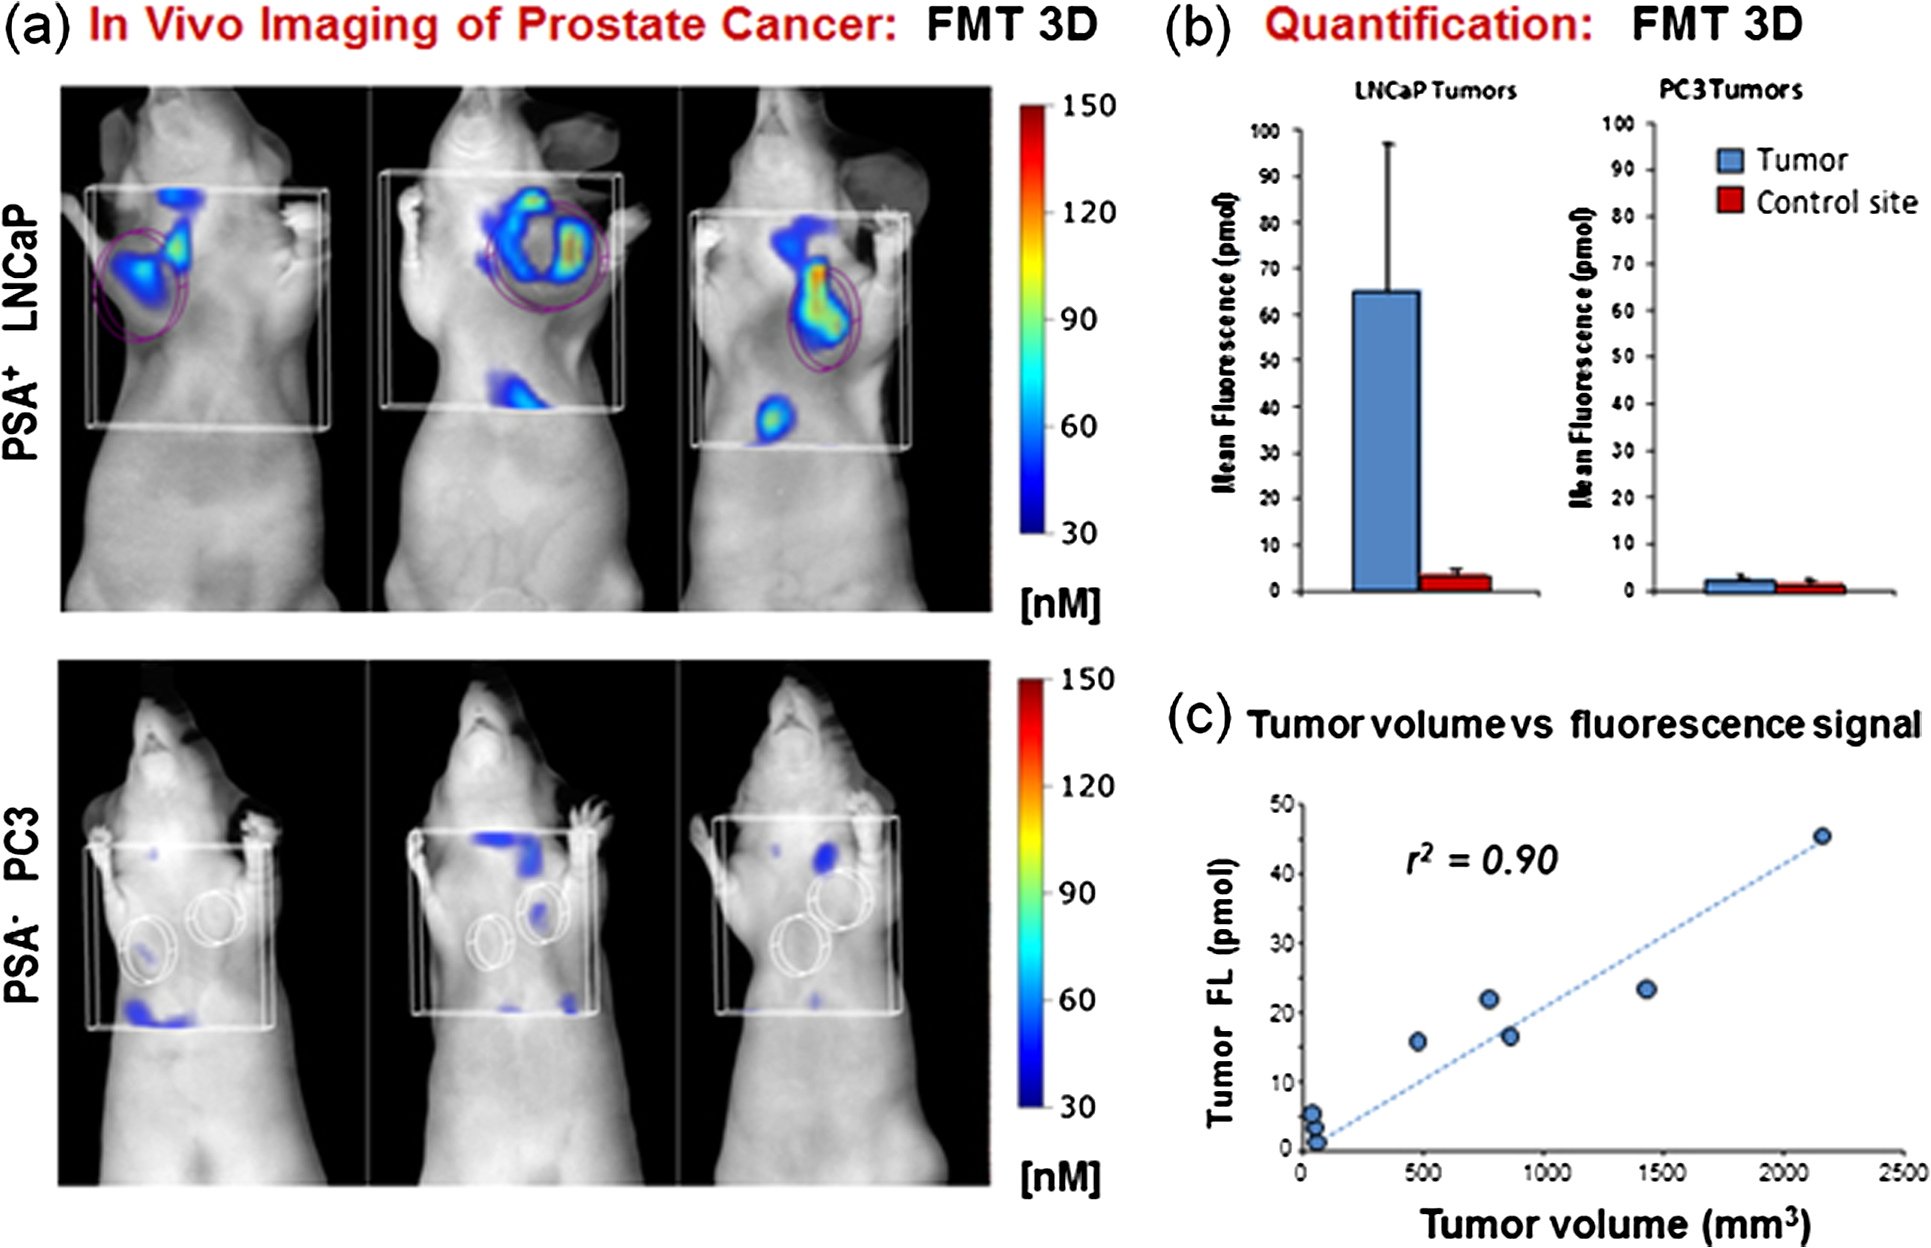 3.6.Tumor LocalizationPSA750 localization was determined in LNCaP tumor sections excised from nude mice that had been injected with both PSA750 and Hoechst 33342 to visualize tumor vasculature. Fluorescence microscopy shows that PSA750-associated fluorescence is seen in nonvascularized tissue (Fig. 6), indicating that PSA750 is activated by PSA in the tissue as expected. Perfused regions allow plasma ACT to ablate PSA activity. Fig. 6Localization of activated PSA750 ex vivo. Tumors were snap frozen in OCT for fluorescence microscopy. The distribution of an NIR fluorescence was determined using fluorescence microscopy. Digital images were captured using appropriate filters for Hoechst (blue), and the near-infrared agent PSA750 (red). Final magnification . Each panel from a different tumor section shows activated PSA-associated fluorescence in nonvascularized areas as expected. (PSA is immediately inactivated by inhibitors in plasma, active PSA is found in the tumor matrix.)  4.DiscussionPSA was first discovered as a marker for human semen in 197111 and later found to be high in men with prostate cancer.12 The serum PSA assay was initially used to screen men with an existing diagnosis of prostate cancer,13 and in 1994, it was approved by the FDA for prostate cancer screening. The observed decline in worldwide mortality rate due to prostate cancer has been, at least in part, attributed to the routine screening of men for serum PSA levels.14 Unfortunately, the PSA assay has faced some significant limitations as a diagnostic agent both due to false positive and false negative results, i.e., the misdiagnosis of BPH and the of men with prostate cancer and low serum PSA.7 So, despite the overall perceived benefit of serum PSA screening, there is no objective evidence to date that successfully shows a significant correlation between PSA screening and a decline in mortality rate, making it difficult to exclude the possibility of cancer at any PSA level. To some degree, the additional screening for “free” forms of PSA in serum has helped in mitigating problems with PSA as a diagnostic biomarker; BPH patients typically show levels of free PSA below 20% to 25%, and cancer patients with low PSA show an increased percentage of free PSA.15 These findings suggest that there may be further benefit in assessing different forms of PSA, including free versus bound, and enzymatically active versus inactive PSA. -labeled monoclonal antibodies directed against specific epitopes uniquely accessible on free PSA have been used to image tumor xenografts LNCaP and DU-145 in mice.16,17 While these studies showed selective uptake in tumors in vivo, they did not specifically quantify active PSA. In order to develop an imaging agent that detects enzymatically active forms of PSA, it is necessary to identify suitable substrate sequences that are selectively cleaved by PSA and not by other related enzymes. The cleavage maps following PSA treatment of human semenogelin I have been reported,18 and based on the cleavage fragments, the most efficient cleavage site was identified as . A series of oligopeptide cytotoxic drug conjugates containing Gln-Ser have shown PSA-targeted pro-drug activities.8 Thus, similar peptide sequences were prepared for the fluorogenic PSA FAST agents in which both the C and N termini were attached to a lysine molecule modified at the -amino group by an NIR fluorophore. The NIR-modified peptides were nonfluorescent due to the proximity of the two fluorophores. The sequence was then optimized by in vitro PSA cleavage screening, in combination with various PKM at the C-terminus to achieve the optimal in vivo PK performance, leading to the identification of an effective PSA agent, PSA750 FAST. Activation of PSA750 with the active, free form of PSA was fast (near peak activation at 6 h post-addition of enzyme). Selectivity of this agent for the active form was confirmed by the absence of activation by PSA in complex with ACT, and selectivity was also seen as compared to activation by other disease-related enzymes, which required 24 h to show low levels of activation. The relatively short blood half-life of [Fig. 4(a)] serves to minimize exposure levels to these inefficiently activating proteases to further assure good in situ selectivity for PSA. Once activated in vivo, at sites of increased PSA enzymatic activity, peak signals are achieved at 24 h, with a bio-distribution pattern favoring detection of tumor tissue above normal tissues [Fig. 4(a) and 4(b)]. The overall activation profile of PSA750 offers optimal conditions for noninvasive fluorescent tomography of tumors, and the utility was shown in the imaging of subcutaneously implanted LNCaP and PC3 tumor xenografts (Fig. 5). LNCaP tumors were detected readily, and quantitation revealed -fold higher fluorescence as compared to PC3 tumors, which showed a signal similar to negative control tissue sites such as surrounding muscle [Fig. 5(b)]. Within the cohort of mice bearing LNCaP tumor xenografts, tumor burden, as assessed by micrometer measurements, correlated very well () with PSA750 signal [Fig. 5(c)], supporting the use of this agent as a tool to measure tumor burden. Ex vivo assessment of tumor tissue of PSA750-injected LNCaP-bearing animals, comparing agent fluorescence to tumor perfusion by 5 min in vivo Hoechst exposure reveals that the regions of the tumors showing extensive perfusion and vascular leakage do not show activation of PSA750. This is the expected result, as leakage of plasma components into tumors will leak to ACT complexing with PSA, ablating PSA enzymatic activity. This result provides another level of in vivo validation of this agent’s in vivo performance. Although the tumor xenografts represented in these studies were subcutaneously implanted (to allow correlation with tumor volumes), ultimately this agent imaged by fluorescent tomography would be ideal for studying both orthotopic tumors as well as metastasis to other sites, such as lung and bone. This has been a successful approach for other types of tumors using NIR imaging agents activated by other disease-related proteases.19–21 The ability to detect the free, active form of PSA, based on its enzymatic activity, offers the unique ability to detect a unique form of this biomarker only at the site of tumor growth. PSA750 is a unique and powerful tool for preclinical prostate cancer research that may show utility in the future for clinical transrectal or laparascopic NIR imaging for the diagnosis of PSA activity in the prostate. ReferencesH. Lilja,
“A kallikrein-like serine protease in prostatic fluid cleaves the predominant seminal vesicle protein,”
J. Clin. Invest., 76
(5), 1899
–1903
(1985). http://dx.doi.org/10.1172/JCI112185 JCINAO 0021-9738 Google Scholar
K. W. K. Wattet al.,
“Human prostate-specific antigen: structural and functional similarity with serine proteases,”
Proc. Natl. Acad. Sci. U. S. A., 83
(10), 3166
–3170
(1986). http://dx.doi.org/10.1073/pnas.83.10.3166 1091-6490 Google Scholar
H. LiljaP. A. AbrahamssonA. Lundwall,
“Semenogelin, the predominant protein in human semen,”
J. Biol. Chem., 264
(3), 1894
–1900
(1989). JBCHA3 0021-9258 Google Scholar
S. A. Williamset al.,
“Does PSA play a role as a promoting agent during the initiation and/or progression of prostate cancer?,”
Prostate, 67
(3), 312
–329
(2007). http://dx.doi.org/10.1002/(ISSN)1097-0045 0270-4137 Google Scholar
H. R. Liljaet al.,
“Prostate specific antigen in human serum occurs predominantly in complex with alpha-1-antichymotrypsin,”
Clin. Chem., 37
(9), 1618
–1625
(1991). CLCHAU 0009-9147 Google Scholar
S. A. Williamset al.,
“Enzymatically active prostate-specific antigen promotes growth of human prostate cancers,”
Prostate, 71
(15), 1595
–607
(2011). http://dx.doi.org/10.1002/pros.v71.15 0270-4137 Google Scholar
I. M. Thompsonet al.,
“Prevalence of prostate cancer among men with a prostate-specific antigen level per milliliter,”
N. Engl. J. Med., 350
(22), 2239
–2246
(2004). http://dx.doi.org/10.1056/NEJMoa031918 NEJMAG 0028-4793 Google Scholar
V. M. Garskyet al.,
“The synthesis of a prodrug of doxorubicin designed to provide reduced systemic toxicity and greater target efficacy,”
J. Med. Chem., 44
(24), 4216
–4224
(2001). http://dx.doi.org/10.1021/jm0101996 JMCMAR 0022-2623 Google Scholar
V. Ntziachristoset al.,
“Looking and listening to light: the evolution of whole-body photonic imaging,”
Nat. Biotechnol., 23
(3), 313
–320
(2005). http://dx.doi.org/10.1038/nbt1074 NABIF9 1087-0156 Google Scholar
E. E. Graveset al.,
“Submillimeter resolution fluorescence molecular imaging system for small animal imaging,”
Med. Phys., 30
(5), 901
–911
(2003). http://dx.doi.org/10.1118/1.1568977 MPHYA6 0094-2405 Google Scholar
M. Haraet al.,
“Some physico-chemical characteristics of “-seminoprotein,” an antigenic component specific for human seminal plasma. Forensic immunological study of body fluids and secretion. VII,”
Nihon Hoigaku Zasshi, 25
(4), 322
–324
(1971). NHOZAX Google Scholar
T. A. Stameyet al.,
“Prostate-specific antigen as a serum marker for adenocarcinoma of the prostate,”
N. Engl. J. Med., 317
(15), 909
–916
(1987). http://dx.doi.org/10.1056/NEJM198710083171501 NEJMAG 0028-4793 Google Scholar
C. J. Ercoleet al.,
“Prostatic specific antigen and prostatic acid phosphatase in the monitoring and staging of patients with prostatic cancer,”
J. Urol., 138
(5), 1181
–1194
(1987). JOURAA 0022-5347 Google Scholar
W. Oberaigneret al.,
“Reduction of prostate cancer mortality in Tyrol, Austria, after introduction of prostate-specific antigen testing,”
Am. J. Epidemiol., 164
(4), 376
–384
(2006). http://dx.doi.org/10.1093/aje/kwj213 AJEPAS 0002-9262 Google Scholar
L. J. Sokollet al.,
“Complexed prostate-specific antigen as a staging tool for prostate cancer: a prospective study in 420 men,”
Urology, 60
(4), 18
–23
(2002). http://dx.doi.org/10.1016/S0090-4295(02)01692-8 0090-4295 Google Scholar
A. Larsonet al.,
“Radioimmunodetection of prostatic cancer with 125I-labelled antibody against prostatic specific antigen,”
Scand. J. Urol. Nephrol. Suppl., 110 149
–153
(1988). SJUNBT 0300-8886 Google Scholar
S. Evans-Axelssonet al.,
“Targeting free prostate-specific antigen for in vivo imaging of prostate cancer using a monoclonal antibody specific for unique epitopes accessible on free prostate-specific antigen alone,”
Cancer Biother. Radiopharm., 27
(4), 243
–251
(2012). http://dx.doi.org/10.1089/cbr.2011.1088 CBRAFJ 1084-9785 Google Scholar
J. MalmJ. HellmanH. Lilja,
“Mapping of the unique enzyme characteristics of PSA,”
J. Urol., 157 345
(1996). JOURAA 0022-5347 Google Scholar
C. H. Tunget al.,
“In vivo imaging of proteolytic enzyme activity using a novel molecular reporter,”
Cancer Res., 60 4953
–4958
(2000). CNREA8 0008-5472 Google Scholar
S. Kossodoet al.,
“Dual in vivo quantification of integrin-targeted and protease-activated agents in cancer using fluorescence molecular tomography (FMT),”
Mol. Imag. Biol., 12
(5), 488
–499
(2010). http://dx.doi.org/10.1007/s11307-009-0279-z 1536-1632 Google Scholar
M. Ackermannet al.,
“Adnectin CT-322 inhibits tumor growth and affects microvascular architecture and function in Colo205 tumor xenografts,”
Int. J. Oncol., 38
(1), 71
–80
(2011). IJONES 1019-6439 Google Scholar
|


