|
|
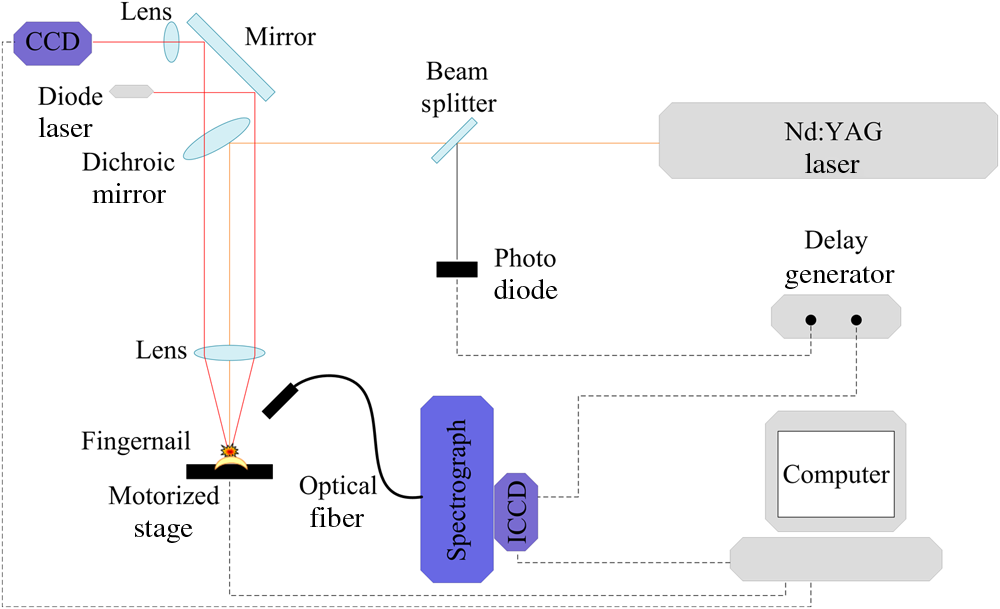
1.IntroductionLaser-induced breakdown spectroscopy (LIBS) is an analytical technique with a wide range of applications. The method uses a focused high-power and short-pulse laser beam on the sample surface. If the laser power exceeds the threshold value, an optical breakdown occurs. During the optical breakdown, a highly ionized gas, i.e., plasma, is formed. As the plasma cools down, atoms, ions, and molecules in plasma emit their characteristic spectral lines. These spectral lines can be used to identify the composition of the sample, assuming that the plasma composition is representative of the target.1,2 There is a special attention on the application of LIBS in biological matrix analysis. Analysis of bacteria,3,4 teeth,5,6 hairs,7 bones,8 and fingernails9–13 are some examples of its applications in this area. Other methods used for elemental analysis of biological matrix are neutron activation analysis,14 atomic absorption spectrophotometry,15 inductively coupled plasma mass spectrometry,16 X-ray fluorescence,17 and proton particle-induced X-ray emission,18 whereas Raman spectroscopy is extensively used as a molecular detection method.19–21 Diabetes mellitus (DM) is a worldwide problem of increasing importance. It refers to a group of metabolic diseases in which a person has high blood sugar either because the pancreas does not produce enough insulin or because cells do not respond to the produced insulin.22 The systemic pathologic alterations that occur in patients with DM may affect the nail unit.23 Nail can be a useful sample for clinical investigations, since metabolic events that occurred during the time of its formation can influence its components.24–26 The nail plate is formed by layers of keratinized cells produced by the nail matrix, a highly proliferative epidermal tissue.27 It is mainly composed of hard α-keratin, which is the substance forming the stratum corneum,28 as well as some trace elements. The mechanism of elements incorporation into nails includes incorporation into the matrix by the formation of keratinized tissue, via blood flow during linear growth; incorporation via nail bed, during thickening growth; and possible environmental contamination that may provide rapid access of xenobiotics to the distal nail.16 Changes in molecular structure of human fingernail proteins of diabetic and nondiabetic specimens have been investigated by Farhan et al. using FTIR spectra.29 They concluded that the proteins in the nails of diabetic patients contain -helical structure, including the presence of amide II bonds, while nails of nondiabetic patients do not have the amide II structures. Dielectric properties of keratin–water system in diabetic and healthy human fingernails have been investigated by Jabłecka et al.30 Their results indicated that the dielectric measurements of the nail could be used in detection of diabetes. Elemental analysis of nail and other biological samples such as serum, scalp hair, urine, and other body fluids of DM patients have been carried out by Nasli-Esfahani et al.31 Their results showed that scalp hair and nail are the best biological samples for trace element analysis especially in the case of Cr, Se, and Mn due to the high accumulation of these elements in hair and nail. Screening programs become increasingly popular, since “prevention” is considered “better than cure.” For this purpose, a suitable screening test must be available. Suitability criteria include adequate sensitivity and specificity, low cost, ease of administration, minimal discomfort upon administration, and acceptability to both patients and practitioners. Among human tissues, nail is a favorable sample for screening because it is easy to collect, store, and transport. On the other hand, compared to other methods, LIBS offers many advantages including no sample preparation, extremely fast measurement time, broad elemental coverage, and relatively low cost for every experiment. Therefore, LIBS of fingernails can be a suitable method for screening of DM. In the present study, laser-induced breakdown spectroscopy is used for the analysis of fingernail belonging to DM and nondiabetic subjects. Elemental analyses of fingernails of opium addicts, osteoporotic, hyper- and hypothyroidism, alcoholic, and doping subjects by means of LIBS have been investigated by our group.10–13 In our previous works, we could find some correlation between disease and fingernail elements. To investigate alcoholic and doping subjects, an auto-focus system was applied to prepare the same lens to sample distance for all fingernails.13 Since in that work the sample size was so limited, we could not make a general conclusion from our results. So, in the present study, in addition to using the auto-focus system, a reasonable sample size is prepared. A statistical multivariate method named discriminant function analysis (DFA) is used to discriminate and classify samples. The possibility of using this method in screening purposes is discussed by calculating the sensitivity and selectivity. Also, a brief discussion about the relation between some elements and DM is included. 2.ExperimentThe experimental setup used to analyze fingernails is shown in Fig. 1. A Q-switched Nd:YAG laser (Continuum, Surelite III) with a wavelength of 1064 nm, pulse energy of , repetition rate of 1 Hz, and pulse duration of 6 ns is used. Its beam is focused by means of a 180-mm focal length lens to create a plasma on the sample surface. Plasma emission is guided by an optical fiber to an echelle spectrograph (Kestrel, SE200) with the resolving power of 1700. The spectrograph is equipped by an intensified charge-coupled device (ICCD) camera (Andor, iStar DH734). A part of laser beam is sent to a photodiode by means of a beam splitter and then a signal is sent to a delay generator. ICCD is triggered by the delay generator, 1 μs after the plasma initiation. Each spectrum is recorded with a gate width of 20 μs. Nail sample has a slight convexity. To maintain the distance between lens and all sample surfaces in similar situation, an auto-focusing system is used which is described in our previous work.13 All nail samples were fixed on a specialized sample holder in which the situation of all nails with respect to laser pulse is the same and during the experiment, the healthy/patient status of samples is unidentified. Five points are selected on each nail sample and 10 laser shots hit on each point. Thus, the LIBS spectrum of each nail sample is obtained by the accumulation of 50 laser shots. 3.SubjectsThe subjects of this study were chosen from the population of the Diabetes Center of Rasht. The purpose of the study was explained to everyone and 85 fingernail clippings were kindly donated by 85 people. These volunteers were aware that no identification would be made between the donor and the samples (anonymity of donor). All subjects filled out questionnaires containing individual information such as personal information, medical history, drug consumptions, and special diets. The 85 subjects were categorized into two groups including 51 diabetic and 34 related control subjects. Our diabetic cases have type 2 diabetes. Type 2 diabetes, formerly called adult-onset diabetes, is the most common type of diabetes. About 95% of diabetic people have type 2 diabetes.32 They have a median age of 51 with the standard deviation of 3.839 ranging from 41 to 57-years old. Thirteen of them are male and 38 of them are female. The controls are chosen in the way that they have the most similarities with the cases in age and gender. They have a median age of 50 with the standard deviation of 4.625 ranging from 40 to 59-years old. Fourteen of them are male and 29 of them are female. The free edge of the fingernails was taken by a stainless steel nail clippers and kept separately in plastic envelopes at room temperature until analysis. In order to eliminate any surface contamination, specimens were soaked in acetone, alcohol, and distilled water for 2 min for each one. All of them were dried at room temperature. 4.Statistical MethodDFA, a multivariate statistical method, has been used for classification of subjects into case and control groups. DFA is a multivariate analysis of variance (MANOVA) which forms linear combinations of variables to identify group memberships. In our study, the spectra acquired from fingernails of cases should constitute one group and fingernail spectra of controls would constitute another group. In DFA, for discrimination amongst groups, discriminant function scores for each case are calculated. Then, the unknown case is assigned a group membership based on those scores. Since here, we are discriminating amongst two groups, only one score is calculated. So all the variables from each spectrum belonging to each case are used by DFA to calculate a discriminant function score and then to predict the group membership of that particular case. All the variable vectors from all groups were analyzed simultaneously by a commercial DFA program (SPSS Inc., Chicago) to construct the canonical discriminant functions. DFA has three basic steps: construction of discriminant functions, test of significance, and classification. A useful quantity in DFA is Wilks’ lambda. It is a statistical test used in MANOVA. It tests whether there are differences between the means of identified groups of subjects on a combination of dependent variables. Lambda varies from 0 to 1. The smaller the lambda for a variable, the more that variable contributes to the discriminant function. Further detailed information on the statistical procedures can be found in our previous works.9,10 5.Results and DiscussionThe spectroscopic analysis is based on the fingernail plasma emission lines. A typical LIBS spectrum obtained from fingernail with some indicated lines is shown in Fig. 2. Eighty-two emission lines have been identified in the fingernail spectrum belonging to atomic and ionic lines of 13 elements including calcium, magnesium, silicon, sodium, potassium, titanium, strontium, iron, aluminum, carbon, nitrogen, hydrogen, and oxygen as well as CN molecules. DFA statistical method performs multivariate analyses with these emission lines and categorizes 85 subjects into two groups including 51 diabetic and 34 related control subjects. Eighty-two line intensities are used in this analysis altogether and 96.5% of original grouped cases are correctly classified. The results of this analysis show that there is an excellent discrimination between two groups based on the fingernail elements which is shown better in a plot of discriminant function scores of samples in Fig. 3. A leave-one-out cross-validation method was applied to evaluate the performance of the DFA model. In each round of cross-validation, one case is held out from the entire dataset and assigned as a test for the classifier developed by using the remaining cases assigned as training set. This process is repeated until all the withheld cases in the dataset are validated, and accordingly, the overall diagnostic accuracy of DFA is calculated. The results of this classification are shown in Table 1 and show that 85.9% of cross-validated grouped cases are correctly classified. The overall predictive accuracy of the discriminant function is called “hit ratio.” To find out whether the calculated hit ratio is acceptable or not, it should be compared with what it could be achieved by chance. If two groups are equal in size, then you have a 50/50 chance anyway. Most researchers would accept a hit ratio that is 25% larger than that due to chance. In our analysis, the prior probabilities for groups are 60% for diabetic and 40% for nondiabetic subjects. Therefore, the accuracies of 92.2% for diabetic and 76.5% for nondiabetic subjects are so promising. Fig. 3Discriminant function analysis plot showing the first discriminant function scores of LIBS spectra obtained by 82 emission lines of fingernails of diabetic and nondiabetic subjects. 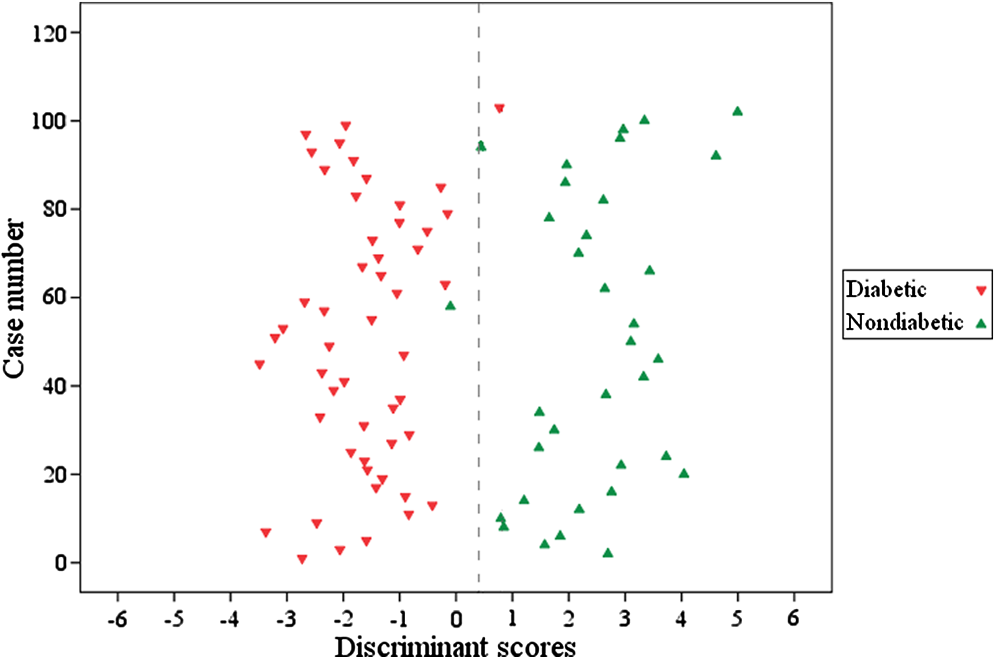 Table 1Results of classification between diabetic and nondiabetic subjects.
Sensitivity and specificity are two basic quantities for measuring the accuracy of a diagnostic test.33,34 If the result of a diagnostic test has been presented as a table, as it is shown in Table 2, sensitivity and specificity could be calculated. The sensitivity of a diagnostic test quantifies its ability to correctly identify subjects with the disease condition and it is a measure of how well the test detects patients. It is the proportion of true positives that are correctly identified by the test. The sensitivity of our analysis is [] 92.2%. The specificity is the ability of a test to correctly identify subjects without the disease. It is the proportion of true negatives that are correctly identified by the test. The specificity of our analysis is []76.5%. Discriminant functions evaluated at group means are shown in Table 3 and are considered as discriminant functions group centroids. If someone’s discriminant function score is closer to , then his/her group membership was probably diabetic. If the person’s DF score is closer to 2.441, then the data probably came from the nondiabetic group. In practical terms, the group membership of a person is defined by calculating a cut score halfway between the two centroids. Thus, the cut score in our analysis is 0.406 (as indicated in Fig. 3 by a dashed line). If an individual person’s DF score is above 0.406, then he/she is probably a nondiabetic person. If their DF scores are below it, then they were probably diabetic. Where one puts the cut-off determines the sensitivity and specificity. The position of this cut-off in the distribution should be based on the associated risk of morbidity or mortality that warrants further intervention. When screening for a disease, we may want to accept more false positives in return for fewer false negatives. Most screening tests involve diseases that have a low prevalence, so the number of false positives increases (the number of false negatives decreases). In our analysis (see Fig. 3), if the cut score moves toward right, the number of false negatives decreases. Table 2Result of a diagnostic test presented as a 2×2 table.
Table 3Functions at group centroids of analysis with all 82 variables.
The other two basic quantities related to the accuracy of a diagnostic test are positive predictive value (PPV) and negative predictive value (NPV). They are related to sensitivity and specificity through disease prevalence. Prevalence is the probability of disease in the population under study. PPV is the proportion of patients with the disease out of all the patients with a positive test result. In the other word, PPV is the probability that an individual with a positive test has the disease. In statistics and diagnostic tests, the PPV, or precision rate is the proportion of positive test results that are true positives. NPV is the proportion of patients without the disease out of all the patients with negative test result or probability that an individual with a negative test does not have the disease.33,34 Looking at the columns of Table 1 instead of the rows, PPV of and NPV of for our analysis can be calculated. We can perform DFA program via stepwise method. Several criteria can be considered in stepwise analysis including Wilks’ lambda. When the Wilks’ lambda is selected as criterion in stepwise method, at each step, the variable that minimizes the overall Wilks’ lambda is entered. Wilks’ lambda minimizes the variance within groups and maximizes the variance between groups. Table 4 shows seven variables that are selected for our model and the related Wilks’ lambdas. It means that we can use just these variables and obtain the same classification result. It would be concluded that these variables are good predictors for diabetes status using LIBS of fingernails. These seven predictors are emission lines belonging to C I (247.85), N I (744.22), Mg II (280.27), Mg I (285.21), CN 1-1 (387.08), Si I (288.15), and K I (769.89) which are shown in Fig. 4 with a bigger font size. The mean peak intensities, standard deviations, and standard errors of these seven variables for the diabetic and nondiabetic groups are also presented in Table 4. Discriminant function group centroids of analysis with these seven variables are shown in Table 5. Table 4Emission lines selected in the stepwise method of classification of diabetic and nondiabetic subjects, the related Wilks’ lambdas, the mean peak intensities, standard deviations, and standard errors of these variables for the diabetic and nondiabetic groups.
Fig. 4Regions of the fingernail spectrum containing: (a) C I (247.85), (b) Mg II (280.27), Mg I (285.21), and Si I (288.15), (c) CN 1-1 (387.08), and (d) K I (769.89) emission lines.  Table 5Functions at group centroids of analysis with seven variables.
There are some evidences of relationships between the above elements and diabetes due to their effects on impaired insulin release, insulin resistance, and glucose intolerance.35–41 An increasing amount of evidence shows a clinical relevance for the altered magnesium metabolism present in the states of increased peripheral insulin resistance. Magnesium is one of the most abundant ions present in living cells and its blood plasma concentration is remarkably constant in healthy subjects. Blood plasma and intracellular magnesium concentrations are tightly regulated by several factors. In fact, in vitro and in vivo studies have demonstrated that insulin may modulate the shift of magnesium from extracellular to intracellular space.36 Magnesium is a cofactor in the glucose transporting mechanisms of the cell membrane and various enzymes in carbohydrate oxidation. It is also involved at multiple levels in insulin secretion, binding and enhancing the ability of insulin to activate tyrosine kinase.37 Magnesium deficiencies have been implicated in insulin resistance, carbohydrate intolerance, dyslipidemia, and complications of diabetes.38 The presence of Mg deficit in blood serum of diabetic patients has been recognized.31,39,40 The urine magnesium level was reported to be significantly higher in diabetics than nondiabetics. The results of their nail and hair analyses depicted that in the diabetic group, Mg level in nail was lower and in hair was higher than that in nondiabetic group.31 The hypothesis that a cellular deficiency of K exists in type 2 DM patients is investigated by Resnick et al.41 They found that K levels in red blood cells of type 2 DM patients were significantly lower when compared with those in controls. Si in animals and human beings has beneficial effects on collagen and glycosaminoglycan formation or function, which could influence bone formation and maintenance, cardiovascular health, and wound healing. Although numerous apparent Si deficiency signs have been described, Si still is not generally accepted as an essential nutrient for animals and human beings.42 However, there is no discussion in the literature about Si in diabetic subjects and we cannot explain our result about Si. 6.ConclusionLaser-induced breakdown spectroscopy is applied to investigate the effect of DM on elemental composition of fingernails. Eighty-five fingernail clippings belonging to two groups of 51 diabetic and 34 normal subjects have been analyzed. An auto-focus system has been used to maintain the distance between lens and all sample surfaces in similar situation. Under this circumstance, the issue that the differences between the fingernail LIBS spectra should be due to the disease and not due to the experimental fluctuations can be satisfied. The ability to classify subjects based on 82 atomic, ionic, and molecular emission lines belonging to 13 elements as well as one molecule of fingernail has been examined. DFA has been used for classification of subjects into two groups of diabetic and nondiabetic subjects. The results of classification are promising and acceptable sensitivity and selectivity are obtained. A brief discussion on elements that are important in the classification including Mg, Si, and K, shows that the alternation in some of them in diabetic patients is expected. This satisfactory preliminary result shows that using LIBS spectra of fingernail accompanied with DFA can be valid in classification of diabetic and nondiabetic subjects and it is feasible in screening purposes. However, the results should be proved by further works and other case–control investigations. AcknowledgmentsThe authors would like to thank the personnel of Diabetes Center of Rasht for their kind help in collection of fingernails. We are also thankful of every person who participates in this study by donating the fingernail clippings. ReferencesD. A. CremersL. J. Radziemski, Handbook of Laser-Induced Breakdown Spectroscopy, John Wiley & Sons, Ltd., Chichester, UK
(2006). Google Scholar
J. P. SinghS. N. Thakur, Laser-Induced Breakdown Spectroscopy, Elsevier, New York, NY
(2007). Google Scholar
M. Baudeletet al.,
“Discrimination of microbiological samples using femtosecond laser-induced breakdown spectroscopy,”
Appl. Phys. Lett.Appl. Phys. Lett., 89
(16), 163903
(2006). http://dx.doi.org/10.1063/1.2361270 APPLAB 0003-6951 Google Scholar
S. J. Rehseet al.,
“A membrane basis for bacterial identification and discrimination using laser-induced breakdown spectroscopy,”
J. Appl. Phys., 105
(10), 102034
(2009). http://dx.doi.org/10.1063/1.3116141 JAPIAU 0021-8979 Google Scholar
O. Sameket al.,
“Quantitative analysis of trace metal accumulation in teeth using laser-induced breakdown spectroscopy,”
Appl. Phys. A., 69
(Suppl.), S179
–S182
(1999). http://dx.doi.org/10.1007/s003399900277 APAMFC 0947-8396 Google Scholar
O. Sameket al.,
“Clinical application of laser-induced breakdown spectroscopy to the analysis of teeth and dental materials,”
J. Clin. Laser Med. Surg., 18
(6), 281
–289
(2000). http://dx.doi.org/10.1089/clm.2000.18.281 JCLSEO Google Scholar
M. Corsiet al.,
“Application of laser-induced breakdown spectroscopy technique to hair tissue mineral analysis,”
J. Appl. Opt., 42
(30), 6133
–6137
(2003). http://dx.doi.org/10.1364/AO.42.006133 JOAOF8 1464-4258 Google Scholar
M. A. Kasemet al.,
“Influence of biological degradation and environmental effects on the interpretation of archeological bone samples with laser-induced breakdown spectroscopy,”
J. Anal. At. Spectrom., 26
(30), 1733
–1739
(2011). http://dx.doi.org/10.1039/C1JA10057B JASPE2 1364-5544 Google Scholar
Z. HosseinimakaremS. H. Tavassoli,
“Analysis of human nails by laser-induced breakdown spectroscopy,”
J. Biomed. Opt., 16
(5), 057002
(2011). http://dx.doi.org/10.1117/1.3574757 JBOPFO 1083-3668 Google Scholar
S. ShadmanM. BahreiniS. H. Tavassoli,
“Comparison between elemental composition of human fingernails of healthy and opium-addicted subjects by laser-induced breakdown spectroscopy,”
Appl. Opt., 51
(12/20), 2004
–2011
(2012). http://dx.doi.org/10.1364/AO.51.002004 APOPAI 0003-6935 Google Scholar
M. BahreiniZ. HosseinimakaremS. H. Tavassoli,
“A study of association between fingernail elements and osteoporosis by laser-induced breakdown spectroscopy,”
J. Appl. Phys., 112 054701
(2012). http://dx.doi.org/10.1063/1.4747934 JAPIAU 0021-8979 Google Scholar
M. BahreiniS. H. Tavassoli,
“Possibility of thyroidism diagnosis by laser induced breakdown spectroscopy of human fingernail,”
Lasers Med. Sci., 3
(3), 127
–131
(2012). LMSCEZ 1435-604X Google Scholar
M. BahreiniB. AshrafkhaniS. H. Tavassoli,
“Elemental analysis of fingernail of alcoholic and doping subjects by laser-induced breakdown spectroscopy,”
Appl. Phys. B,
(2013). http://dx.doi.org/10.1007/s00340-013-5538-7 APBOEM 0946-2171 Google Scholar
G. S. FellH. SmithR. A. Howie,
“Neutron activation analysis for copper in biological material applied to Wilson’s disease,”
J. Clin. Pathol., 21
(1), 8
–11
(1968). http://dx.doi.org/10.1136/jcp.21.1.8 JCPAAK 0021-9746 Google Scholar
S. Ohgitaniet al.,
“Nail calcium and magnesium content in relation to age and bone mineral density,”
J. Bone Miner. Metab., 23
(4), 318
–322
(2005). JBMME4 0914-8779 Google Scholar
J. P. Goulléet al.,
“Application of inductively coupled plasma mass spectrometry multielement analysis in fingernail and toenail as a biomarker of metal exposure,”
J. Anal. Toxicol., 33
(2), 92
–98
(2009). JATOD3 0146-4760 Google Scholar
I. Baranowskaet al.,
“X-ray fluorescence spectrometry in multielemental analysis of hair and teeth,”
Polish J. Environ. Stud., 13
(6), 639
–646
(2004). PJESE2 1230-1485 Google Scholar
S. K. Biswaset al.,
“Trace lements in human fingernails: measurement by proton-induced X-ray emission,”
J. Radioanal. Nucl. Chem., 82
(1), 111
–124
(1984). http://dx.doi.org/10.1007/BF02227334 JRNCDM 0236-5731 Google Scholar
C. Krafftet al.,
“Raman and coherent anti-Stokes Raman scatteringmicrospectroscopy for biomedical applications,”
J. Biomed. Opt., 17
(4), 040801
(2012). http://dx.doi.org/10.1117/1.JBO.17.4.040801 JBOPFO 1083-3668 Google Scholar
T. Saxenaet al.,
“Raman spectroscopic investigation of spinal cord injury in a rat model,”
J. Biomed. Opt., 16
(2), 027003
(2011). http://dx.doi.org/10.1117/1.3549700 JBOPFO 1083-3668 Google Scholar
S. M. Aliet al.,
“Raman spectroscopic analysis of human skin tissue sections ex-vivo: evaluation of the effects of tissue processing and dewaxing,”
J. Biomed. Opt., 18
(6), 061202
(2013). http://dx.doi.org/10.1117/1.JBO.18.6.061202 JBOPFO 1083-3668 Google Scholar
D. G. GardnerD. Shoback, Greenspan’s Basic & Clinical Endocrinology, 9th ed.McGraw-Hill Medical, New York
(2011). Google Scholar
R. A. GreeneR. K. Scher,
“Nail changes associated with diabetes mellitus,”
J. Am. Acad. Dermatol., 16
(5), 1015
–1021
(1987). http://dx.doi.org/10.1016/S0190-9622(87)70131-5 JAADDB 0190-9622 Google Scholar
H. C. Hopps,
“The biologic bases for using hair and nail for analyses of trace elements,”
Sci. Total Environ., 7
(1), 71
–89
(1977). http://dx.doi.org/10.1016/0048-9697(77)90018-3 STENDL 0048-9697 Google Scholar
R. Baranet al., A Text Atlas of Nail Disorders: Techniques in Investigation and Diagnosis, 3rd ed.Martin Dunitz, Taylor & Francis Group, London
(2005). Google Scholar
A. Sukumar,
“Human nails as a biomarker of element exposure,”
Rev. Environ. Contam. Toxicol., 185 141
–177
(2006). RCTOE4 0179-5953 Google Scholar
A. Palmieriet al.,
“Drugs in nails: physiology, pharmacokinetics and forensic toxicology,”
Clin. Pharmacokinet., 38
(2), 95
–110
(2000). http://dx.doi.org/10.2165/00003088-200038020-00001 CPKNDH 0312-5963 Google Scholar
R. C. MarshallD. F. OrwinJ. M. Gillespie,
“Structure and biochemistry of mammalian hard keratin,”
Electron. Microsc. Rev., 4
(1), 47
–83
(1991). http://dx.doi.org/10.1016/0892-0354(91)90016-6 EMIREL 0892-0354 Google Scholar
K. M. FarhanT. P. SastryA. B. Mandal,
“Comparative study on secondary structural changes in diabetic and non-diabetichuman finger nail specimen by using FTIR spectra,”
Clin. Chim. Acta, 412
(3–4), 386
–389
(2011). http://dx.doi.org/10.1016/j.cca.2010.11.016 CCATAR 0009-8981 Google Scholar
A. JabłeckaJ. OlszewskiE. Marzec,
“Dielectric properties of keratin–water system in diabetic and healthy human fingernails,”
J. Non-Cryst. Solids, 355
(50–51), 2456
–2460
(2009). http://dx.doi.org/10.1016/j.jnoncrysol.2009.08.024 JNCSBJ 0022-3093 Google Scholar
E. Nasli-Esfahaniet al.,
“Trace element analysis of hair, nail, serum and urine of diabetes mellitus patients by inductively coupled plasma atomic emission spectroscopy,”
Iran. J. Diabetes Lipid Disord., 110 1
–9
(2011). IJDLAV 2008-1820 Google Scholar
Diabetes overview, NIH Publication No. 09–3873,
(2008) http://diabetes.niddk.nih.gov/dm/pubs/overview/ Google Scholar
H. B. Wong1G. H. Lim,
“Measures of diagnostic accuracy: sensitivity, specificity, PPV and NPV,”
Proc. Singapore Healthcare, 20
(4), 316
–318
(2011). Google Scholar
D. G. AltmanJ. M. Bland,
“Diagnostic tests. 1: Sensitivity and specificity,”
BMJ, 308
(6943), 1552
(1994). http://dx.doi.org/10.1136/bmj.308.6943.1552 0959-8138 Google Scholar
R. M. Walteret al.,
“Copper, zinc, manganese, and magnesium status and complications of diabetes mellitus,”
Diabetes Care, 14
(11), 1050
–1056
(1991). http://dx.doi.org/10.2337/diacare.14.11.1050 DICAD2 0149-5992 Google Scholar
M. Barbagalloet al.,
“New perspectives in magnesium research,”
Magnesium Metabolism in Insulin Resistance, Metabolic Syndrome, and Type 2 Diabetes Mellitus, 213
–223 Springer, London
(2007). Google Scholar
Z. Suarez,
“Decreased insulin sensitivity in skeletal muscle of hypomagnesemic rats,”
Diabetologia, 36 10000123
(1993). DBTGAJ 0012-186X Google Scholar
L. M. Resnicket al.,
“Cellular ions in hypertension, diabetes, and obesity. A nuclear magnetic resonance spectroscopic study,”
Hypertension, 17 951
–957
(1991). http://dx.doi.org/10.1161/01.HYP.17.6.951 HPRTDN 0194-911X Google Scholar
W. H. Kaoet al.,
“Serum and dietary magnesium and the risk for type 2 diabetes mellitus: the Atherosclerosis Risk in Communities Study,”
Arch. Intern. Med., 159 2151
–2159
(1999). http://dx.doi.org/10.1001/archinte.159.18.2151 AIMDAP 0003-9926 Google Scholar
H. M. Matheret al.,
“Hypomagnesaemia in diabetes,”
Clin. Chim. Acta, 95
(2), 235
–242
(1979). http://dx.doi.org/10.1016/0009-8981(79)90364-4 CCATAR 0009-8981 Google Scholar
L. M. Resnicket al.,
“Relation of cellular potassium to other mineral ions in hypertension and diabetes,”
Hypertension, 38 709
–712
(2001). http://dx.doi.org/10.1161/01.HYP.38.3.709 HPRTDN 0194-911X Google Scholar
F. H. Nielsen,
“Micronutrients in parenteral nutrition: boron, silicon, and fluoride,”
Gastroenterology, 137
(5), S55
–S60
(2009). http://dx.doi.org/10.1053/j.gastro.2009.07.072 GASTAB 0016-5085 Google Scholar
|
|||||||||||||||||||||||||||||||||||||||||||||||||||||||||||||||||||||||||||||||||||||||||||||||||||||||||||||||||||||||||||||||||||||