|
|
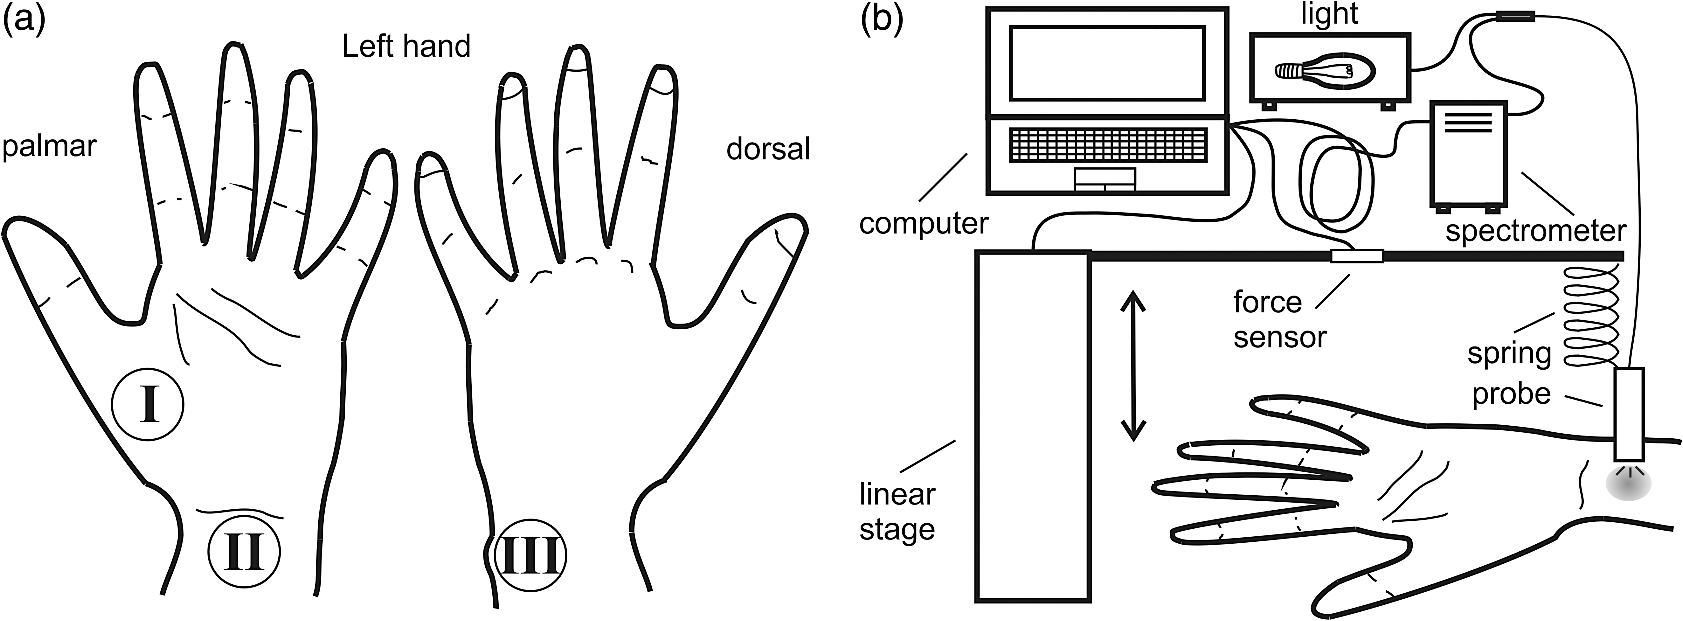
1.IntroductionDiffuse reflectance spectroscopy (DRS) is a rapid noninvasive technique that is gaining increasing importance in numerous biomedical applications, such as cancer diagnosis and treatment,1–3 burn depth assessment,4 monitoring tissue oxygenation,5,6 classification of healthy and pathological dental tissues,7 monitoring blood glucose,8,9 and other blood metabolites or drugs.10–12 In general, DRS spectra can be acquired in two ways, namely by point spectroscopy or by hyperspectral imaging.13,14 Many practical applications utilize a spectrometer and a fiber-optic probe. The acquired DRS spectra are formed by the reflected or transmitted, partially absorbed and scattered light. The absorption data hold quantitative and functional information on the tissue components, while the scattering data provide information on the structure and cellular composition.1 A fiber-optic probe pressed against the studied tissue is usually used to acquire diffuse reflectance spectra. However, even a light contact pressure can significantly affect the tissue optical properties and the light coupling into the fiber-optic probe. The resulting changes can substantially degrade the performance of the subsequent quantitative or qualitative spectral analysis. There are several studies on the contact pressure-induced spectral changes in the visible and near-infrared DRS,15–25 as well as similar studies involving other spectroscopic and imaging techniques.26–29 Initial studies were focused on ex vivo measurements and utilized a so-called spring-loaded compression apparatus [Fig. 1(a)] for applying a constant contact pressure.15,26 Human, bovine, and porcine samples were compressed between glass plates and the applied contact pressure was controlled by calibrated springs. Ex vivo measurements were also performed with a scale or a load cell [Fig. 1(b)], which measured additional force on the sample.24,30 Several studies focused on in vivo measurements of human and animal skin at different sites,18,21,23,25,29 including abdomen,28 breast,16,19,22 and mouse muscle.20 Some simple measurement setups [Fig. 2(a)] were based on modified fiber-optic probes with attached plastic or metal sleeve and a spring.21,23,27 The spring was calibrated for a few pressure levels, which were labeled on the sleeve. In this way, the applied contact pressure depended solely on the operator.27 However, the exact level of the applied contact pressure could not be measured. Moreover, the variability of the applied contact pressure at a predefined level was large, especially if the measurements lasted for several seconds.23 A similar measurement setup20,28,29 utilizing a set of calibrated weights [Fig. 2(b)] was used to reduce the variability of the applied contact pressure. However, in a practical measurement setup, the range of available weights substantially limits the usable pressure range. Furthermore, the weights need to be replaced for each measurement, which is a tedious and time-consuming task. The above listed issues can be alleviated by fully automated application and measurement of the contact pressure [Fig. 2(c)].18,19,25 Two studies on the pressure-induced changes in breast tissue’s optical properties employed experimental setups enhanced by additional force sensors.16,22 However, the location of the force sensors did not correspond with the position of the probe, rendering the measured contact pressure inaccurate. Fig. 1Diffuse reflectance systems for ex vivo measurements based on calibrated springs (a) or a scale (b). 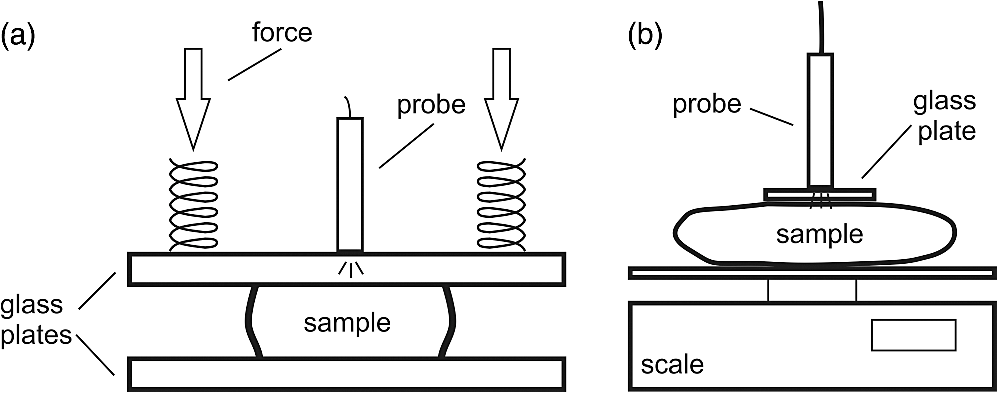 Fig. 2Diffuse reflectance systems for in vivo measurements based on a calibrated spring (a), calibrated weights (b), or a motorized linear stage (c). 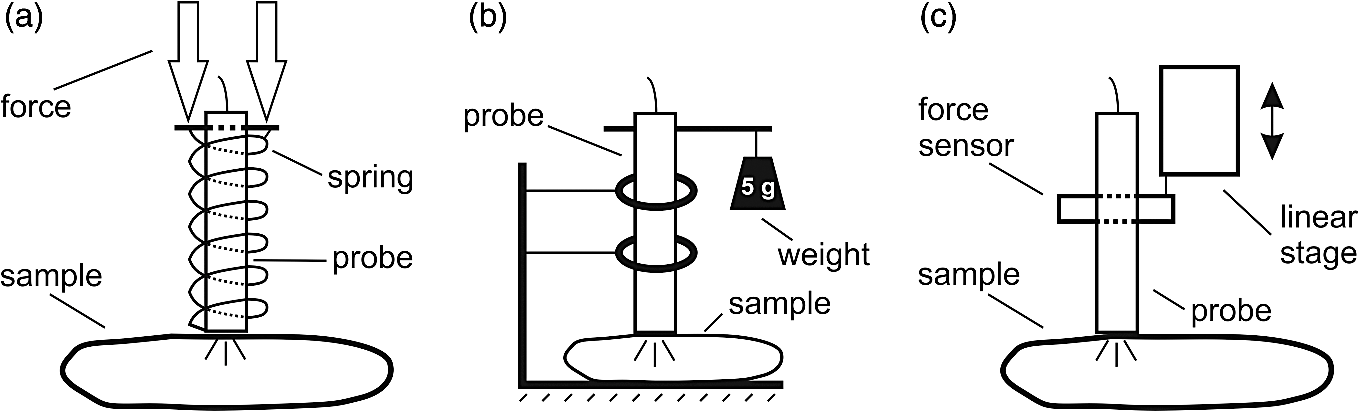 Due to the limitations of the employed measurement systems, the majority of the conducted studies measured the contact pressure only at a few discrete points. Furthermore, the comparison of the reported results is very difficult due to the inconsistent and frequently incomplete data, e.g., some of the studies reported the force data without the probe contact surface area, while others used custom qualitative pressure descriptions. The utilized contact pressure range depended on the study purpose and the employed measurement setup. In general, the contact pressure was in the range from 0 to 200 kPa, with some studies focusing on low contact pressures, i.e., under 10 kPa.16,21 The full contact pressure range was employed only by one study.25 The effects of the applied contact pressure on the tissue optical properties in terms of transmittance, reflectance, absorption, and scattering coefficients were found to be governed by the local concentrations of water, hemoglobin, and lipids.25 The observed increase in the tissue transmittance with the applied pressure15,24 was explained by the reduction in the specimen thickness. The reported effects of the contact pressure on the reflectance were inconsistent. Several studies found the reflectance to decrease with the applied pressure,18,21,23,25 while an increase was reported by Reif et al.20 and no significant change was observed by Lim et al.23 The results obtained at 590 (Ref. 21), 620 (Ref. 17), and 1400 (Ref. 15) nm suggest the observed effect is wavelength dependent. The reported inconsistencies in the reflectance changes are most likely to be caused by the differences among the used samples. Lim et al.23 attributed the increased reflectance of the forehead skin to the increased scattering. It was assumed that skull is close to the skin surface, thereby preventing the dermis from collapsing into the hypodermis, which results in more light reaching the dermis layer rich in highly scattering collagen. A similar explanation could be used for the observed reflectance increase of the muscle tissue20 due to the scattering of the proteins in myofibrils. The reported results show that characterization of the absorption and scattering coefficient dependence on the applied pressure is a complex task. Due to the differences in the employed experimental setups, contact pressure levels, spectral range, and samples, no general conclusions can be made from the reported results. However, many studies found the absorption coefficient and the correlated chromophore concentrations to decrease with the applied pressure.16,19,20,23 It was hypothesized that the pressure compresses the blood vessels, thereby reducing the blood flow and modifying the tissue morphology. In contrast, several studies reported increase in the absorbance,15,25 total hemoglobin, and oxygen saturation16,22 with the applied pressure. The increase was explained by the local tissue compression, increasing the chromophore concentration, volumetric water content, and leakage of some extracellular tissue fluids. Additionally, the increase in the total hemoglobin and oxygen saturation indicated pressure-induced vasodilatation,16 which is consistent with the findings presented by Abraham et al.31 Obviously, this phenomenon is more pronounced at low pressure levels; however, it can be partially observed at higher pressures.19,23 After the initial drop in the absorption due to the applied contact pressure, the absorption coefficients started to increase. At higher contact pressures, no significant change was observed. Further increasing the pressure led to an increase in the hemoglobin and oxygen saturation and a decrease in the water concentration. On the other hand, scattering coefficient generally increased with the applied pressure.15,16,20,23 The increase was explained by the pressure-induced increase in the scatterer concentration. However, a few studies reported a decrease in the scattering coefficient,19,23,25 which was explained by the decrease in the refractive index mismatch due to the water displacement in the skin.23 Despite the inconsistencies in the reported results, it was shown that contact pressure–induced spectral changes are site specific23 and contain unique information on the underlying tissue.25 Therefore, the pressure-induced spectral information can be used to aid the analysis of diffuse reflectance spectra, leading to more accurate quantitative results and better classification performance. 2.Problem FormulationThe existing studies discovered many contact pressure–induced changes in the optical properties of various tissues. As a result of the applied contact pressure, the absorption and scattering coefficients generally increased or decreased by up to 70%. Furthermore, a recent study28 showed that the contact pressure–induced changes can substantially affect the accuracy of the subsequent spectral analysis. A contactless optic probe32 was suggested as a possible solution. Nevertheless, the vast majority of spectroscopic applications utilizing a fiber-optic probe should carefully consider the measurement protocol and the data analysis model, which need to effectively deal with the contact pressure–induced changes. In this article, we extensively analyze the contact pressure–induced effects encountered in a common DRS biomedical application. Classification of the three measurement sites on a human hand, representing an example of the natural variability in the perfusion and structure of the underlying tissue, was assessed by training and evaluating classifiers at different contact pressure levels. The influence of contact pressure on the quantification of tissue chromophores was not the main focus of this study. More details on the subject can be found in Refs. 23 and 25. However, the same methodology was used to extract the chromophore concentrations. For the purpose of this study, a diffuse reflectance measurement system enabling precise control of the applied contact pressure was used. Based on the obtained results, we proposed several practical guidelines minimizing the influence of contact pressure–induced effects on the classification performance of existing DRS fiber optic probe–based systems. 3.Materials and Methods3.1.SamplesThe conducted study included six human volunteers (Caucasian males). The spectra were acquired on the palm skin of the left hand. Three measurement sites were selected [Fig. 3(a)], namely skin above the abductor pollicis brevis muscle (site I), skin in the middle of the wrist crease above the veins (site II), and skin at the lateral part of the wrist above ulnar styloid process (site III). Although the soft muscle tissue (I) and the tissue above veins (II) provided relatively smooth and gradually increasing resistance to the applied pressure, the tissue above the bone styloid process (III) exhibited only limited compression. In addition, the underlying tissues at the three selected measurement sites are differently perfused and were expected to provide relevant insight into the unique tissue-related properties of the contact pressure–induced spectral response. 3.2.InstrumentationThe employed measurement system, developed by Bregar et al.,33 is shown in Fig. 3(b). Briefly, the spectra were acquired by a commercial near-infrared spectrometer (Control Development, NIR-512L-1.7T1, 901 to 1685 nm) employing a broadband halogen light source (AvaLight-Hal LS) and a stainless steel fiber optic diffuse reflectance probe (Avantes, Apeldoornseweg, The Netherlands, FCR-7IR400-2-ME), consisting of one detection and six illumination fibers. Diameter of the probe was 6.35 mm with the effective pressure area of . The probe was fixed to a metal compression spring exhibiting around 3 cm of travel path. The spring was attached to the metal lever equipped with a calibrated thin-film force sensor while the other side of the lever was fixed to a motorized linear stage providing precise and accurate control of the applied pressure. The motorized linear stage, force sensor, and spectrometer were controlled by a computer in order to ensure synchronized operation and acquisition of the spectra and pressure data. 3.3.MeasurementsThe palms of the volunteers were fixed during the data acquisition process, which started by activating the motorized linear stage and stopped when the spring exhibited full contraction, resulting in around 90 kPa of contact pressure. The spectral and pressure data were acquired synchronously, at a rate of 15 Hz. In this way, 49 spectra were acquired at contact pressure levels extending from 0 to 90 kPa. This range was selected in accordance with the majority of existing studies and to reflect the contact pressure applied by manual probe operators.27 The average contact pressure applied by trained probe operators included in this study was from 30 to 50 kPa with a standard deviation of 10 kPa. Nine measurements were made for each of the three selected skin sites (I: above abductor pollicis brevis muscle, II: above the veins in the middle of the wrist crease, and III: above ulnar styloid process at the lateral part of the wrist), allowing about 5 min for the tissue to recover from the previous measurement. In this way, 27 measurements were obtained for each of the six volunteers. The acquired measurements were divided into three independent sets, namely the training, validation, and test sets, each consisting of data collected from two volunteers. 3.4.Spectra ProcessingSpectra were processed according to the methodology published in Ref. 25. Briefly, the acquired spectra were normalized by two-point intensity calibration based on the reflectance spectrum of a standard diffuse reflectance tile (Spectralon) and the dark response of the sensor array : Due to the limited sensitivity of the employed sensor array, only the spectral range from 950 to 1600 nm was used by the subsequent data analysis. In order to provide results comparable with the majority of existing studies, the spectra were processed according to two different methodologies. 3.4.1.Methodology IThe scattering and absorption properties of the tissue were estimated from the steady-state diffuse reflectance measurements in a spectrally constrained manner34,35 using the following model: where , , , , and are the wavelength-dependent internal variables, calculated from the absorption and reduced scattering coefficient. The absorption coefficient was calculated as a product of cromophore concentrations () and corresponding absorption coefficients ():36–38 where represents oxygenation fraction (i.e., saturation). The reduced scattering coefficient was modeled according to where is wavelength, is scattering magnitude, and is scattering power.3.4.2.Methodology IIThe acquired spectra were also processed by a statistical approach. The extended form of multiplicative scatter correction method (EMSC) was applied to the acquired spectra.39 EMSC considers light scattering effects as wavelength dependent and models each acquired spectrum () according to where is the baseline, is the path length, is the reference spectrum, and and model the wavelength-dependent spectral variations. The coefficients of the EMSC model estimated by a least squares solution were used to calculate the preprocessed spectra asThe preprocessed spectra were analyzed by principal component analysis (PCA). 3.4.3.ClassificationThe estimated optical properties (see Sec. 3.4.1) or calculated PCA scores and EMSC coefficients (see Sec. 3.4.2) were subsequently used by quadratic discriminant analysis40-based classification of the three measurement sites. The optimal feature subsets were selected by sequential forward floating selection algorithm (SFFS),41 maximizing the classification posterior probability of the validation set. The performance of the classification models was evaluated by calculating the sensitivity, specificity, and posterior probability for each measurement site of the test set. The data were processed using MATLAB® software package (8.1, The MathWorks, Natick, Massachusetts). 4.ResultsThe observed contact pressure–induced spectral changes are shown in Fig. 4. The mean reflectance decreased with the applied contact pressure at all the three measurement sites. Figure 5(a) shows the performance of a classifier, trained on spectra acquired at minimum contact pressure (0 kPa) and evaluated across the full contact pressure range (from 0 to 90 kPa). The classification performance gradually decreased with increasing contact pressure. The main reason for the classification deterioration was the increasing number of misclassifications observed for the measurement site above the veins (II), which led to decreased sensitivity of the measurement site and decreased specificities for the remaining two measurement sites, i.e., above the muscle (I) and above the bone (III) [Fig. 5(b)]. Figure 6 shows performances of classifiers trained and evaluated on spectra acquired at the same contact pressure level. It is evident that the classification performance is on average independent of the applied contact pressure; however, it depends on the measurement site. Table 1 includes the comparison of classifiers trained and evaluated at the same contact pressure levels (Fig. 6), and the results obtained for classifiers based on spectra acquired by a trained operator , where and represent the mean and standard deviation of the applied contact pressure, respectively. A substantial degradation in the performance of classifiers based on operator-acquired spectra was observed. Performance of the classifiers trained and evaluated on spectra acquired at the same contact pressure level (Fig. 6), was analyzed in terms of minimum, maximum, and average classification sensitivity, specificity, and posterior probability (Table 2). The classifier trained and evaluated at 79.5 kPa performed the best. A consistent classification performance across the full contact pressure range can also be achieved by training several classifiers, each covering part of the employed contact pressure range. In our study, three classifiers trained at 0 kPa [Fig. 5(a)], 26, and 89 kPa (Fig. 7) substantially improved the classification performance across the employed contact pressure range (Table 3). Fig. 4Relative reflectance change as a function of the contact pressure (1, 37, and 90 kPa) for the three selected measurement sites.  Fig. 5(a) Average classification sensitivity and specificity (dots) and posterior probability (squares) of a classifier trained at 0 kPa and evaluated across the full contact pressure range, for the three measurement sites as a function of the applied contact pressure modeled by a pricewise linear (full line) function. (b) Classification sensitivity for the skin above veins (II) (crosses, dot-dashed line) and specificity for the skin above muscle (I) (dots, dashed line) and bone (III) (squares, full line). 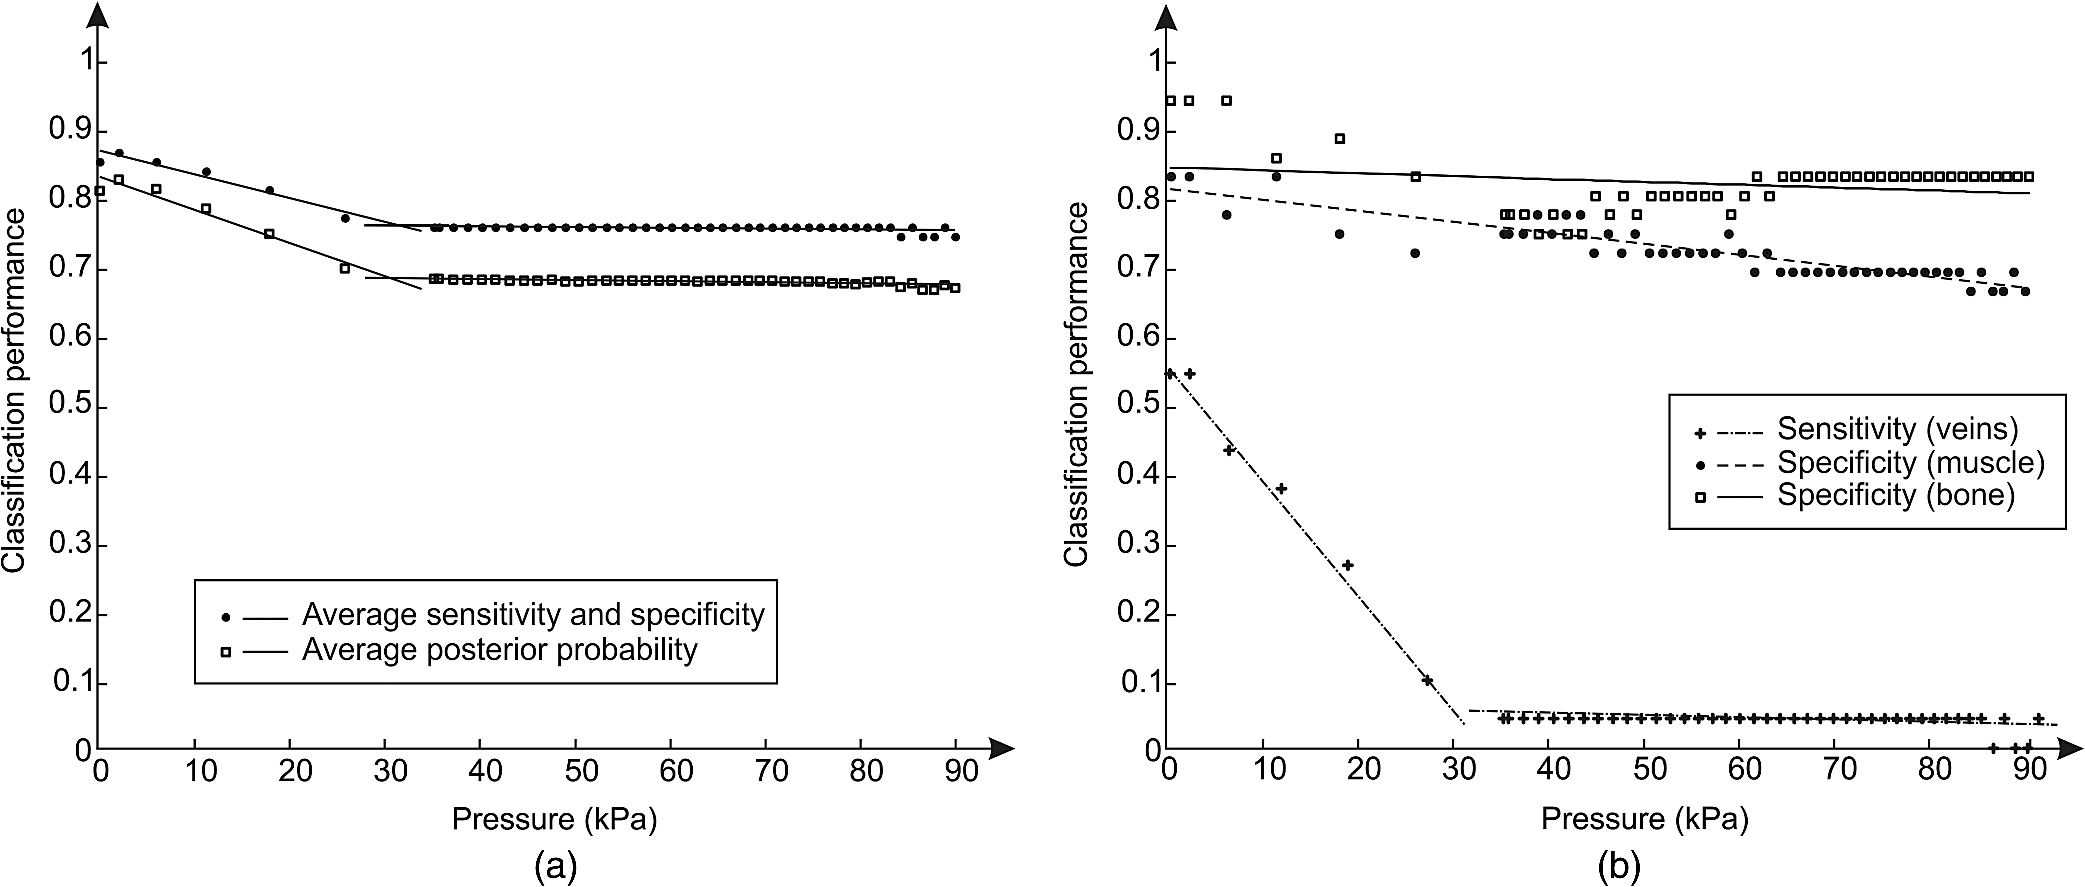 Fig. 6(a) Average classification sensitivity, specificity (both dots) and posterior probability (squares) of classifier trained and evaluated on spectra, acquired at the same contact pressure level, for the three measurement sites: (b) skin above the abductor pollicis brevis muscle (I), (c) skin in the middle of the wrist crease above the veins (II), (d) and skin at the lateral part of the wrist above ulnar styloid process (III), as a function of the applied contact pressure. Average classification sensitivity, specificity (dashed line), and posterior probability (full line) modeled by a first-order polynomial. 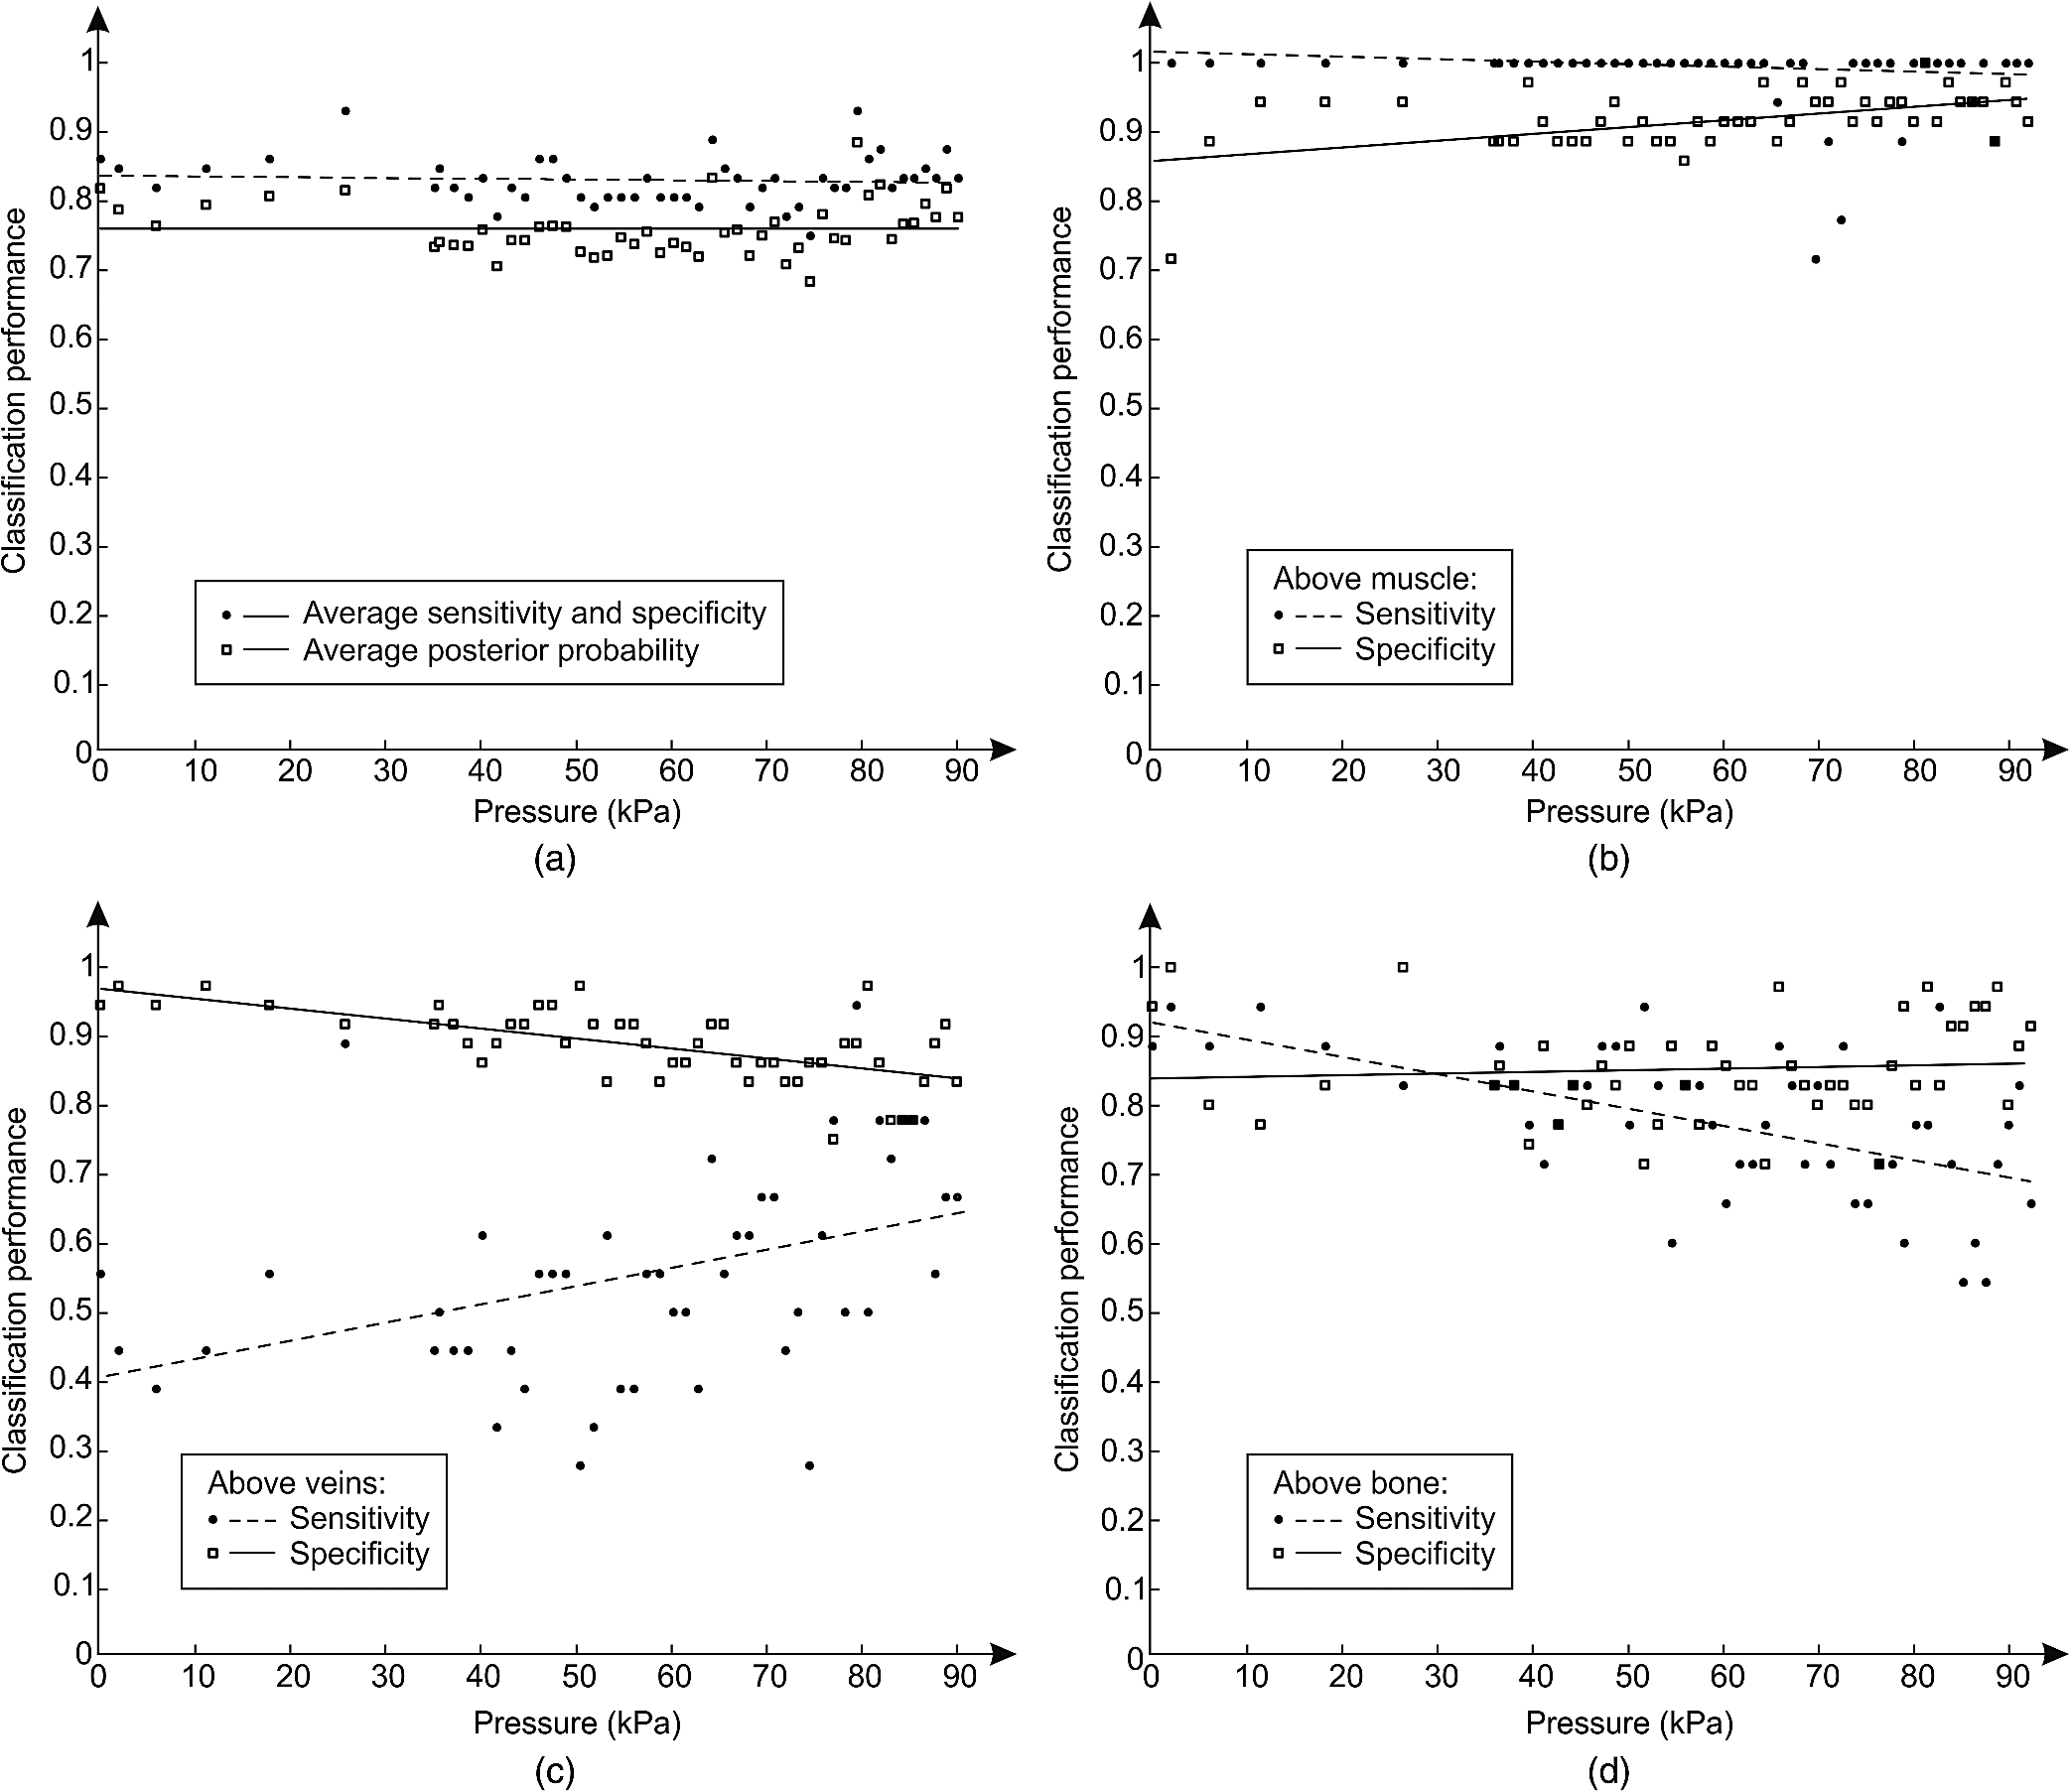 Table 1Classification performance for classifier trained and evaluated at different contact pressure levels: pressure applied by an operator O (37.2 and 8.3 kPa), modified operator pressure mean: Om+ (55.8 and 8.3 kPa) and Om− (18.6 and 8.3 kPa), modified operator pressure standard deviation Os+ (37.2 and 12.5 kPa), Os++ (37.2 and 25.2 kPa), and Os− (37.2 and 4.2 kPa).
Table 2Minimum, maximum, and average classification sensitivity, specificity, and posterior probability and the slope of a first-order polynomial modeling the classification performance of classifiers trained and evaluated at the same contact pressure level as a function of the contact pressure in the range from 0 to 90 kPa. Contact pressure levels (kPa−1) are given in parentheses and keyword “many” is used when the same results were obtained at several different contact pressure levels.
Fig. 7Average classification sensitivity and specificity (dots) and posterior probability (squares) of all the three measurement sites as a function of the applied contact pressure obtained for classifiers trained at 26 kPa (a) and 89 kPa (b), respectively. The useful contact pressure range of each classifier is highlighted by the two flat lines. 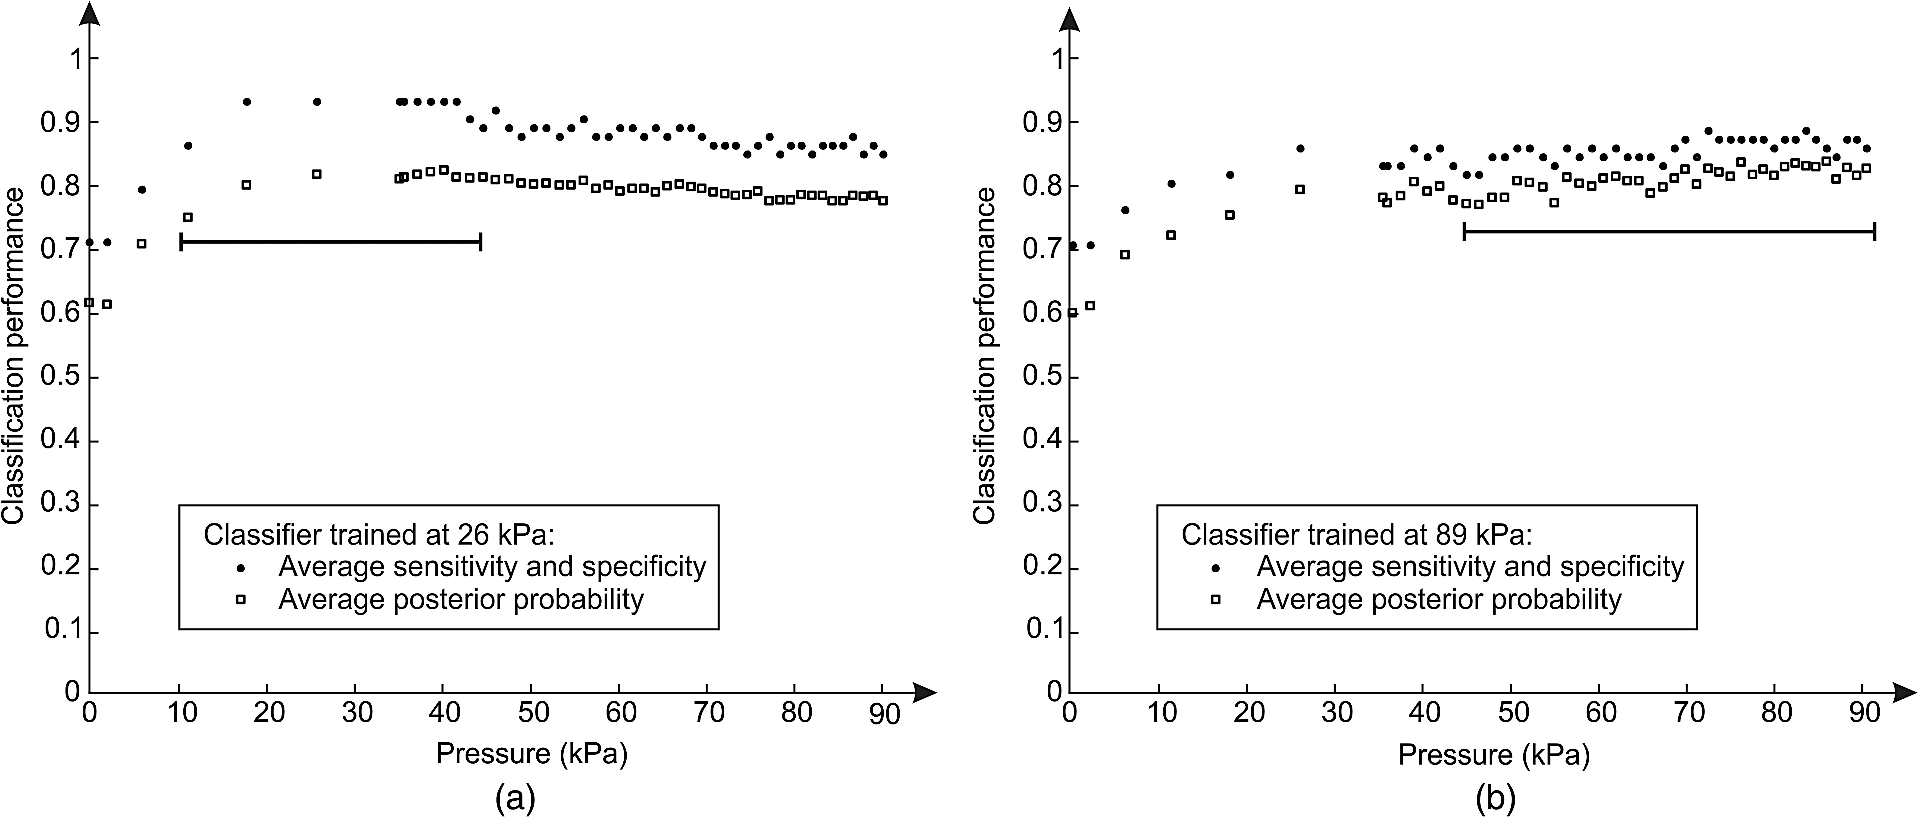 Table 3Average classification sensitivity and specificity and posterior probability across the full contact pressure range for three classifiers. Classifier I was trained at 0 kPa and evaluated across the full contact pressure range [from Fig. 5(a)]. Classifier II was trained and evaluated at the same contact pressure level [from Fig. 6(a)]. Compound classifier III combined three classifiers trained at 0, 26, and 89 kPa and evaluated across the full contact pressure range.
5.DiscussionThe contact pressure–induced spectra changes and their impact on the classification of three measurement sites were studied in the spectral range from 950 to 1600 nm. Compared with the optical window, i.e., spectral range from 650 to 900 nm, the reduced scattering coefficient is not significantly lower,42 however, the average light absorption due to the water is substantially higher. Therefore, it is reasonable to assume that the same contact pressure induces greater spectral changes in the NIR spectral range than in the spectral range from 650 to 900 nm. Our hypothesis is supported by Fig. 4, where reflectance changes under the contact pressure are much greater at longer wavelengths, where light is strongly absorbed by water. The observed spectral changes were consistent with the results of our previous study25 on the contact pressure–induced changes in the spectral and optical properties of soft tissue. Even light contact pressure of 1 kPa significantly lowered the reflectance. The highest mean reflectance decrease was observed near the water absorption band (1450 nm): 12.6% for measurement site I (above muscle), 15.8% for measurement site II (above veins), and 16.9% for measurement site III (above bone). Reflectance further decreased with the applied contact pressure; however, above 20 kPa, changes were less prominent (at 1450 nm) settling at around 54% for all three measurement sites. However, the main focus of this study was to assess the influence of the contact pressure on the classification of the three selected measurement sites on the human hand by training and evaluating classifiers at different contact pressure levels. The classification performances obtained for the two employed spectral processing methodologies (see Secs. 3.4.1 and 3.4.2) described in Sec. 3.4 were similar. Therefore, only the results obtained by the statistical analysis (see Sec. 3.4.2) were reported. It should be noted that regardless of the processing methodology, the SFFS algorithm normally selected four features during the classifier training process. These included the first two PCA scores and the multiplicative () and additive quadratic () EMSC coefficients computed by the statistical Methodology II. On the other hand, concentration of water (), scattering magnitude (), and scattering power () [Eq. (4)] were selected among the optical properties derived by Methodology I. The classifier trained at the minimum contact pressure near 0 kPa was evaluated for all 49 contact pressure levels from 0 to 90 kPa [Fig. 5(a)]. At 0 kPa, the average classification sensitivity and specificity was 0.86 and the corresponding posterior probability was 0.82. By increasing the applied contact pressure, the classification performance started to gradually decrease, settling at the average classification sensitivity and specificity and posterior probability of 0.76 and 0.68, respectively. The results showed a piecewise linear performance dependent on the applied contact pressure. Two prominent linear segments were identified. The first segment extended from 0 kPa to around 31 kPa with a negative slope of the average classification sensitivity and specificity and posterior probability of and , respectively. Above 31 kPa, the slopes flattened out to and , respectively. The basic classification model performed well for contact pressure levels under 10 kPa, where the decrease in the average classification sensitivity and specificity and posterior probability was under 3%. Above 10 kPa, the classification performance gradually decreased, reaching its maximum drop of around 0.14 (20%) at 31 kPa. A detailed analysis of the data [Fig. 5(b)] revealed that the main reason for the classification deterioration was poor performance of the classifier for the measurement site above veins (II), e.g., the sensitivity at 0 kPa was 55%. The number of misclassifications gradually increased with the applied contact pressure, until the sensitivity level dropped to almost zero percent. Likewise, a slight drop in the classification specificity was observed for the remaining two measurement sites. It should be noted that light coupling can be an issue at very low contact pressure levels. Therefore, a classifier trained at the minimum contact pressure (near 0 kPa) was only used to highlight the effect of difference between the training and deployment contact pressure level on the classification performance. Furthermore, Fig. 7 shows that classifiers trained at much higher contact pressures of 26 and 89 kPa exhibit similar deterioration in the classification performance, indicating that the light coupling at the minimum contact pressure level was still sufficient. The consistency of obtained results can be attributed to the employed system for automated contact pressure application,33 that can accurately apply very low contact pressure levels under 1 kPa. A stable, predefined contact pressure level is difficult to maintain27 in practical applications involving manually operated fiber-optic probes. In order to gain insight into the intra- and interoperator contact pressure variability, two operators were trained to apply a contact pressure of about 35 kPa. Analysis of the applied contact pressure repeatability showed that at 5% significance level (Jarque–Bera statistical test) the applied pressure levels exhibited normal distribution, with means of 37.2 and 32.8 kPa and corresponding standard deviations of 8.3 and 6.6 kPa, respectively. First, the influence of trained operator () on the performance of the classification was studied (Table 1). A classifier trained on spectra acquired at minimum contact pressure (0 kPa) was evaluated using spectra acquired by (37.2 and 8.3 kPa). In contrast to the classifier trained and evaluated on spectra acquired at the minimum contact pressure, classification performance dropped substantially. The average classification sensitivity and specificity decreased by 0.09 (13%) and posterior probability decreased by 0.13 (16%). The drop in performance was even higher when the classifier was trained on spectra acquired by operator (37.2 and 8.3 kPa) and evaluated by spectra acquired at minimum contact pressure. The average sensitivity and specificity and posterior probability dropped by 0.16 (19%) and 0.23 (28%), respectively. In contrast, classification performance was significantly better if the classifier was trained and evaluated on spectra acquired at a similar contact pressure level [Table 1, Fig. 6(a)]. The impact of the operator on the classification performance was additionally studied by varying the operator contact pressure mean and standard deviation for about (Table 1). In most cases, changes resulted in minor impact on the classification performance. Average sensitivity and specificity remained around 0.83, while posterior probability was 0.75. However, it should be noted that lowering the contact pressure under 20 kPa substantially affected the classification performance [Fig. 7(a)]. Therefore, it is recommended that pressure levels of all operators are kept well above 20 kPa. However, if this limitation cannot be fulfilled, the contact pressure variability should be minimized. The presented results show that classifiers trained at one contact pressure level and employed at a different level lead to lower classification performance. One possible solution to prevent classification performance degradation is to train and employ the classifier at a predefined contact pressure level. To assess the dependence of the classification performance on the applied contact pressure level, 49 unique classifiers were trained and evaluated at predefined contact pressure levels ranging from 0 to 90 kPa (Fig. 6, Table 2). The average classification sensitivity and specificity across the studied contact pressure range was 0.83 [Fig. 6(a)], with standard deviation of 0.03. A first-order polynomial model of the classification sensitivity and specificity as a function of the applied contact pressure, exhibited a close to zero slope (). Similar results were obtained for the classification posterior probability with the average of 0.76 and standard deviation of 0.04. Jarque–Bera statistical test at 5% significance level showed that classification performances exhibited normal distribution. The results clearly show that the average classification performance is independent of the applied contact pressure as long as all the spectra are acquired at a predefined contact pressure level. However, the classification performance for individual measurement sites was found to depend on the applied contact pressure. Under 10 kPa, some of the spectra acquired above veins (II) were misclassified as skin above muscle (I) or bone (III), lowering the classification sensitivity of skin above veins [Fig. 6(c)], and hence the classification specificities of the remaining two measurement sites [Figs. 6(b) and 6(d)]. At higher contact pressure levels, classification of measurement sites above muscle (I) and veins (II) improved. In contrast, classification sensitivity of skin above bone (III) slightly decreased with the applied contact pressure. The increase in number of misclassifications between the skin above bone (III) and skin above veins (II) was found to be the main reason for the observed classification sensitivity decrease. As a result, classification specificity of the skin above veins (II) slightly decreased with the applied contact pressure [Fig. 6(c)]. The applied contact pressure had no effect on the classification sensitivity of the skin above muscle (III) [Fig. 6(b)]. Although the average classification performance was found independent of the applied contact pressure [Fig. 6(a)], classifiers trained on spectra acquired at higher contact pressure levels exhibited more consistent performance across all the three measurement sites. For example, the poor classification sensitivity of skin above veins (II) gradually improved above 60 kPa [Fig. 6(c)]. Likewise, misclassifications between the skin above muscle (I) and skin above veins (II) vanished at higher contact pressures, whereas the misclassifications between the skin above veins (II) and skin above bone (III) slightly increased. One reason for the improved classification may lie in the different effects of the contact pressure on the perfusion of wrist and muscle tissue, enhancing the spectral differences between the two measurement sites. In contrast, high contact pressure compresses the veins. As a result, more light reaches deep wrist ligaments and carpal bones, making the spectra of skin above veins (II) and bone (III) similar, hence increasing the number of misclassifications between the two measurement sites. Training classifiers at many contact pressure levels can be a tedious and impractical task. Therefore, only a few critical contact pressure levels should be identified and used to build representative classification models covering the desired contact pressure range. In this study, three classifiers provided stable classification performance across the full pressure range. Classifier [Fig. 5(a)] trained at minimum contact pressure covered the contact pressure range from 0 to 10 kPa, classifier trained at 26 kPa [Fig. 7(a)] covered the contact pressure range from 10 to 45 kPa, while classifier trained at 89 kPa [Fig. 7(b)] covered the contact pressure range from 45 to 90 kPa. The results clearly show that the three classifiers trained at the selected contact pressure levels provide significant classification performance improvement (Table 3) across the full contact pressure range. Moreover, the proposed classification scheme can be easily adopted by existing setups comprising a metal sleeve and spring,21,23,27 where approximate contact pressure level can be easily assessed for each acquired spectrum. 6.GuidelinesBased on the presented results, we propose a set of practical guidelines limiting the effect of contact pressure on the classification performance of existing DRS measurement setups employing fiber-optic probes.
7.ConclusionsThe review of existing studies revealed that the observed pressure-induced changes in the tissue optical properties are inconsistent. We have shown that these changes strongly affect the classification performance. Therefore, it is essential to carefully consider the contact pressure level and range at which the classifier is built and deployed. In this study, we investigated several realistic scenarios and proposed a set of guidelines minimizing the effect of the observed pressure-induced spectral changes on the classification performance in existing diffuse reflectance measurement setups. AcknowledgmentsThis work was supported by the Slovenian Research Agency under the grants L2-4072, J7-2246, L2-2023, and P2-0232. ReferencesV. R. KondepatiH. M. HeiseJ. Backhaus,
“Recent applications of near-infrared spectroscopy in cancer diagnosis and therapy,”
Anal. Bioanal. Chem., 390
(1), 125
–139
(2008). http://dx.doi.org/10.1007/s00216-007-1651-y ABCNBP 1618-2642 Google Scholar
L. M. McIntoshet al.,
“Towards non-invasive screening of skin lesions by near infrared spectroscopy,”
J. Invest. Dermatol., 116
(1), 175
–181
(2001). http://dx.doi.org/10.1046/j.1523-1747.2001.00212.x JIDEAE 0022-202X Google Scholar
B. J. Tromberget al.,
“Imaging in breast cancer—Diffuse optics in breast cancer: detecting tumors in pre-menopausal women and monitoring neoadjuvant chemotherapy,”
Breast Cancer Res., 7
(6), 279
–285
(2005). http://dx.doi.org/10.1186/bcr1358 BCTRD6 Google Scholar
K. M. Crosset al.,
“Clinical utilization of near-infrared spectroscopy devices for burn depth assessment,”
Wound Repair Regen., 15
(3), 332
–340
(2007). http://dx.doi.org/10.1111/wrr.2007.15.issue-3 WREREU 1067-1927 Google Scholar
A. PellicerM. del Carmen Bravo,
“Near-infrared spectroscopy: a methodology-focused review,”
Semin. Fetal. Neonatal Med., 16
(1), 42
–49
(2011). http://dx.doi.org/10.1016/j.siny.2010.05.003 1744-165X Google Scholar
T. W. L. ScheerenP. SchoberL. A. Schwarte,
“Monitoring tissue oxygenation by near infrared spectroscopy (NIRS): background and current applications,”
J. Clin. Monit. Comput., 26
(4), 279
–287
(2012). http://dx.doi.org/10.1007/s10877-012-9348-y IJMCEJ 0167-9945 Google Scholar
P. Useniket al.,
“Automated classification and visualization of healthy and diseased hard dental tissues by near-infrared hyperspectral imaging,”
Appl. Spectrosc., 66
(9), 1067
–1074
(2012). http://dx.doi.org/10.1366/11-06460 APSPA4 0003-7028 Google Scholar
L. N. LiQ. B. LiG. J. Zhang,
“A weak signal extraction method for human blood glucose noninvasive measurement using near infrared spectroscopy,”
J. Infrared Millim. Terahertz Waves, 30
(11), 1191
–1204
(2009). http://dx.doi.org/10.1007/s10762-009-9544-0 1866-6892 Google Scholar
K. X. Xuet al.,
“Non-invasive glucose sensing with near-infrared spectroscopy enhanced by optical measurement conditions reproduction technique,”
Opt. Lasers Eng., 43
(10), 1096
–1106
(2005). http://dx.doi.org/10.1016/j.optlaseng.2004.06.018 OLENDN 0143-8166 Google Scholar
H. Heiseet al.,
“Clinical chemistry and near infrared spectroscopy: multicomponent assay for human plasma and its evaluation for the determination of blood substrates,”
J. Infrared Spectrosc., 6
(1), 361
–374
(1998). http://dx.doi.org/10.1255/jnirs.157 0967-0335 Google Scholar
D. LafranceL. C. LandsD. H. Burns,
“In vivo lactate measurement in human tissue by near-infrared diffuse reflectance spectroscopy,”
Vib. Spectrosc., 36
(2), 195
–202
(2004). http://dx.doi.org/10.1016/j.vibspec.2004.01.020 VISPEK 0924-2031 Google Scholar
L. YuB. Xiang,
“Quantitative determination of acyclovir in plasma by near infrared spectroscopy,”
Microchem. J., 90
(1), 63
–66
(2008). http://dx.doi.org/10.1016/j.microc.2008.03.006 MICJAN 0026-265X Google Scholar
C. GendrinY. RoggoC. Collet,
“Pharmaceutical applications of vibrational chemical imaging and chemometrics: a review,”
J. Pharm. Biomed. Anal., 48
(3), 533
–553
(2008). http://dx.doi.org/10.1016/j.jpba.2008.08.014 JPBADA 0731-7085 Google Scholar
H. CenY. He,
“Theory and application of near infrared reflectance spectroscopy in determination of food quality,”
Trends Food Sci. Technol., 18
(2), 72
–83
(2007). http://dx.doi.org/10.1016/j.tifs.2006.09.003 TFTEEH 0924-2244 Google Scholar
E. K. Chanet al.,
“Effects of compression on soft tissue optical properties,”
IEEE J. Sel. Top. Quantum Electron., 2
(4), 943
–950
(1996). http://dx.doi.org/10.1109/2944.577320 IJSQEN 1077-260X Google Scholar
S. D. Jianget al.,
“In vivo near-infrared spectral detection of pressure-induced changes in breast tissue,”
Opt. Lett., 28
(14), 1212
–1214
(2003). http://dx.doi.org/10.1364/OL.28.001212 OPLEDP 0146-9592 Google Scholar
L. L. Randeberg,
“Diagnostic applications of diffuse reflectance spectroscopy,”
Norwegian University of Science and Technology,
(2005). Google Scholar
W. L. Chenet al.,
“Influence of contact state on NIR diffuse reflectance spectroscopy in vivo,”
J. Phys. Appl. Phys., 38
(15), 2691
–2695
(2005). http://dx.doi.org/10.1088/0022-3727/38/15/022 JPAPBE 0022-3727 Google Scholar
S. A. Carpet al.,
“Compression-induced changes in the physiological state of the breast as observed through frequency domain photon migration measurements,”
J. Biomed. Opt., 11
(6), 064016
(2006). http://dx.doi.org/10.1117/1.2397572 JBOPFO 1083-3668 Google Scholar
R. Reifet al.,
“Analysis of changes in reflectance measurements on biological tissues subjected to different probe pressures,”
J. Biomed. Opt., 13
(1), 010502
(2008). http://dx.doi.org/10.1117/1.2870115 JBOPFO 1083-3668 Google Scholar
J. A. Delgado Atencioet al.,
“Influence of probe pressure on human skin diffuse reflectance spectroscopy measurements,”
Opt. Mem. Neural Netw., 18
(1), 6
–14
(2009). http://dx.doi.org/10.3103/S1060992X09010020 OMNNE8 1060-992X Google Scholar
A. Cerussiet al.,
“Effect of contact force on breast tissue optical property measurements using a broadband diffuse optical spectroscopy handheld probe,”
Appl. Opt., 48
(21), 4270
–4277
(2009). http://dx.doi.org/10.1364/AO.48.004270 APOPAI 0003-6935 Google Scholar
L. Limet al.,
“Probe pressure effects on human skin diffuse reflectance and fluorescence spectroscopy measurements,”
J. Biomed. Opt., 16
(1), 011012
(2011). http://dx.doi.org/10.1117/1.3525288 JBOPFO 1083-3668 Google Scholar
W. C. Vogtet al.,
“Effects of mechanical indentation on diffuse reflectance spectra, light transmission, and intrinsic optical properties in ex vivo porcine skin,”
Lasers Surg. Med., 44
(4), 303
–309
(2012). http://dx.doi.org/10.1002/lsm.v44.4 LSMEDI 0196-8092 Google Scholar
B. Cugmaset al.,
“Pressure-induced near infrared spectra response as a valuable source of information for soft tissue classification,”
J. Biomed. Opt., 18
(4), 047002
(2013). http://dx.doi.org/10.1117/1.JBO.18.4.047002 JBOPFO 1083-3668 Google Scholar
H. Shangguanet al.,
“Pressure effects on soft tissues monitored by changes in tissue optical properties,”
Proc. SPIE, 3254 366
–371
(1998). http://dx.doi.org/10.1117/12.308187 PSISDG 0277-786X Google Scholar
A. Nathet al.,
“Effect of probe pressure on cervical fluorescence spectroscopy measurements,”
J. Biomed. Opt., 9
(3), 523
–533
(2004). http://dx.doi.org/10.1117/1.1695562 JBOPFO 1083-3668 Google Scholar
V. V. Sapozhnikovaet al.,
“Effect on blood glucose monitoring of skin pressure exerted by an optical coherence tomography probe,”
J. Biomed. Opt., 13
(2), 021112
(2008). http://dx.doi.org/10.1117/1.2909671 JBOPFO 1083-3668 Google Scholar
P. F. M. SmuldersN. Janssen,
“Influence of probe pressure when using MM-wave open-ended probe for diagnosis of the human skin,”
Microw. Opt. Technol. Lett., 54
(10), 2341
–2342
(2012). http://dx.doi.org/10.1002/mop.27074 MOTLEO 0895-2477 Google Scholar
B. Cugmaset al.,
“Analysis of soft tissue near infrared spectra under dynamic pressure effects,”
Proc. SPIE, 8220 21
–26
(2012). http://dx.doi.org/10.1117/12.908614 PSISDG 0277-786X Google Scholar
P. Abrahamet al.,
“Dynamics of local pressure-induced cutaneous vasodilation in the human hand,”
Microvasc. Res., 61
(1), 122
–129
(2001). http://dx.doi.org/10.1006/mvre.2000.2290 MIVRA6 0026-2862 Google Scholar
S. F. Bishet al.,
“Development of a noncontact diffuse optical spectroscopy probe for measuring tissue optical properties,”
J. Biomed. Opt., 16
(12), 120505
(2011). http://dx.doi.org/10.1117/1.3662459 JBOPFO 1083-3668 Google Scholar
M. Bregaret al.,
“Contact pressure aided spectroscopy,”
J. Biomed. Opt., 19
(2), 020501
(2014). http://dx.doi.org/10.1117/1.JBO.19.2.020501 JBOPFO 1083-3668 Google Scholar
J. Sunet al.,
“Influence of fiber optic probe geometry on the applicability of inverse models of tissue reflectance spectroscopy: computational models and experimental measurements,”
Appl. Opt., 45
(31), 8152
–8162
(2006). http://dx.doi.org/10.1364/AO.45.008152 APOPAI 0003-6935 Google Scholar
A. KimB. Wilson,
“Measurement of ex vivo and in vivo tissue optical properties: methods and theories,”
Opt.-Therm. Response Laser-Irradiat. Tissue, 267
–319 Springer, Netherlands
(2011). Google Scholar
D. Segelstein,
“The complex refractive index of water,”
University of Missouri,
(1981). Google Scholar
J. KuenstnerK. Norris,
“Spectrophotometry of human hemoglobin in the near infrared region from 1000 to 2500 nm,”
J. Infrared Spectrosc., 2
(1), 59
–65
(1994). http://dx.doi.org/10.1255/jnirs.32 0967-0335 Google Scholar
R. Nachabeet al.,
“Diagnosis of breast cancer using diffuse optical spectroscopy from 500 to 1600 nm: comparison of classification methods,”
J. Biomed. Opt., 16
(8), 087010
(2011). http://dx.doi.org/10.1117/1.3611010 JBOPFO 1083-3668 Google Scholar
H. MartensJ. P. NielsenS. B. Engelsen,
“Light scattering and light absorbance separated by extended multiplicative signal correction. Application to near-infrared transmission analysis of powder mixtures,”
Anal. Chem., 75
(3), 394
–404
(2003). http://dx.doi.org/10.1021/ac020194w ANCHAM 0003-2700 Google Scholar
T. Næset al., A User Friendly Guide to Multivariate Calibration and Classification, NIR Publications, Chichester
(2002). Google Scholar
P. PudilJ. NovovicovaJ. Kittler,
“Floating search methods in feature selection,”
Pattern Recognit. Lett., 15
(11), 1119
–1125
(1994). http://dx.doi.org/10.1016/0167-8655(94)90127-9 PRLEDG 0167-8655 Google Scholar
A. N. Bashkatovet al.,
“Optical properties of human skin, subcutaneous and mucous tissues in the wavelength range from 400 to 2000 nm,”
J. Phys. -Appl. Phys., 38
(15), 2543
–2555
(2005). http://dx.doi.org/10.1088/0022-3727/38/15/004 JPAPBE 0022-3727 Google Scholar
BiographyBlaž Cugmas, BSc, is a PhD candidate at the Department of Electrical Engineering, University of Ljubljana. He is a member of the Laboratory of Imaging Technologies and his research interests involve the processing of biomedical signals and the analysis of tissues with diffuse reflectance spectroscopy. Maksimilijan Bregar, BSc, is a PhD student at the Department of Electrical Engineering, University of Ljubljana. He is a member of the Laboratory of Imaging Technologies and his research interests focus on contact pressure-aided spectroscopy and experimental techniques for measuring tissue optical properties. Miran Bürmen, PhD, is an assistant professor at the Department of Electrical Engineering, University of Ljubljana. He is a member of the Laboratory of Imaging Technologies and his research interests concentrate on the development of hyperspectral imaging systems for various biomedical and industrial applications. Franjo Pernuš, PhD, is a professor at the Department of Electrical Engineering, University of Ljubljana. He is a head of the Laboratory of Imaging Technologies and his research interests involve biomedical image processing and analysis, computer vision, and the applications of image processing and analysis techniques to various biomedical and industrial problems. He is a co-founder of the high-tech company Sensum, which supplies machine vision solutions for the pharmaceutical industry. Boštjan Likar, PhD, is a professor at the Department of Electrical Engineering, University of Ljubljana. He is a member of the Laboratory of Imaging Technologies and his research interests focus on visual quality inspection, computer and machine vision systems, biomedical image processing, and hyperspectral imaging. He is a co-founder of the high-tech company Sensum, which supplies machine vision solutions for the pharmaceutical industry. |
|||||||||||||||||||||||||||||||||||||||||||||||||||||||||||||||||||||||||||||||||||||||||||||||||||||||||||||||||||||||||||||||||||||||||||||||||||||||||||||||||||||||||||||||||||||||||||||||